Graphitic carbons and biosignatures
1
2014
... 自然界中的碳质物质广泛存在,有生物[1 ,2 ] 、热液[3 ,4 ,5 ] 、或地外等多种成因[6 ,7 ] .对于生物成因的碳质物质,在埋藏受热过程中,其成分和结构会发生两种连续的变化:碳化与石墨化[8 ,9 ,10 ,11 ,12 ,13 ] .在碳化阶段,非碳原子被逐渐排出体系,碳原子开始形成六边形的芳香环骨架,而在接下来的石墨化过程中这些芳香环骨架会发生聚合并在结构上重新排列,形成更加稳定的ABAB层状叠置的石墨结构[8 ,9 ,10 ,11 ,12 ,13 ] .大量学者通过X射线衍射(X-Ray Diffraction, XRD)、透射电子显微镜(Transmission Electron Microscope, TEM)和拉曼光谱(Raman Spectrum, RS)等方法,证实碳质物质石墨化的程度与母岩变质级别紧密相关[14 ,15 ,16 ,17 ,18 ] .基于这些认识,国内外诸多学者开发并应用了碳质拉曼光谱温度计[19 ,20 ,21 ] . ...
Molecular preservation of 1.88 Ga Gunflint organic microfossils as a function of temperature and mineralogy
2
2016
... 自然界中的碳质物质广泛存在,有生物[1 ,2 ] 、热液[3 ,4 ,5 ] 、或地外等多种成因[6 ,7 ] .对于生物成因的碳质物质,在埋藏受热过程中,其成分和结构会发生两种连续的变化:碳化与石墨化[8 ,9 ,10 ,11 ,12 ,13 ] .在碳化阶段,非碳原子被逐渐排出体系,碳原子开始形成六边形的芳香环骨架,而在接下来的石墨化过程中这些芳香环骨架会发生聚合并在结构上重新排列,形成更加稳定的ABAB层状叠置的石墨结构[8 ,9 ,10 ,11 ,12 ,13 ] .大量学者通过X射线衍射(X-Ray Diffraction, XRD)、透射电子显微镜(Transmission Electron Microscope, TEM)和拉曼光谱(Raman Spectrum, RS)等方法,证实碳质物质石墨化的程度与母岩变质级别紧密相关[14 ,15 ,16 ,17 ,18 ] .基于这些认识,国内外诸多学者开发并应用了碳质拉曼光谱温度计[19 ,20 ,21 ] . ...
... 在油气地质学领域,镜质体反射率是反映有机质热演化成熟度比较通用的指标,是进行有机质生油阶段(温度小于约250 ℃)划分的标尺[91 ,92 ] .而在更高的有机质成熟阶段,镜质体反射率指标敏感度降低[92 ,93 ] ,同时有些样品可能不含镜质体[28 ] ,为了完善有机质成熟度的判断方法,诸多学者尝试利用有机质拉曼光谱分析进行成熟度评价:Kelemen等[93 ] 发现随成熟度增加,拉曼谱峰中D峰与G峰面积比值减小;刘德汉等[94 ] 利用不同热演化程度的样品,得出适用于高成熟度样品的成熟度计算经验公式;Wilkins等[95 ,96 ] 也根据不同热演化程度煤的拉曼光谱特征建立了有机质成熟度的计算方法;王民等[97 ] 在Wilkins等[95 ,96 ] 的工作基础上建立了一种镜质组随机反射率(Rr )在0.4%~2.5%范围内的有机质热成熟度评价的拉曼模型;张聪等[98 ] 结合样品扫描电镜分析结果,验证了拉曼光谱技术是测定高成熟度有机质的一种行之有效的手段.这些研究表明了有机质激光拉曼再判断有机质成熟度方面的潜力,尤其是镜质体缺失或镜质体反射率受到抑制或识别困难的沉积岩中具有广阔的应用前景[97 ] .在其他地球科学领域,也有石墨化碳质物质拉曼光谱温度计的应用方向:如探究岩浆侵入所伴随的热效应[19 ,49 ] ,球粒陨石的热演化[7 ] ,示踪沉积物源区与碳质物质经历的沉积循环[99 ,100 ,101 ,102 ] ,有机质矿化过程中的变质温度[2 ] ,造山带剥蚀过程[84 ,85 ] 等. ...
Natural fluid-deposited graphite: Mineralogical characteristics and mechanisms of formation
1
1998
... 自然界中的碳质物质广泛存在,有生物[1 ,2 ] 、热液[3 ,4 ,5 ] 、或地外等多种成因[6 ,7 ] .对于生物成因的碳质物质,在埋藏受热过程中,其成分和结构会发生两种连续的变化:碳化与石墨化[8 ,9 ,10 ,11 ,12 ,13 ] .在碳化阶段,非碳原子被逐渐排出体系,碳原子开始形成六边形的芳香环骨架,而在接下来的石墨化过程中这些芳香环骨架会发生聚合并在结构上重新排列,形成更加稳定的ABAB层状叠置的石墨结构[8 ,9 ,10 ,11 ,12 ,13 ] .大量学者通过X射线衍射(X-Ray Diffraction, XRD)、透射电子显微镜(Transmission Electron Microscope, TEM)和拉曼光谱(Raman Spectrum, RS)等方法,证实碳质物质石墨化的程度与母岩变质级别紧密相关[14 ,15 ,16 ,17 ,18 ] .基于这些认识,国内外诸多学者开发并应用了碳质拉曼光谱温度计[19 ,20 ,21 ] . ...
Deposition of highly crystalline graphite from moderate-temperature fluids
1
2009
... 自然界中的碳质物质广泛存在,有生物[1 ,2 ] 、热液[3 ,4 ,5 ] 、或地外等多种成因[6 ,7 ] .对于生物成因的碳质物质,在埋藏受热过程中,其成分和结构会发生两种连续的变化:碳化与石墨化[8 ,9 ,10 ,11 ,12 ,13 ] .在碳化阶段,非碳原子被逐渐排出体系,碳原子开始形成六边形的芳香环骨架,而在接下来的石墨化过程中这些芳香环骨架会发生聚合并在结构上重新排列,形成更加稳定的ABAB层状叠置的石墨结构[8 ,9 ,10 ,11 ,12 ,13 ] .大量学者通过X射线衍射(X-Ray Diffraction, XRD)、透射电子显微镜(Transmission Electron Microscope, TEM)和拉曼光谱(Raman Spectrum, RS)等方法,证实碳质物质石墨化的程度与母岩变质级别紧密相关[14 ,15 ,16 ,17 ,18 ] .基于这些认识,国内外诸多学者开发并应用了碳质拉曼光谱温度计[19 ,20 ,21 ] . ...
Hydrothermal graphitic carbon
1
2014
... 自然界中的碳质物质广泛存在,有生物[1 ,2 ] 、热液[3 ,4 ,5 ] 、或地外等多种成因[6 ,7 ] .对于生物成因的碳质物质,在埋藏受热过程中,其成分和结构会发生两种连续的变化:碳化与石墨化[8 ,9 ,10 ,11 ,12 ,13 ] .在碳化阶段,非碳原子被逐渐排出体系,碳原子开始形成六边形的芳香环骨架,而在接下来的石墨化过程中这些芳香环骨架会发生聚合并在结构上重新排列,形成更加稳定的ABAB层状叠置的石墨结构[8 ,9 ,10 ,11 ,12 ,13 ] .大量学者通过X射线衍射(X-Ray Diffraction, XRD)、透射电子显微镜(Transmission Electron Microscope, TEM)和拉曼光谱(Raman Spectrum, RS)等方法,证实碳质物质石墨化的程度与母岩变质级别紧密相关[14 ,15 ,16 ,17 ,18 ] .基于这些认识,国内外诸多学者开发并应用了碳质拉曼光谱温度计[19 ,20 ,21 ] . ...
Presolar graphitic carbon spherules: Rocks from stars
1
2014
... 自然界中的碳质物质广泛存在,有生物[1 ,2 ] 、热液[3 ,4 ,5 ] 、或地外等多种成因[6 ,7 ] .对于生物成因的碳质物质,在埋藏受热过程中,其成分和结构会发生两种连续的变化:碳化与石墨化[8 ,9 ,10 ,11 ,12 ,13 ] .在碳化阶段,非碳原子被逐渐排出体系,碳原子开始形成六边形的芳香环骨架,而在接下来的石墨化过程中这些芳香环骨架会发生聚合并在结构上重新排列,形成更加稳定的ABAB层状叠置的石墨结构[8 ,9 ,10 ,11 ,12 ,13 ] .大量学者通过X射线衍射(X-Ray Diffraction, XRD)、透射电子显微镜(Transmission Electron Microscope, TEM)和拉曼光谱(Raman Spectrum, RS)等方法,证实碳质物质石墨化的程度与母岩变质级别紧密相关[14 ,15 ,16 ,17 ,18 ] .基于这些认识,国内外诸多学者开发并应用了碳质拉曼光谱温度计[19 ,20 ,21 ] . ...
Temperature constraints by raman spectroscopy of organic matter in volatile-rich clasts and carbonaceous chondrites
2
2018
... 自然界中的碳质物质广泛存在,有生物[1 ,2 ] 、热液[3 ,4 ,5 ] 、或地外等多种成因[6 ,7 ] .对于生物成因的碳质物质,在埋藏受热过程中,其成分和结构会发生两种连续的变化:碳化与石墨化[8 ,9 ,10 ,11 ,12 ,13 ] .在碳化阶段,非碳原子被逐渐排出体系,碳原子开始形成六边形的芳香环骨架,而在接下来的石墨化过程中这些芳香环骨架会发生聚合并在结构上重新排列,形成更加稳定的ABAB层状叠置的石墨结构[8 ,9 ,10 ,11 ,12 ,13 ] .大量学者通过X射线衍射(X-Ray Diffraction, XRD)、透射电子显微镜(Transmission Electron Microscope, TEM)和拉曼光谱(Raman Spectrum, RS)等方法,证实碳质物质石墨化的程度与母岩变质级别紧密相关[14 ,15 ,16 ,17 ,18 ] .基于这些认识,国内外诸多学者开发并应用了碳质拉曼光谱温度计[19 ,20 ,21 ] . ...
... 在油气地质学领域,镜质体反射率是反映有机质热演化成熟度比较通用的指标,是进行有机质生油阶段(温度小于约250 ℃)划分的标尺[91 ,92 ] .而在更高的有机质成熟阶段,镜质体反射率指标敏感度降低[92 ,93 ] ,同时有些样品可能不含镜质体[28 ] ,为了完善有机质成熟度的判断方法,诸多学者尝试利用有机质拉曼光谱分析进行成熟度评价:Kelemen等[93 ] 发现随成熟度增加,拉曼谱峰中D峰与G峰面积比值减小;刘德汉等[94 ] 利用不同热演化程度的样品,得出适用于高成熟度样品的成熟度计算经验公式;Wilkins等[95 ,96 ] 也根据不同热演化程度煤的拉曼光谱特征建立了有机质成熟度的计算方法;王民等[97 ] 在Wilkins等[95 ,96 ] 的工作基础上建立了一种镜质组随机反射率(Rr )在0.4%~2.5%范围内的有机质热成熟度评价的拉曼模型;张聪等[98 ] 结合样品扫描电镜分析结果,验证了拉曼光谱技术是测定高成熟度有机质的一种行之有效的手段.这些研究表明了有机质激光拉曼再判断有机质成熟度方面的潜力,尤其是镜质体缺失或镜质体反射率受到抑制或识别困难的沉积岩中具有广阔的应用前景[97 ] .在其他地球科学领域,也有石墨化碳质物质拉曼光谱温度计的应用方向:如探究岩浆侵入所伴随的热效应[19 ,49 ] ,球粒陨石的热演化[7 ] ,示踪沉积物源区与碳质物质经历的沉积循环[99 ,100 ,101 ,102 ] ,有机质矿化过程中的变质温度[2 ] ,造山带剥蚀过程[84 ,85 ] 等. ...
Evolution of the Raman spectrum of carbonaceous material in low-grade metasediments of the Glarus Alps (Switzerland)
5
2010
... 自然界中的碳质物质广泛存在,有生物[1 ,2 ] 、热液[3 ,4 ,5 ] 、或地外等多种成因[6 ,7 ] .对于生物成因的碳质物质,在埋藏受热过程中,其成分和结构会发生两种连续的变化:碳化与石墨化[8 ,9 ,10 ,11 ,12 ,13 ] .在碳化阶段,非碳原子被逐渐排出体系,碳原子开始形成六边形的芳香环骨架,而在接下来的石墨化过程中这些芳香环骨架会发生聚合并在结构上重新排列,形成更加稳定的ABAB层状叠置的石墨结构[8 ,9 ,10 ,11 ,12 ,13 ] .大量学者通过X射线衍射(X-Ray Diffraction, XRD)、透射电子显微镜(Transmission Electron Microscope, TEM)和拉曼光谱(Raman Spectrum, RS)等方法,证实碳质物质石墨化的程度与母岩变质级别紧密相关[14 ,15 ,16 ,17 ,18 ] .基于这些认识,国内外诸多学者开发并应用了碳质拉曼光谱温度计[19 ,20 ,21 ] . ...
... [8 ,9 ,10 ,11 ,12 ,13 ].大量学者通过X射线衍射(X-Ray Diffraction, XRD)、透射电子显微镜(Transmission Electron Microscope, TEM)和拉曼光谱(Raman Spectrum, RS)等方法,证实碳质物质石墨化的程度与母岩变质级别紧密相关[14 ,15 ,16 ,17 ,18 ] .基于这些认识,国内外诸多学者开发并应用了碳质拉曼光谱温度计[19 ,20 ,21 ] . ...
... (2)分峰拟合.由于石墨峰(G峰)与缺陷峰(D峰)都具有一定的分布范围,当信号重叠时很难直接获得单个谱峰的信号强度与分布面积,因此需对光谱进行分峰拟合.使用不同的拟合函数会在一定程度上影响谱峰拟合的强度与面积,并最终影响温度计算结果,因此需选用合适的光谱拟合函数.光谱拟合函数种类多样,如线性函数(Linear)、多项式函数(Polyomial)、高斯函数(Gauss)、福格特函数(Voigt)和洛伦兹函数(Lorentzian)等.对于石墨拉曼光谱,常用的拟合函数为福格特函数和洛伦兹函数[8 ,19 ,24 ,35 ] .Lahfid等[8 ] 认为在变质温度较低时应使用洛伦兹函数对光谱进行分析,而Beyssca等[24 ] 的研究主要使用福格特函数.为了对比拟合函数不同对结果的影响,Lünsdorf等[35 ] 分别使用洛伦兹和福格特函数对19个不同变质温度的样品进行了光谱拟合,结果显示仅在低温(约小于350 ℃)变质样品的光谱拟合结果上产生较大差别,中高温变质样品未见明显区别.通过温度计算结果与其他温度计测温结果对比显示,在低温变质区间,洛伦兹函数的光谱拟合结果明显比福格特函数更加准确[35 ] .因此不论在何种温度区间,均可使用洛伦兹函数对光谱进行拟合分析.另外根据作者对龙门山云母片岩、胶北矽线石榴片麻岩的测试结果,在中高温变质区间,使用两种光谱拟合函数最终获得的变质温度差别小于10 ℃,因此统一使用洛伦兹函数进行光谱分析较为合理(图1 a). ...
... [8 ]认为在变质温度较低时应使用洛伦兹函数对光谱进行分析,而Beyssca等[24 ] 的研究主要使用福格特函数.为了对比拟合函数不同对结果的影响,Lünsdorf等[35 ] 分别使用洛伦兹和福格特函数对19个不同变质温度的样品进行了光谱拟合,结果显示仅在低温(约小于350 ℃)变质样品的光谱拟合结果上产生较大差别,中高温变质样品未见明显区别.通过温度计算结果与其他温度计测温结果对比显示,在低温变质区间,洛伦兹函数的光谱拟合结果明显比福格特函数更加准确[35 ] .因此不论在何种温度区间,均可使用洛伦兹函数对光谱进行拟合分析.另外根据作者对龙门山云母片岩、胶北矽线石榴片麻岩的测试结果,在中高温变质区间,使用两种光谱拟合函数最终获得的变质温度差别小于10 ℃,因此统一使用洛伦兹函数进行光谱分析较为合理(图1 a). ...
... 除了上述地区的研究外,碳质物质拉曼温度计还被广泛应用于其他造山带的研究:如阿尔卑斯(Alps)造山带的变质温度、断层位置、俯冲过程中碳循环、地壳缩短模式[8 ,75 ,77 ,80 ,81 ] ;希腊克里特(Crete)地区拆离断层所引起变质温度突变[21 ] ;爱琴海两侧亚伯兰穹隆构造(Alboran Domain)[82 ] ;意大利阿普亚内山(Alpi Apuane)[83 ] 、中国台湾和日本[19 ,20 ,84 ,85 ] 的构造变形与变质作用. ...
Application of raman spectroscopy to the study of graphitic carbons in the Earth science
9
2012
... 自然界中的碳质物质广泛存在,有生物[1 ,2 ] 、热液[3 ,4 ,5 ] 、或地外等多种成因[6 ,7 ] .对于生物成因的碳质物质,在埋藏受热过程中,其成分和结构会发生两种连续的变化:碳化与石墨化[8 ,9 ,10 ,11 ,12 ,13 ] .在碳化阶段,非碳原子被逐渐排出体系,碳原子开始形成六边形的芳香环骨架,而在接下来的石墨化过程中这些芳香环骨架会发生聚合并在结构上重新排列,形成更加稳定的ABAB层状叠置的石墨结构[8 ,9 ,10 ,11 ,12 ,13 ] .大量学者通过X射线衍射(X-Ray Diffraction, XRD)、透射电子显微镜(Transmission Electron Microscope, TEM)和拉曼光谱(Raman Spectrum, RS)等方法,证实碳质物质石墨化的程度与母岩变质级别紧密相关[14 ,15 ,16 ,17 ,18 ] .基于这些认识,国内外诸多学者开发并应用了碳质拉曼光谱温度计[19 ,20 ,21 ] . ...
... ,9 ,10 ,11 ,12 ,13 ].大量学者通过X射线衍射(X-Ray Diffraction, XRD)、透射电子显微镜(Transmission Electron Microscope, TEM)和拉曼光谱(Raman Spectrum, RS)等方法,证实碳质物质石墨化的程度与母岩变质级别紧密相关[14 ,15 ,16 ,17 ,18 ] .基于这些认识,国内外诸多学者开发并应用了碳质拉曼光谱温度计[19 ,20 ,21 ] . ...
... 自石墨化碳质物质拉曼光谱温度计问世以来,诸多国内外学者从不同角度对该测温方法进行了详细的评述[9 ,25 ,26 ,35 ,36 ,37 ,38 ] .近年来的研究发现,石墨化碳质物质拉曼光谱信号还受到一些非温度因素的影响,这在前人综述中鲜有系统总结.因此,本文结合前人研究与作者的工作经历,试图系统地介绍该方法的原理、样品制备、测试流程、非温度影响因素、温度定量计算模型和相关地质应用. ...
... 拉曼散射与物质的成分和结构紧密相关[39 ,40 ,41 ,42 ,43 ] .对于碳质物质,其石墨化程度不同,拉曼光谱特征差异显著[39 ,44 ] :碳质石墨化较高时,碳原子层排列有序,层间间距较小,没有其他原子团,表现为显著的G峰(1 580 cm-1 ),其振动模式为E2g2 型[9 ,24 ,39 ] ;而在晶格结构有限的情况下,石墨碳层边界缺陷会导致形成D1缺陷峰(1 350 cm-1 ),振动模式为A1g 型[9 ,24 ,39 ] ;石墨化程度较低时,由于晶格缺陷较多,光谱会表现出较多的缺陷锋,如频移在1 620 cm-1 (D2)、1 510 cm-1 (D3)和1 245 cm-1 (D4)的谱峰[9 ,25 ,39 ,44 ,45 ,46 ,47 ] (图1 a). ...
... [9 ,24 ,39 ];石墨化程度较低时,由于晶格缺陷较多,光谱会表现出较多的缺陷锋,如频移在1 620 cm-1 (D2)、1 510 cm-1 (D3)和1 245 cm-1 (D4)的谱峰[9 ,25 ,39 ,44 ,45 ,46 ,47 ] (图1 a). ...
... [9 ,25 ,39 ,44 ,45 ,46 ,47 ](图1 a). ...
... 前人研究发现,使用不同波长的激光(光子能量不同),相同样品得到的光谱结果有显著差异,主要体现为光谱形态与谱峰位置[40 ,65 ,66 ] .如图7 所示,随着激光波长逐渐增大,缺陷峰(D1峰)信号增强,石墨峰(G峰)信号相对减弱[9 ,66 ] .与此同时,缺陷峰频移增大,而石墨峰频移基本不变[46 ] . ...
... 石墨化碳质物质硬度较低,在薄片制作时,抛光的过程可能会产生更多的损伤,而影响拉曼测试结果[9 ] .Pasteris[54 ] 指出抛光后样品D峰的信号有一定增强(图9 ).Beyssac等[58 ] 通过对比研究了被抛光的石墨与透明矿物下方未受抛光影响的石墨的拉曼光谱,发现前者出现显著的D峰,这会极大影响温度的计算.此外,Wang等[55 ] 和Mostefaoui等[72 ] 也就石墨抛光对拉曼测试结果的影响进行了一系列研究,确认了抛光造成的结构损伤对测试结果有影响. ...
... 抛光对拉曼测试结果的影响(据参考文献[
9 ,
72 ]修改)
(a)显微镜下石墨照片,部分石墨直被抛光暴露(黑色点标注的透射光下的不透明、反射光下灰白色强反射的区域),部分处于透明矿物之下(白点所标注的反射光下的较虚的灰白色区域);(b)抛光暴露的与透明矿物下的石墨拉曼光谱测试结果 ...
Graphitic carbon: A ubiquitous, diverse, and useful geomaterial
3
2014
... 自然界中的碳质物质广泛存在,有生物[1 ,2 ] 、热液[3 ,4 ,5 ] 、或地外等多种成因[6 ,7 ] .对于生物成因的碳质物质,在埋藏受热过程中,其成分和结构会发生两种连续的变化:碳化与石墨化[8 ,9 ,10 ,11 ,12 ,13 ] .在碳化阶段,非碳原子被逐渐排出体系,碳原子开始形成六边形的芳香环骨架,而在接下来的石墨化过程中这些芳香环骨架会发生聚合并在结构上重新排列,形成更加稳定的ABAB层状叠置的石墨结构[8 ,9 ,10 ,11 ,12 ,13 ] .大量学者通过X射线衍射(X-Ray Diffraction, XRD)、透射电子显微镜(Transmission Electron Microscope, TEM)和拉曼光谱(Raman Spectrum, RS)等方法,证实碳质物质石墨化的程度与母岩变质级别紧密相关[14 ,15 ,16 ,17 ,18 ] .基于这些认识,国内外诸多学者开发并应用了碳质拉曼光谱温度计[19 ,20 ,21 ] . ...
... ,10 ,11 ,12 ,13 ].大量学者通过X射线衍射(X-Ray Diffraction, XRD)、透射电子显微镜(Transmission Electron Microscope, TEM)和拉曼光谱(Raman Spectrum, RS)等方法,证实碳质物质石墨化的程度与母岩变质级别紧密相关[14 ,15 ,16 ,17 ,18 ] .基于这些认识,国内外诸多学者开发并应用了碳质拉曼光谱温度计[19 ,20 ,21 ] . ...
... 不稳定的碳质物质随埋藏与变质过程会逐渐转变为稳定的石墨[10 ] ,石墨化程度仅与岩石经历的峰期变质温度有关,并具有不可逆性[13 ] .因此,通过测定碳质物质的石墨化程度便可量化其经历的峰期变质温度. ...
The raman-derived carbonization continuum: A tool to select the best preserved molecular structures in Archean Kerogens
2
2016
... 自然界中的碳质物质广泛存在,有生物[1 ,2 ] 、热液[3 ,4 ,5 ] 、或地外等多种成因[6 ,7 ] .对于生物成因的碳质物质,在埋藏受热过程中,其成分和结构会发生两种连续的变化:碳化与石墨化[8 ,9 ,10 ,11 ,12 ,13 ] .在碳化阶段,非碳原子被逐渐排出体系,碳原子开始形成六边形的芳香环骨架,而在接下来的石墨化过程中这些芳香环骨架会发生聚合并在结构上重新排列,形成更加稳定的ABAB层状叠置的石墨结构[8 ,9 ,10 ,11 ,12 ,13 ] .大量学者通过X射线衍射(X-Ray Diffraction, XRD)、透射电子显微镜(Transmission Electron Microscope, TEM)和拉曼光谱(Raman Spectrum, RS)等方法,证实碳质物质石墨化的程度与母岩变质级别紧密相关[14 ,15 ,16 ,17 ,18 ] .基于这些认识,国内外诸多学者开发并应用了碳质拉曼光谱温度计[19 ,20 ,21 ] . ...
... ,11 ,12 ,13 ].大量学者通过X射线衍射(X-Ray Diffraction, XRD)、透射电子显微镜(Transmission Electron Microscope, TEM)和拉曼光谱(Raman Spectrum, RS)等方法,证实碳质物质石墨化的程度与母岩变质级别紧密相关[14 ,15 ,16 ,17 ,18 ] .基于这些认识,国内外诸多学者开发并应用了碳质拉曼光谱温度计[19 ,20 ,21 ] . ...
A Raman-HRTEM study of the carbonization of wood: A new raman-based paleothermometer dedicated to archaeometry
2
2016
... 自然界中的碳质物质广泛存在,有生物[1 ,2 ] 、热液[3 ,4 ,5 ] 、或地外等多种成因[6 ,7 ] .对于生物成因的碳质物质,在埋藏受热过程中,其成分和结构会发生两种连续的变化:碳化与石墨化[8 ,9 ,10 ,11 ,12 ,13 ] .在碳化阶段,非碳原子被逐渐排出体系,碳原子开始形成六边形的芳香环骨架,而在接下来的石墨化过程中这些芳香环骨架会发生聚合并在结构上重新排列,形成更加稳定的ABAB层状叠置的石墨结构[8 ,9 ,10 ,11 ,12 ,13 ] .大量学者通过X射线衍射(X-Ray Diffraction, XRD)、透射电子显微镜(Transmission Electron Microscope, TEM)和拉曼光谱(Raman Spectrum, RS)等方法,证实碳质物质石墨化的程度与母岩变质级别紧密相关[14 ,15 ,16 ,17 ,18 ] .基于这些认识,国内外诸多学者开发并应用了碳质拉曼光谱温度计[19 ,20 ,21 ] . ...
... ,12 ,13 ].大量学者通过X射线衍射(X-Ray Diffraction, XRD)、透射电子显微镜(Transmission Electron Microscope, TEM)和拉曼光谱(Raman Spectrum, RS)等方法,证实碳质物质石墨化的程度与母岩变质级别紧密相关[14 ,15 ,16 ,17 ,18 ] .基于这些认识,国内外诸多学者开发并应用了碳质拉曼光谱温度计[19 ,20 ,21 ] . ...
Experimental study of the microtextural and structural transformations of carbonaceous materials under pressure and temperature
3
2004
... 自然界中的碳质物质广泛存在,有生物[1 ,2 ] 、热液[3 ,4 ,5 ] 、或地外等多种成因[6 ,7 ] .对于生物成因的碳质物质,在埋藏受热过程中,其成分和结构会发生两种连续的变化:碳化与石墨化[8 ,9 ,10 ,11 ,12 ,13 ] .在碳化阶段,非碳原子被逐渐排出体系,碳原子开始形成六边形的芳香环骨架,而在接下来的石墨化过程中这些芳香环骨架会发生聚合并在结构上重新排列,形成更加稳定的ABAB层状叠置的石墨结构[8 ,9 ,10 ,11 ,12 ,13 ] .大量学者通过X射线衍射(X-Ray Diffraction, XRD)、透射电子显微镜(Transmission Electron Microscope, TEM)和拉曼光谱(Raman Spectrum, RS)等方法,证实碳质物质石墨化的程度与母岩变质级别紧密相关[14 ,15 ,16 ,17 ,18 ] .基于这些认识,国内外诸多学者开发并应用了碳质拉曼光谱温度计[19 ,20 ,21 ] . ...
... ,13 ].大量学者通过X射线衍射(X-Ray Diffraction, XRD)、透射电子显微镜(Transmission Electron Microscope, TEM)和拉曼光谱(Raman Spectrum, RS)等方法,证实碳质物质石墨化的程度与母岩变质级别紧密相关[14 ,15 ,16 ,17 ,18 ] .基于这些认识,国内外诸多学者开发并应用了碳质拉曼光谱温度计[19 ,20 ,21 ] . ...
... 不稳定的碳质物质随埋藏与变质过程会逐渐转变为稳定的石墨[10 ] ,石墨化程度仅与岩石经历的峰期变质温度有关,并具有不可逆性[13 ] .因此,通过测定碳质物质的石墨化程度便可量化其经历的峰期变质温度. ...
Carbonaceous material in some metamorphic rocks of New England and other areas
1
1974
... 自然界中的碳质物质广泛存在,有生物[1 ,2 ] 、热液[3 ,4 ,5 ] 、或地外等多种成因[6 ,7 ] .对于生物成因的碳质物质,在埋藏受热过程中,其成分和结构会发生两种连续的变化:碳化与石墨化[8 ,9 ,10 ,11 ,12 ,13 ] .在碳化阶段,非碳原子被逐渐排出体系,碳原子开始形成六边形的芳香环骨架,而在接下来的石墨化过程中这些芳香环骨架会发生聚合并在结构上重新排列,形成更加稳定的ABAB层状叠置的石墨结构[8 ,9 ,10 ,11 ,12 ,13 ] .大量学者通过X射线衍射(X-Ray Diffraction, XRD)、透射电子显微镜(Transmission Electron Microscope, TEM)和拉曼光谱(Raman Spectrum, RS)等方法,证实碳质物质石墨化的程度与母岩变质级别紧密相关[14 ,15 ,16 ,17 ,18 ] .基于这些认识,国内外诸多学者开发并应用了碳质拉曼光谱温度计[19 ,20 ,21 ] . ...
Petrology: Coalification and graphitization in high-pressure schists in New Caledonia
1
1978
... 自然界中的碳质物质广泛存在,有生物[1 ,2 ] 、热液[3 ,4 ,5 ] 、或地外等多种成因[6 ,7 ] .对于生物成因的碳质物质,在埋藏受热过程中,其成分和结构会发生两种连续的变化:碳化与石墨化[8 ,9 ,10 ,11 ,12 ,13 ] .在碳化阶段,非碳原子被逐渐排出体系,碳原子开始形成六边形的芳香环骨架,而在接下来的石墨化过程中这些芳香环骨架会发生聚合并在结构上重新排列,形成更加稳定的ABAB层状叠置的石墨结构[8 ,9 ,10 ,11 ,12 ,13 ] .大量学者通过X射线衍射(X-Ray Diffraction, XRD)、透射电子显微镜(Transmission Electron Microscope, TEM)和拉曼光谱(Raman Spectrum, RS)等方法,证实碳质物质石墨化的程度与母岩变质级别紧密相关[14 ,15 ,16 ,17 ,18 ] .基于这些认识,国内外诸多学者开发并应用了碳质拉曼光谱温度计[19 ,20 ,21 ] . ...
Carbonaceousmaterialin pelitic schists of the: Sanbagawametamorphicbelt in central Shikoku,Japan
1
1981
... 自然界中的碳质物质广泛存在,有生物[1 ,2 ] 、热液[3 ,4 ,5 ] 、或地外等多种成因[6 ,7 ] .对于生物成因的碳质物质,在埋藏受热过程中,其成分和结构会发生两种连续的变化:碳化与石墨化[8 ,9 ,10 ,11 ,12 ,13 ] .在碳化阶段,非碳原子被逐渐排出体系,碳原子开始形成六边形的芳香环骨架,而在接下来的石墨化过程中这些芳香环骨架会发生聚合并在结构上重新排列,形成更加稳定的ABAB层状叠置的石墨结构[8 ,9 ,10 ,11 ,12 ,13 ] .大量学者通过X射线衍射(X-Ray Diffraction, XRD)、透射电子显微镜(Transmission Electron Microscope, TEM)和拉曼光谱(Raman Spectrum, RS)等方法,证实碳质物质石墨化的程度与母岩变质级别紧密相关[14 ,15 ,16 ,17 ,18 ] .基于这些认识,国内外诸多学者开发并应用了碳质拉曼光谱温度计[19 ,20 ,21 ] . ...
A possible mechainsm for natural graphite formation
1
1982
... 自然界中的碳质物质广泛存在,有生物[1 ,2 ] 、热液[3 ,4 ,5 ] 、或地外等多种成因[6 ,7 ] .对于生物成因的碳质物质,在埋藏受热过程中,其成分和结构会发生两种连续的变化:碳化与石墨化[8 ,9 ,10 ,11 ,12 ,13 ] .在碳化阶段,非碳原子被逐渐排出体系,碳原子开始形成六边形的芳香环骨架,而在接下来的石墨化过程中这些芳香环骨架会发生聚合并在结构上重新排列,形成更加稳定的ABAB层状叠置的石墨结构[8 ,9 ,10 ,11 ,12 ,13 ] .大量学者通过X射线衍射(X-Ray Diffraction, XRD)、透射电子显微镜(Transmission Electron Microscope, TEM)和拉曼光谱(Raman Spectrum, RS)等方法,证实碳质物质石墨化的程度与母岩变质级别紧密相关[14 ,15 ,16 ,17 ,18 ] .基于这些认识,国内外诸多学者开发并应用了碳质拉曼光谱温度计[19 ,20 ,21 ] . ...
Conversion of carbonaceous material to graphite during metamorphism
1
1985
... 自然界中的碳质物质广泛存在,有生物[1 ,2 ] 、热液[3 ,4 ,5 ] 、或地外等多种成因[6 ,7 ] .对于生物成因的碳质物质,在埋藏受热过程中,其成分和结构会发生两种连续的变化:碳化与石墨化[8 ,9 ,10 ,11 ,12 ,13 ] .在碳化阶段,非碳原子被逐渐排出体系,碳原子开始形成六边形的芳香环骨架,而在接下来的石墨化过程中这些芳香环骨架会发生聚合并在结构上重新排列,形成更加稳定的ABAB层状叠置的石墨结构[8 ,9 ,10 ,11 ,12 ,13 ] .大量学者通过X射线衍射(X-Ray Diffraction, XRD)、透射电子显微镜(Transmission Electron Microscope, TEM)和拉曼光谱(Raman Spectrum, RS)等方法,证实碳质物质石墨化的程度与母岩变质级别紧密相关[14 ,15 ,16 ,17 ,18 ] .基于这些认识,国内外诸多学者开发并应用了碳质拉曼光谱温度计[19 ,20 ,21 ] . ...
Extending the applicability of the Raman carbonaceous-material geothermometer using data from contact metamorphic rocks
11
2010
... 自然界中的碳质物质广泛存在,有生物[1 ,2 ] 、热液[3 ,4 ,5 ] 、或地外等多种成因[6 ,7 ] .对于生物成因的碳质物质,在埋藏受热过程中,其成分和结构会发生两种连续的变化:碳化与石墨化[8 ,9 ,10 ,11 ,12 ,13 ] .在碳化阶段,非碳原子被逐渐排出体系,碳原子开始形成六边形的芳香环骨架,而在接下来的石墨化过程中这些芳香环骨架会发生聚合并在结构上重新排列,形成更加稳定的ABAB层状叠置的石墨结构[8 ,9 ,10 ,11 ,12 ,13 ] .大量学者通过X射线衍射(X-Ray Diffraction, XRD)、透射电子显微镜(Transmission Electron Microscope, TEM)和拉曼光谱(Raman Spectrum, RS)等方法,证实碳质物质石墨化的程度与母岩变质级别紧密相关[14 ,15 ,16 ,17 ,18 ] .基于这些认识,国内外诸多学者开发并应用了碳质拉曼光谱温度计[19 ,20 ,21 ] . ...
... 国内外关于石墨化碳质物质温度计的研究由来已久,Rietmeijer等[22 ] 发现变质温度在400 ℃以下时,石墨d002 晶格面间隔与其峰期变质温度有一定的相关性;Wada等[23 ] 应用X射线衍射分析发现碳质物质石墨化程度与岩石变质温度在300~600 ℃范围内线性相关;Beyssac等[24 ] 结合矿物变质温度计、镜质体反射率(R O )等方法,建立了石墨化碳质物质拉曼温度计模型,并用于定量研究变质岩的峰期变质温度;此后的研究结合低温热年代学等方法,将该温度计拓展到更低温的范围[21 ] ,并应用于研究相关的变质、变形[19 ,25 ] .国内也开展了许多相关研究[26 ,27 ,28 ,29 ,30 ,31 ,32 ,33 ] ,胡凯等[26 ] 结合镜质体反射率和氧同位素古温度计等测温方法,对碳质拉曼光谱各谱峰数据进行多元回归分析,给出了中低级变质样品(200~500 ℃)变质温度估算方法.后续有学者使用碳质拉曼光谱分析开展了岩石变质级别划分、有机物成熟度测定与油气演化等研究[27 ,28 ,29 ,30 ,31 ,34 ] . ...
... (a)光谱拟合示意图(据参考文献[19 ]修改),其中实线为原始光谱图像,虚线为分峰拟合结果:G(graphite)峰表示石墨峰,D(defect)峰表示缺陷峰;(b)不同峰期变质温度样品的拉曼光谱图像与对应温度计算结果;用于分析的石墨化碳质物质分别来自龙门山映秀断裂断层泥、松潘—甘孜地体东部的复理石、龙门山腹地志留纪云母片岩和胶北矽线石榴片麻岩样品;随着样品峰期变质温度增高,G峰信号增强、D峰信号减弱 ...
... (a) Images of typical raman spectra and spectral fitting results (modified after reference [19 ]), where the solid line is the original spectral signal, and the dash lines are the peak fitting results: The G-band represents the graphite peak and the D-bands represent defect peaks; (b) Raman spectra of samples with different peak metamorphic temperatures and corresponding temperature calculation results; The samples are fault gouge of the Yingxiu fault in the Longmenshan, Triassic flysch in the eastern Songpan-Ganzi terrane, Silurian mica schist in the hinterland of the Longmenshan, and metamorphic rocks in the Khondalite belt of North China; As shown, the G-band signal increases and the D-band signal decreases with the increase of sample peak temperatures ...
... (2)分峰拟合.由于石墨峰(G峰)与缺陷峰(D峰)都具有一定的分布范围,当信号重叠时很难直接获得单个谱峰的信号强度与分布面积,因此需对光谱进行分峰拟合.使用不同的拟合函数会在一定程度上影响谱峰拟合的强度与面积,并最终影响温度计算结果,因此需选用合适的光谱拟合函数.光谱拟合函数种类多样,如线性函数(Linear)、多项式函数(Polyomial)、高斯函数(Gauss)、福格特函数(Voigt)和洛伦兹函数(Lorentzian)等.对于石墨拉曼光谱,常用的拟合函数为福格特函数和洛伦兹函数[8 ,19 ,24 ,35 ] .Lahfid等[8 ] 认为在变质温度较低时应使用洛伦兹函数对光谱进行分析,而Beyssca等[24 ] 的研究主要使用福格特函数.为了对比拟合函数不同对结果的影响,Lünsdorf等[35 ] 分别使用洛伦兹和福格特函数对19个不同变质温度的样品进行了光谱拟合,结果显示仅在低温(约小于350 ℃)变质样品的光谱拟合结果上产生较大差别,中高温变质样品未见明显区别.通过温度计算结果与其他温度计测温结果对比显示,在低温变质区间,洛伦兹函数的光谱拟合结果明显比福格特函数更加准确[35 ] .因此不论在何种温度区间,均可使用洛伦兹函数对光谱进行拟合分析.另外根据作者对龙门山云母片岩、胶北矽线石榴片麻岩的测试结果,在中高温变质区间,使用两种光谱拟合函数最终获得的变质温度差别小于10 ℃,因此统一使用洛伦兹函数进行光谱分析较为合理(图1 a). ...
... 为将此温度计方法推广至接触变质温度研究领域并提高结果计算精度,Aoya等[19 ] 使用Thermo Nicolet™拉曼光谱仪(激光参数为:波长532 nm、功率3 mW、光斑直径约1 µm),对日本两处经过热模拟和变质矿物对共同限定变质温度的接触变质岩样品进行了拉曼光谱分析,拟合得出了可用于接触变质的温度计算公式(3),温度计算误差为±15 ℃;另外,结合Beyssac等[24 ] 的数据,使用二次函数拟合得出了精度更高温度计算公式(4),温度计算误差为±30 ℃. ...
... 石墨为六方晶系片状矿物,具有显著的各向异性,与激光偏振一同造成了在不同晶轴方向上石墨拉曼光谱特征的细微差异,这一直是该温度计研究的难点[19 ,54 ,55 ,56 ] .Tan等[57 ] 曾用结晶完整的石墨对此问题进行了深入研究,并结合不同波长的激光进行对比(图5 ),结果显示:波长为514.5 nm的激光在照射石墨晶体平面时未出现明显的缺陷峰(D1峰与D2峰),而当激光偏振方向平行于石墨层时,出现缺陷峰.与此同时,随激光波长加大,缺陷峰强度增加. ...
... 由于石墨一般平行面理生长,为减弱石墨各向异性的影响,应选择垂直于岩石面理,平行线理的方向制作薄片[24 ] .同时,Aoya等[19 ] 研究发现,当测点大于25个时,测试结果的平均值趋于稳定.因此,多点测试(大于25个)也是解决石墨各向异性影响的有效途径. ...
... 透射电镜分析显示碳质物质的非均质性普遍存在[58 ,59 ,60 ,61 ] .如图6 所示为非均质碳质物质在透射电镜下呈现不同有序度的洋葱状结构和显微气孔结构[59 ] .此外,也有学者使用扫描透视X射线显微镜(Scanning Transmission X-ray Microscopy, STXM)对碳质物质的结构进行分析,得到了类似结果[62 ,63 ] .引起石墨非均质性的原因可能是局部化学成分的不均一或碳原子在不同晶轴方向上的杂乱排列,即结晶程度较低[64 ] .碳质物质的非均质性是影响温度计算结果的重要因素之一,多点测试(大于25个)是减小该影响的有效途径[19 ] . ...
... 除了上述地区的研究外,碳质物质拉曼温度计还被广泛应用于其他造山带的研究:如阿尔卑斯(Alps)造山带的变质温度、断层位置、俯冲过程中碳循环、地壳缩短模式[8 ,75 ,77 ,80 ,81 ] ;希腊克里特(Crete)地区拆离断层所引起变质温度突变[21 ] ;爱琴海两侧亚伯兰穹隆构造(Alboran Domain)[82 ] ;意大利阿普亚内山(Alpi Apuane)[83 ] 、中国台湾和日本[19 ,20 ,84 ,85 ] 的构造变形与变质作用. ...
... 在油气地质学领域,镜质体反射率是反映有机质热演化成熟度比较通用的指标,是进行有机质生油阶段(温度小于约250 ℃)划分的标尺[91 ,92 ] .而在更高的有机质成熟阶段,镜质体反射率指标敏感度降低[92 ,93 ] ,同时有些样品可能不含镜质体[28 ] ,为了完善有机质成熟度的判断方法,诸多学者尝试利用有机质拉曼光谱分析进行成熟度评价:Kelemen等[93 ] 发现随成熟度增加,拉曼谱峰中D峰与G峰面积比值减小;刘德汉等[94 ] 利用不同热演化程度的样品,得出适用于高成熟度样品的成熟度计算经验公式;Wilkins等[95 ,96 ] 也根据不同热演化程度煤的拉曼光谱特征建立了有机质成熟度的计算方法;王民等[97 ] 在Wilkins等[95 ,96 ] 的工作基础上建立了一种镜质组随机反射率(Rr )在0.4%~2.5%范围内的有机质热成熟度评价的拉曼模型;张聪等[98 ] 结合样品扫描电镜分析结果,验证了拉曼光谱技术是测定高成熟度有机质的一种行之有效的手段.这些研究表明了有机质激光拉曼再判断有机质成熟度方面的潜力,尤其是镜质体缺失或镜质体反射率受到抑制或识别困难的沉积岩中具有广阔的应用前景[97 ] .在其他地球科学领域,也有石墨化碳质物质拉曼光谱温度计的应用方向:如探究岩浆侵入所伴随的热效应[19 ,49 ] ,球粒陨石的热演化[7 ] ,示踪沉积物源区与碳质物质经历的沉积循环[99 ,100 ,101 ,102 ] ,有机质矿化过程中的变质温度[2 ] ,造山带剥蚀过程[84 ,85 ] 等. ...
Raman spectrum of carbonaceous material: A possible metamorphic grade indicator for low-grade metamorphic rocks
2
1996
... 自然界中的碳质物质广泛存在,有生物[1 ,2 ] 、热液[3 ,4 ,5 ] 、或地外等多种成因[6 ,7 ] .对于生物成因的碳质物质,在埋藏受热过程中,其成分和结构会发生两种连续的变化:碳化与石墨化[8 ,9 ,10 ,11 ,12 ,13 ] .在碳化阶段,非碳原子被逐渐排出体系,碳原子开始形成六边形的芳香环骨架,而在接下来的石墨化过程中这些芳香环骨架会发生聚合并在结构上重新排列,形成更加稳定的ABAB层状叠置的石墨结构[8 ,9 ,10 ,11 ,12 ,13 ] .大量学者通过X射线衍射(X-Ray Diffraction, XRD)、透射电子显微镜(Transmission Electron Microscope, TEM)和拉曼光谱(Raman Spectrum, RS)等方法,证实碳质物质石墨化的程度与母岩变质级别紧密相关[14 ,15 ,16 ,17 ,18 ] .基于这些认识,国内外诸多学者开发并应用了碳质拉曼光谱温度计[19 ,20 ,21 ] . ...
... 除了上述地区的研究外,碳质物质拉曼温度计还被广泛应用于其他造山带的研究:如阿尔卑斯(Alps)造山带的变质温度、断层位置、俯冲过程中碳循环、地壳缩短模式[8 ,75 ,77 ,80 ,81 ] ;希腊克里特(Crete)地区拆离断层所引起变质温度突变[21 ] ;爱琴海两侧亚伯兰穹隆构造(Alboran Domain)[82 ] ;意大利阿普亚内山(Alpi Apuane)[83 ] 、中国台湾和日本[19 ,20 ,84 ,85 ] 的构造变形与变质作用. ...
Raman spectroscopic carbonaceous material thermometry of low-grade metamorphic rocks: Calibration and application to tectonic exhumation in Crete, Greece
8
2005
... 自然界中的碳质物质广泛存在,有生物[1 ,2 ] 、热液[3 ,4 ,5 ] 、或地外等多种成因[6 ,7 ] .对于生物成因的碳质物质,在埋藏受热过程中,其成分和结构会发生两种连续的变化:碳化与石墨化[8 ,9 ,10 ,11 ,12 ,13 ] .在碳化阶段,非碳原子被逐渐排出体系,碳原子开始形成六边形的芳香环骨架,而在接下来的石墨化过程中这些芳香环骨架会发生聚合并在结构上重新排列,形成更加稳定的ABAB层状叠置的石墨结构[8 ,9 ,10 ,11 ,12 ,13 ] .大量学者通过X射线衍射(X-Ray Diffraction, XRD)、透射电子显微镜(Transmission Electron Microscope, TEM)和拉曼光谱(Raman Spectrum, RS)等方法,证实碳质物质石墨化的程度与母岩变质级别紧密相关[14 ,15 ,16 ,17 ,18 ] .基于这些认识,国内外诸多学者开发并应用了碳质拉曼光谱温度计[19 ,20 ,21 ] . ...
... 国内外关于石墨化碳质物质温度计的研究由来已久,Rietmeijer等[22 ] 发现变质温度在400 ℃以下时,石墨d002 晶格面间隔与其峰期变质温度有一定的相关性;Wada等[23 ] 应用X射线衍射分析发现碳质物质石墨化程度与岩石变质温度在300~600 ℃范围内线性相关;Beyssac等[24 ] 结合矿物变质温度计、镜质体反射率(R O )等方法,建立了石墨化碳质物质拉曼温度计模型,并用于定量研究变质岩的峰期变质温度;此后的研究结合低温热年代学等方法,将该温度计拓展到更低温的范围[21 ] ,并应用于研究相关的变质、变形[19 ,25 ] .国内也开展了许多相关研究[26 ,27 ,28 ,29 ,30 ,31 ,32 ,33 ] ,胡凯等[26 ] 结合镜质体反射率和氧同位素古温度计等测温方法,对碳质拉曼光谱各谱峰数据进行多元回归分析,给出了中低级变质样品(200~500 ℃)变质温度估算方法.后续有学者使用碳质拉曼光谱分析开展了岩石变质级别划分、有机物成熟度测定与油气演化等研究[27 ,28 ,29 ,30 ,31 ,34 ] . ...
... 随着温度计研究的不断深入,温度计算范围也得到了扩展.Rahl等[21 ] 使用HORIBA-JY LabRAM拉曼光谱仪(激光参数为:波长532 nm、功率1 mW、光斑直径约1.5 µm),发现参数R 1[公式(5)]与岩石峰期变质温度也有一定相关性,便结合大量裂变径迹与(U-Th)/He限定的温度历史,通过R 1与R 2双变量的多项式拟合,得出了温度计算公式(6),将之前330~650 ℃的温度计算范围拓宽至100~700 ℃,温度计算误差为±40 ℃. ...
... 图4 使用Rahl等[21 ] 报道的数据和作者的数据对公式(2)、(4)、(6)和(7)的温度计算结果进行了对比,以进一步说明各种温度计算模型适用的温度范围,以及R 1、R 2和D1半高宽(FWHM.D1)等参数对变质温度的敏感性(图4 ).结果显示,公式(4)的计算结果普遍高于公式(2),但整体差距较小;除个别数据点外,公式(6)的计算结果也普遍高于公式(2) (图4 a).使用R 1和D1半高宽的公式(6)与公式(7)可以计算低温样品的变质温度,对比发现在数据来源测试条件下公式(7)拟合温度普遍低于公式(6)(图4 b). ...
... (a)高温样品的经验公式计算结果对比图,结果显示,除个别异常点,公式(4)与(6)的计算温度明显高于公式(2);(b)适用于相对低温样品的经验公式(6)(横坐标)与公式(7)(纵坐标)低温(<400 ℃)计算结果对比,二者计算相对误差均较大,整体上公式(7)计算结果小于公式(6);拉曼数据源自参考文献[21 ]和图1b中的样品 ...
... (a) Comparison of the temperatures calculated by equations (2) (x-axis) and (4), (6) (y-axis) that are suitable for a relatively higher temperature range; The calculation results show that except for several outliners, the calculated temperatures by formula (4) and (6) are higher than that by formula (2); (b) Comparison of equation 6 (x-axis) and 7 (y-axis) at low temperature (<400 ℃). Both errors are large, and the calculated results of equation 7 are relatively smaller than those of equation 6. Raman data are derived from reference[21 ] and Fig.1b ...
... 除了上述地区的研究外,碳质物质拉曼温度计还被广泛应用于其他造山带的研究:如阿尔卑斯(Alps)造山带的变质温度、断层位置、俯冲过程中碳循环、地壳缩短模式[8 ,75 ,77 ,80 ,81 ] ;希腊克里特(Crete)地区拆离断层所引起变质温度突变[21 ] ;爱琴海两侧亚伯兰穹隆构造(Alboran Domain)[82 ] ;意大利阿普亚内山(Alpi Apuane)[83 ] 、中国台湾和日本[19 ,20 ,84 ,85 ] 的构造变形与变质作用. ...
... 作为一种定量测试中低级变质岩峰期变质温度的方法,石墨化碳质物质拉曼光谱温度计具有样品制备简单、测试方便快捷、测试周期短等优点,相关实验与应用需要注意样品制备、碳质物质的非均质性与各向异性、样品风化程度等非温度因素的影响.抛砖引玉,作者认为该温度计方法理论与应用的进一步发展,需要在如下方面做更多工作:如前文所述,不同经验模型在中高温范围内的计算结果比较一致,然而在低温范围内,计算结果差异很大[38 ] ,因此探究低温编制样品碳质物质拉曼光谱信号的主控因素、开发针对低级变质样品的温度计算经验公式是有必要的.其次,如Lünsdorf等[25 ] 所指出的,现有的测试条件以及数据分析过程会因实验室和操作人员的不同有较大差别,这使得温度计算结果在一定程度上没有可比性,因此,此温度计未来发展中需要建立一个标准的样品制备和测试方法,以建立更加标准对比体系.最后,在应用方面,此温度计仍有较大空间值得开发,如可与热年代学方法结合,用于限定岩石的温度历史[21 ] ;与构造地质观测与矿物压力计等结合,限定岩石的变形与变质历史等[103 ] . ...
Poorly graphitized carbon as a new cosmothermometer for primitive extraterrestrial materials
1
1985
... 国内外关于石墨化碳质物质温度计的研究由来已久,Rietmeijer等[22 ] 发现变质温度在400 ℃以下时,石墨d002 晶格面间隔与其峰期变质温度有一定的相关性;Wada等[23 ] 应用X射线衍射分析发现碳质物质石墨化程度与岩石变质温度在300~600 ℃范围内线性相关;Beyssac等[24 ] 结合矿物变质温度计、镜质体反射率(R O )等方法,建立了石墨化碳质物质拉曼温度计模型,并用于定量研究变质岩的峰期变质温度;此后的研究结合低温热年代学等方法,将该温度计拓展到更低温的范围[21 ] ,并应用于研究相关的变质、变形[19 ,25 ] .国内也开展了许多相关研究[26 ,27 ,28 ,29 ,30 ,31 ,32 ,33 ] ,胡凯等[26 ] 结合镜质体反射率和氧同位素古温度计等测温方法,对碳质拉曼光谱各谱峰数据进行多元回归分析,给出了中低级变质样品(200~500 ℃)变质温度估算方法.后续有学者使用碳质拉曼光谱分析开展了岩石变质级别划分、有机物成熟度测定与油气演化等研究[27 ,28 ,29 ,30 ,31 ,34 ] . ...
Graphitization of carbonaceous matter during metamorphism with references to carbonate and pelitic rocks of contact and regional metamorphisms, Japan
1
1994
... 国内外关于石墨化碳质物质温度计的研究由来已久,Rietmeijer等[22 ] 发现变质温度在400 ℃以下时,石墨d002 晶格面间隔与其峰期变质温度有一定的相关性;Wada等[23 ] 应用X射线衍射分析发现碳质物质石墨化程度与岩石变质温度在300~600 ℃范围内线性相关;Beyssac等[24 ] 结合矿物变质温度计、镜质体反射率(R O )等方法,建立了石墨化碳质物质拉曼温度计模型,并用于定量研究变质岩的峰期变质温度;此后的研究结合低温热年代学等方法,将该温度计拓展到更低温的范围[21 ] ,并应用于研究相关的变质、变形[19 ,25 ] .国内也开展了许多相关研究[26 ,27 ,28 ,29 ,30 ,31 ,32 ,33 ] ,胡凯等[26 ] 结合镜质体反射率和氧同位素古温度计等测温方法,对碳质拉曼光谱各谱峰数据进行多元回归分析,给出了中低级变质样品(200~500 ℃)变质温度估算方法.后续有学者使用碳质拉曼光谱分析开展了岩石变质级别划分、有机物成熟度测定与油气演化等研究[27 ,28 ,29 ,30 ,31 ,34 ] . ...
Raman spectra of carbonaceous material in metasediments: A new geothermometer
9
2002
... 国内外关于石墨化碳质物质温度计的研究由来已久,Rietmeijer等[22 ] 发现变质温度在400 ℃以下时,石墨d002 晶格面间隔与其峰期变质温度有一定的相关性;Wada等[23 ] 应用X射线衍射分析发现碳质物质石墨化程度与岩石变质温度在300~600 ℃范围内线性相关;Beyssac等[24 ] 结合矿物变质温度计、镜质体反射率(R O )等方法,建立了石墨化碳质物质拉曼温度计模型,并用于定量研究变质岩的峰期变质温度;此后的研究结合低温热年代学等方法,将该温度计拓展到更低温的范围[21 ] ,并应用于研究相关的变质、变形[19 ,25 ] .国内也开展了许多相关研究[26 ,27 ,28 ,29 ,30 ,31 ,32 ,33 ] ,胡凯等[26 ] 结合镜质体反射率和氧同位素古温度计等测温方法,对碳质拉曼光谱各谱峰数据进行多元回归分析,给出了中低级变质样品(200~500 ℃)变质温度估算方法.后续有学者使用碳质拉曼光谱分析开展了岩石变质级别划分、有机物成熟度测定与油气演化等研究[27 ,28 ,29 ,30 ,31 ,34 ] . ...
... 拉曼散射与物质的成分和结构紧密相关[39 ,40 ,41 ,42 ,43 ] .对于碳质物质,其石墨化程度不同,拉曼光谱特征差异显著[39 ,44 ] :碳质石墨化较高时,碳原子层排列有序,层间间距较小,没有其他原子团,表现为显著的G峰(1 580 cm-1 ),其振动模式为E2g2 型[9 ,24 ,39 ] ;而在晶格结构有限的情况下,石墨碳层边界缺陷会导致形成D1缺陷峰(1 350 cm-1 ),振动模式为A1g 型[9 ,24 ,39 ] ;石墨化程度较低时,由于晶格缺陷较多,光谱会表现出较多的缺陷锋,如频移在1 620 cm-1 (D2)、1 510 cm-1 (D3)和1 245 cm-1 (D4)的谱峰[9 ,25 ,39 ,44 ,45 ,46 ,47 ] (图1 a). ...
... ,24 ,39 ];石墨化程度较低时,由于晶格缺陷较多,光谱会表现出较多的缺陷锋,如频移在1 620 cm-1 (D2)、1 510 cm-1 (D3)和1 245 cm-1 (D4)的谱峰[9 ,25 ,39 ,44 ,45 ,46 ,47 ] (图1 a). ...
... 常用的拉曼光谱测试设备主要是HORIBA-JY LabRAM、Renishaw inViaTM 和Thermo Scientific™ DXR™2xi显微拉曼成像光谱仪,诸多研究使用的激光波长为514.5 nm.测试中可通过如下两种方式提高信噪比:采用长曝光时间(20~300 s[24 ,30 ,31 ] ),或信号多次叠加.本文展示的数据采集自Thermo Scientific™ DXR™2xi显微拉曼成像光谱仪,测试所用激光波长为514.5 nm,光斑直径约为1 μm,功率为1 mW,照射频率为10 Hz,时间为20 s,光谱接收范围为1 000~1 800 cm-1 . ...
... (2)分峰拟合.由于石墨峰(G峰)与缺陷峰(D峰)都具有一定的分布范围,当信号重叠时很难直接获得单个谱峰的信号强度与分布面积,因此需对光谱进行分峰拟合.使用不同的拟合函数会在一定程度上影响谱峰拟合的强度与面积,并最终影响温度计算结果,因此需选用合适的光谱拟合函数.光谱拟合函数种类多样,如线性函数(Linear)、多项式函数(Polyomial)、高斯函数(Gauss)、福格特函数(Voigt)和洛伦兹函数(Lorentzian)等.对于石墨拉曼光谱,常用的拟合函数为福格特函数和洛伦兹函数[8 ,19 ,24 ,35 ] .Lahfid等[8 ] 认为在变质温度较低时应使用洛伦兹函数对光谱进行分析,而Beyssca等[24 ] 的研究主要使用福格特函数.为了对比拟合函数不同对结果的影响,Lünsdorf等[35 ] 分别使用洛伦兹和福格特函数对19个不同变质温度的样品进行了光谱拟合,结果显示仅在低温(约小于350 ℃)变质样品的光谱拟合结果上产生较大差别,中高温变质样品未见明显区别.通过温度计算结果与其他温度计测温结果对比显示,在低温变质区间,洛伦兹函数的光谱拟合结果明显比福格特函数更加准确[35 ] .因此不论在何种温度区间,均可使用洛伦兹函数对光谱进行拟合分析.另外根据作者对龙门山云母片岩、胶北矽线石榴片麻岩的测试结果,在中高温变质区间,使用两种光谱拟合函数最终获得的变质温度差别小于10 ℃,因此统一使用洛伦兹函数进行光谱分析较为合理(图1 a). ...
... [24 ]的研究主要使用福格特函数.为了对比拟合函数不同对结果的影响,Lünsdorf等[35 ] 分别使用洛伦兹和福格特函数对19个不同变质温度的样品进行了光谱拟合,结果显示仅在低温(约小于350 ℃)变质样品的光谱拟合结果上产生较大差别,中高温变质样品未见明显区别.通过温度计算结果与其他温度计测温结果对比显示,在低温变质区间,洛伦兹函数的光谱拟合结果明显比福格特函数更加准确[35 ] .因此不论在何种温度区间,均可使用洛伦兹函数对光谱进行拟合分析.另外根据作者对龙门山云母片岩、胶北矽线石榴片麻岩的测试结果,在中高温变质区间,使用两种光谱拟合函数最终获得的变质温度差别小于10 ℃,因此统一使用洛伦兹函数进行光谱分析较为合理(图1 a). ...
... 石墨化碳质物质拉曼温度计模型主要有以下几种.胡凯等[37 ] 使用Dilor-28型拉曼光谱显微探针,采用1 mW、488 nm的激光对样品进行分析.根据已通过氧同位素、变质矿物组合和镜质体反射率共同限定变质温度的岩石样品,使用多元回归分析方法,拟合了变质温度与碳质拉曼光谱参数,得到了在200~500 ℃范围内的温度计算公式[37 ] .Beyssac等[24 ] 使用DILOR XY拉曼光谱仪(激光参数为:波长514.5 nm、功率1~5 mW、光斑直径约2 µm),对岩石峰期变质温度与石墨化碳质物质拉曼光谱特征进行了更加系统地分析,从阿尔卑斯、日本、希腊等地选取了不同变质级别的岩石样品,根据变质矿物对独立限定样品的温压条件,通过拟合光谱测试的R 2参数[公式(1),其中D1、D2和G为石墨对应的拉曼谱峰]与变质温压的对应关系,发现R 2与岩石变质压力无关,与温度(T )有良好的线性关系[公式(2)],并确定该方法的适用温度区间为330~650 ℃,计算误差为±50 ℃. ...
... 为将此温度计方法推广至接触变质温度研究领域并提高结果计算精度,Aoya等[19 ] 使用Thermo Nicolet™拉曼光谱仪(激光参数为:波长532 nm、功率3 mW、光斑直径约1 µm),对日本两处经过热模拟和变质矿物对共同限定变质温度的接触变质岩样品进行了拉曼光谱分析,拟合得出了可用于接触变质的温度计算公式(3),温度计算误差为±15 ℃;另外,结合Beyssac等[24 ] 的数据,使用二次函数拟合得出了精度更高温度计算公式(4),温度计算误差为±30 ℃. ...
... 由于石墨一般平行面理生长,为减弱石墨各向异性的影响,应选择垂直于岩石面理,平行线理的方向制作薄片[24 ] .同时,Aoya等[19 ] 研究发现,当测点大于25个时,测试结果的平均值趋于稳定.因此,多点测试(大于25个)也是解决石墨各向异性影响的有效途径. ...
Towards a higher comparability of geothermometric data obtained by raman spectroscopy of carbonaceous material. Part 2: A revised geothermometer
4
2017
... 国内外关于石墨化碳质物质温度计的研究由来已久,Rietmeijer等[22 ] 发现变质温度在400 ℃以下时,石墨d002 晶格面间隔与其峰期变质温度有一定的相关性;Wada等[23 ] 应用X射线衍射分析发现碳质物质石墨化程度与岩石变质温度在300~600 ℃范围内线性相关;Beyssac等[24 ] 结合矿物变质温度计、镜质体反射率(R O )等方法,建立了石墨化碳质物质拉曼温度计模型,并用于定量研究变质岩的峰期变质温度;此后的研究结合低温热年代学等方法,将该温度计拓展到更低温的范围[21 ] ,并应用于研究相关的变质、变形[19 ,25 ] .国内也开展了许多相关研究[26 ,27 ,28 ,29 ,30 ,31 ,32 ,33 ] ,胡凯等[26 ] 结合镜质体反射率和氧同位素古温度计等测温方法,对碳质拉曼光谱各谱峰数据进行多元回归分析,给出了中低级变质样品(200~500 ℃)变质温度估算方法.后续有学者使用碳质拉曼光谱分析开展了岩石变质级别划分、有机物成熟度测定与油气演化等研究[27 ,28 ,29 ,30 ,31 ,34 ] . ...
... 自石墨化碳质物质拉曼光谱温度计问世以来,诸多国内外学者从不同角度对该测温方法进行了详细的评述[9 ,25 ,26 ,35 ,36 ,37 ,38 ] .近年来的研究发现,石墨化碳质物质拉曼光谱信号还受到一些非温度因素的影响,这在前人综述中鲜有系统总结.因此,本文结合前人研究与作者的工作经历,试图系统地介绍该方法的原理、样品制备、测试流程、非温度影响因素、温度定量计算模型和相关地质应用. ...
... 拉曼散射与物质的成分和结构紧密相关[39 ,40 ,41 ,42 ,43 ] .对于碳质物质,其石墨化程度不同,拉曼光谱特征差异显著[39 ,44 ] :碳质石墨化较高时,碳原子层排列有序,层间间距较小,没有其他原子团,表现为显著的G峰(1 580 cm-1 ),其振动模式为E2g2 型[9 ,24 ,39 ] ;而在晶格结构有限的情况下,石墨碳层边界缺陷会导致形成D1缺陷峰(1 350 cm-1 ),振动模式为A1g 型[9 ,24 ,39 ] ;石墨化程度较低时,由于晶格缺陷较多,光谱会表现出较多的缺陷锋,如频移在1 620 cm-1 (D2)、1 510 cm-1 (D3)和1 245 cm-1 (D4)的谱峰[9 ,25 ,39 ,44 ,45 ,46 ,47 ] (图1 a). ...
... 作为一种定量测试中低级变质岩峰期变质温度的方法,石墨化碳质物质拉曼光谱温度计具有样品制备简单、测试方便快捷、测试周期短等优点,相关实验与应用需要注意样品制备、碳质物质的非均质性与各向异性、样品风化程度等非温度因素的影响.抛砖引玉,作者认为该温度计方法理论与应用的进一步发展,需要在如下方面做更多工作:如前文所述,不同经验模型在中高温范围内的计算结果比较一致,然而在低温范围内,计算结果差异很大[38 ] ,因此探究低温编制样品碳质物质拉曼光谱信号的主控因素、开发针对低级变质样品的温度计算经验公式是有必要的.其次,如Lünsdorf等[25 ] 所指出的,现有的测试条件以及数据分析过程会因实验室和操作人员的不同有较大差别,这使得温度计算结果在一定程度上没有可比性,因此,此温度计未来发展中需要建立一个标准的样品制备和测试方法,以建立更加标准对比体系.最后,在应用方面,此温度计仍有较大空间值得开发,如可与热年代学方法结合,用于限定岩石的温度历史[21 ] ;与构造地质观测与矿物压力计等结合,限定岩石的变形与变质历史等[103 ] . ...
Laser raman spectroscopy carbon geothermal thermometer and its geological application
3
1993
... 国内外关于石墨化碳质物质温度计的研究由来已久,Rietmeijer等[22 ] 发现变质温度在400 ℃以下时,石墨d002 晶格面间隔与其峰期变质温度有一定的相关性;Wada等[23 ] 应用X射线衍射分析发现碳质物质石墨化程度与岩石变质温度在300~600 ℃范围内线性相关;Beyssac等[24 ] 结合矿物变质温度计、镜质体反射率(R O )等方法,建立了石墨化碳质物质拉曼温度计模型,并用于定量研究变质岩的峰期变质温度;此后的研究结合低温热年代学等方法,将该温度计拓展到更低温的范围[21 ] ,并应用于研究相关的变质、变形[19 ,25 ] .国内也开展了许多相关研究[26 ,27 ,28 ,29 ,30 ,31 ,32 ,33 ] ,胡凯等[26 ] 结合镜质体反射率和氧同位素古温度计等测温方法,对碳质拉曼光谱各谱峰数据进行多元回归分析,给出了中低级变质样品(200~500 ℃)变质温度估算方法.后续有学者使用碳质拉曼光谱分析开展了岩石变质级别划分、有机物成熟度测定与油气演化等研究[27 ,28 ,29 ,30 ,31 ,34 ] . ...
... [26 ]结合镜质体反射率和氧同位素古温度计等测温方法,对碳质拉曼光谱各谱峰数据进行多元回归分析,给出了中低级变质样品(200~500 ℃)变质温度估算方法.后续有学者使用碳质拉曼光谱分析开展了岩石变质级别划分、有机物成熟度测定与油气演化等研究[27 ,28 ,29 ,30 ,31 ,34 ] . ...
... 自石墨化碳质物质拉曼光谱温度计问世以来,诸多国内外学者从不同角度对该测温方法进行了详细的评述[9 ,25 ,26 ,35 ,36 ,37 ,38 ] .近年来的研究发现,石墨化碳质物质拉曼光谱信号还受到一些非温度因素的影响,这在前人综述中鲜有系统总结.因此,本文结合前人研究与作者的工作经历,试图系统地介绍该方法的原理、样品制备、测试流程、非温度影响因素、温度定量计算模型和相关地质应用. ...
激光喇曼光谱碳质地温计及其地质应用
3
1993
... 国内外关于石墨化碳质物质温度计的研究由来已久,Rietmeijer等[22 ] 发现变质温度在400 ℃以下时,石墨d002 晶格面间隔与其峰期变质温度有一定的相关性;Wada等[23 ] 应用X射线衍射分析发现碳质物质石墨化程度与岩石变质温度在300~600 ℃范围内线性相关;Beyssac等[24 ] 结合矿物变质温度计、镜质体反射率(R O )等方法,建立了石墨化碳质物质拉曼温度计模型,并用于定量研究变质岩的峰期变质温度;此后的研究结合低温热年代学等方法,将该温度计拓展到更低温的范围[21 ] ,并应用于研究相关的变质、变形[19 ,25 ] .国内也开展了许多相关研究[26 ,27 ,28 ,29 ,30 ,31 ,32 ,33 ] ,胡凯等[26 ] 结合镜质体反射率和氧同位素古温度计等测温方法,对碳质拉曼光谱各谱峰数据进行多元回归分析,给出了中低级变质样品(200~500 ℃)变质温度估算方法.后续有学者使用碳质拉曼光谱分析开展了岩石变质级别划分、有机物成熟度测定与油气演化等研究[27 ,28 ,29 ,30 ,31 ,34 ] . ...
... [26 ]结合镜质体反射率和氧同位素古温度计等测温方法,对碳质拉曼光谱各谱峰数据进行多元回归分析,给出了中低级变质样品(200~500 ℃)变质温度估算方法.后续有学者使用碳质拉曼光谱分析开展了岩石变质级别划分、有机物成熟度测定与油气演化等研究[27 ,28 ,29 ,30 ,31 ,34 ] . ...
... 自石墨化碳质物质拉曼光谱温度计问世以来,诸多国内外学者从不同角度对该测温方法进行了详细的评述[9 ,25 ,26 ,35 ,36 ,37 ,38 ] .近年来的研究发现,石墨化碳质物质拉曼光谱信号还受到一些非温度因素的影响,这在前人综述中鲜有系统总结.因此,本文结合前人研究与作者的工作经历,试图系统地介绍该方法的原理、样品制备、测试流程、非温度影响因素、温度定量计算模型和相关地质应用. ...
Laser raman spectral characteristics of coals with different metamorphic degrees
2
2002
... 国内外关于石墨化碳质物质温度计的研究由来已久,Rietmeijer等[22 ] 发现变质温度在400 ℃以下时,石墨d002 晶格面间隔与其峰期变质温度有一定的相关性;Wada等[23 ] 应用X射线衍射分析发现碳质物质石墨化程度与岩石变质温度在300~600 ℃范围内线性相关;Beyssac等[24 ] 结合矿物变质温度计、镜质体反射率(R O )等方法,建立了石墨化碳质物质拉曼温度计模型,并用于定量研究变质岩的峰期变质温度;此后的研究结合低温热年代学等方法,将该温度计拓展到更低温的范围[21 ] ,并应用于研究相关的变质、变形[19 ,25 ] .国内也开展了许多相关研究[26 ,27 ,28 ,29 ,30 ,31 ,32 ,33 ] ,胡凯等[26 ] 结合镜质体反射率和氧同位素古温度计等测温方法,对碳质拉曼光谱各谱峰数据进行多元回归分析,给出了中低级变质样品(200~500 ℃)变质温度估算方法.后续有学者使用碳质拉曼光谱分析开展了岩石变质级别划分、有机物成熟度测定与油气演化等研究[27 ,28 ,29 ,30 ,31 ,34 ] . ...
... [27 ,28 ,29 ,30 ,31 ,34 ]. ...
不同变质程度煤的激光拉曼光谱特征
2
2002
... 国内外关于石墨化碳质物质温度计的研究由来已久,Rietmeijer等[22 ] 发现变质温度在400 ℃以下时,石墨d002 晶格面间隔与其峰期变质温度有一定的相关性;Wada等[23 ] 应用X射线衍射分析发现碳质物质石墨化程度与岩石变质温度在300~600 ℃范围内线性相关;Beyssac等[24 ] 结合矿物变质温度计、镜质体反射率(R O )等方法,建立了石墨化碳质物质拉曼温度计模型,并用于定量研究变质岩的峰期变质温度;此后的研究结合低温热年代学等方法,将该温度计拓展到更低温的范围[21 ] ,并应用于研究相关的变质、变形[19 ,25 ] .国内也开展了许多相关研究[26 ,27 ,28 ,29 ,30 ,31 ,32 ,33 ] ,胡凯等[26 ] 结合镜质体反射率和氧同位素古温度计等测温方法,对碳质拉曼光谱各谱峰数据进行多元回归分析,给出了中低级变质样品(200~500 ℃)变质温度估算方法.后续有学者使用碳质拉曼光谱分析开展了岩石变质级别划分、有机物成熟度测定与油气演化等研究[27 ,28 ,29 ,30 ,31 ,34 ] . ...
... [27 ,28 ,29 ,30 ,31 ,34 ]. ...
Application of laser raman spectrum characteristic parameters to reflect the maturity of organic carbon
3
2002
... 国内外关于石墨化碳质物质温度计的研究由来已久,Rietmeijer等[22 ] 发现变质温度在400 ℃以下时,石墨d002 晶格面间隔与其峰期变质温度有一定的相关性;Wada等[23 ] 应用X射线衍射分析发现碳质物质石墨化程度与岩石变质温度在300~600 ℃范围内线性相关;Beyssac等[24 ] 结合矿物变质温度计、镜质体反射率(R O )等方法,建立了石墨化碳质物质拉曼温度计模型,并用于定量研究变质岩的峰期变质温度;此后的研究结合低温热年代学等方法,将该温度计拓展到更低温的范围[21 ] ,并应用于研究相关的变质、变形[19 ,25 ] .国内也开展了许多相关研究[26 ,27 ,28 ,29 ,30 ,31 ,32 ,33 ] ,胡凯等[26 ] 结合镜质体反射率和氧同位素古温度计等测温方法,对碳质拉曼光谱各谱峰数据进行多元回归分析,给出了中低级变质样品(200~500 ℃)变质温度估算方法.后续有学者使用碳质拉曼光谱分析开展了岩石变质级别划分、有机物成熟度测定与油气演化等研究[27 ,28 ,29 ,30 ,31 ,34 ] . ...
... ,28 ,29 ,30 ,31 ,34 ]. ...
... 在油气地质学领域,镜质体反射率是反映有机质热演化成熟度比较通用的指标,是进行有机质生油阶段(温度小于约250 ℃)划分的标尺[91 ,92 ] .而在更高的有机质成熟阶段,镜质体反射率指标敏感度降低[92 ,93 ] ,同时有些样品可能不含镜质体[28 ] ,为了完善有机质成熟度的判断方法,诸多学者尝试利用有机质拉曼光谱分析进行成熟度评价:Kelemen等[93 ] 发现随成熟度增加,拉曼谱峰中D峰与G峰面积比值减小;刘德汉等[94 ] 利用不同热演化程度的样品,得出适用于高成熟度样品的成熟度计算经验公式;Wilkins等[95 ,96 ] 也根据不同热演化程度煤的拉曼光谱特征建立了有机质成熟度的计算方法;王民等[97 ] 在Wilkins等[95 ,96 ] 的工作基础上建立了一种镜质组随机反射率(Rr )在0.4%~2.5%范围内的有机质热成熟度评价的拉曼模型;张聪等[98 ] 结合样品扫描电镜分析结果,验证了拉曼光谱技术是测定高成熟度有机质的一种行之有效的手段.这些研究表明了有机质激光拉曼再判断有机质成熟度方面的潜力,尤其是镜质体缺失或镜质体反射率受到抑制或识别困难的沉积岩中具有广阔的应用前景[97 ] .在其他地球科学领域,也有石墨化碳质物质拉曼光谱温度计的应用方向:如探究岩浆侵入所伴随的热效应[19 ,49 ] ,球粒陨石的热演化[7 ] ,示踪沉积物源区与碳质物质经历的沉积循环[99 ,100 ,101 ,102 ] ,有机质矿化过程中的变质温度[2 ] ,造山带剥蚀过程[84 ,85 ] 等. ...
应用激光喇曼光谱特征参数反映有机碳质的成熟度
3
2002
... 国内外关于石墨化碳质物质温度计的研究由来已久,Rietmeijer等[22 ] 发现变质温度在400 ℃以下时,石墨d002 晶格面间隔与其峰期变质温度有一定的相关性;Wada等[23 ] 应用X射线衍射分析发现碳质物质石墨化程度与岩石变质温度在300~600 ℃范围内线性相关;Beyssac等[24 ] 结合矿物变质温度计、镜质体反射率(R O )等方法,建立了石墨化碳质物质拉曼温度计模型,并用于定量研究变质岩的峰期变质温度;此后的研究结合低温热年代学等方法,将该温度计拓展到更低温的范围[21 ] ,并应用于研究相关的变质、变形[19 ,25 ] .国内也开展了许多相关研究[26 ,27 ,28 ,29 ,30 ,31 ,32 ,33 ] ,胡凯等[26 ] 结合镜质体反射率和氧同位素古温度计等测温方法,对碳质拉曼光谱各谱峰数据进行多元回归分析,给出了中低级变质样品(200~500 ℃)变质温度估算方法.后续有学者使用碳质拉曼光谱分析开展了岩石变质级别划分、有机物成熟度测定与油气演化等研究[27 ,28 ,29 ,30 ,31 ,34 ] . ...
... ,28 ,29 ,30 ,31 ,34 ]. ...
... 在油气地质学领域,镜质体反射率是反映有机质热演化成熟度比较通用的指标,是进行有机质生油阶段(温度小于约250 ℃)划分的标尺[91 ,92 ] .而在更高的有机质成熟阶段,镜质体反射率指标敏感度降低[92 ,93 ] ,同时有些样品可能不含镜质体[28 ] ,为了完善有机质成熟度的判断方法,诸多学者尝试利用有机质拉曼光谱分析进行成熟度评价:Kelemen等[93 ] 发现随成熟度增加,拉曼谱峰中D峰与G峰面积比值减小;刘德汉等[94 ] 利用不同热演化程度的样品,得出适用于高成熟度样品的成熟度计算经验公式;Wilkins等[95 ,96 ] 也根据不同热演化程度煤的拉曼光谱特征建立了有机质成熟度的计算方法;王民等[97 ] 在Wilkins等[95 ,96 ] 的工作基础上建立了一种镜质组随机反射率(Rr )在0.4%~2.5%范围内的有机质热成熟度评价的拉曼模型;张聪等[98 ] 结合样品扫描电镜分析结果,验证了拉曼光谱技术是测定高成熟度有机质的一种行之有效的手段.这些研究表明了有机质激光拉曼再判断有机质成熟度方面的潜力,尤其是镜质体缺失或镜质体反射率受到抑制或识别困难的沉积岩中具有广阔的应用前景[97 ] .在其他地球科学领域,也有石墨化碳质物质拉曼光谱温度计的应用方向:如探究岩浆侵入所伴随的热效应[19 ,49 ] ,球粒陨石的热演化[7 ] ,示踪沉积物源区与碳质物质经历的沉积循环[99 ,100 ,101 ,102 ] ,有机质矿化过程中的变质温度[2 ] ,造山带剥蚀过程[84 ,85 ] 等. ...
Raman spectral characteristics of residual organic matter in sedimentary rocks
2
2005
... 国内外关于石墨化碳质物质温度计的研究由来已久,Rietmeijer等[22 ] 发现变质温度在400 ℃以下时,石墨d002 晶格面间隔与其峰期变质温度有一定的相关性;Wada等[23 ] 应用X射线衍射分析发现碳质物质石墨化程度与岩石变质温度在300~600 ℃范围内线性相关;Beyssac等[24 ] 结合矿物变质温度计、镜质体反射率(R O )等方法,建立了石墨化碳质物质拉曼温度计模型,并用于定量研究变质岩的峰期变质温度;此后的研究结合低温热年代学等方法,将该温度计拓展到更低温的范围[21 ] ,并应用于研究相关的变质、变形[19 ,25 ] .国内也开展了许多相关研究[26 ,27 ,28 ,29 ,30 ,31 ,32 ,33 ] ,胡凯等[26 ] 结合镜质体反射率和氧同位素古温度计等测温方法,对碳质拉曼光谱各谱峰数据进行多元回归分析,给出了中低级变质样品(200~500 ℃)变质温度估算方法.后续有学者使用碳质拉曼光谱分析开展了岩石变质级别划分、有机物成熟度测定与油气演化等研究[27 ,28 ,29 ,30 ,31 ,34 ] . ...
... ,29 ,30 ,31 ,34 ]. ...
沉积岩中残留有机质的拉曼光谱特征
2
2005
... 国内外关于石墨化碳质物质温度计的研究由来已久,Rietmeijer等[22 ] 发现变质温度在400 ℃以下时,石墨d002 晶格面间隔与其峰期变质温度有一定的相关性;Wada等[23 ] 应用X射线衍射分析发现碳质物质石墨化程度与岩石变质温度在300~600 ℃范围内线性相关;Beyssac等[24 ] 结合矿物变质温度计、镜质体反射率(R O )等方法,建立了石墨化碳质物质拉曼温度计模型,并用于定量研究变质岩的峰期变质温度;此后的研究结合低温热年代学等方法,将该温度计拓展到更低温的范围[21 ] ,并应用于研究相关的变质、变形[19 ,25 ] .国内也开展了许多相关研究[26 ,27 ,28 ,29 ,30 ,31 ,32 ,33 ] ,胡凯等[26 ] 结合镜质体反射率和氧同位素古温度计等测温方法,对碳质拉曼光谱各谱峰数据进行多元回归分析,给出了中低级变质样品(200~500 ℃)变质温度估算方法.后续有学者使用碳质拉曼光谱分析开展了岩石变质级别划分、有机物成熟度测定与油气演化等研究[27 ,28 ,29 ,30 ,31 ,34 ] . ...
... ,29 ,30 ,31 ,34 ]. ...
Very low grade metamorphic temperatures of the upper paleozoic strata in Northern Daxing'anling Area, NE China:Evidence from raman spectrum studies of carbonaceous materials
3
2015
... 国内外关于石墨化碳质物质温度计的研究由来已久,Rietmeijer等[22 ] 发现变质温度在400 ℃以下时,石墨d002 晶格面间隔与其峰期变质温度有一定的相关性;Wada等[23 ] 应用X射线衍射分析发现碳质物质石墨化程度与岩石变质温度在300~600 ℃范围内线性相关;Beyssac等[24 ] 结合矿物变质温度计、镜质体反射率(R O )等方法,建立了石墨化碳质物质拉曼温度计模型,并用于定量研究变质岩的峰期变质温度;此后的研究结合低温热年代学等方法,将该温度计拓展到更低温的范围[21 ] ,并应用于研究相关的变质、变形[19 ,25 ] .国内也开展了许多相关研究[26 ,27 ,28 ,29 ,30 ,31 ,32 ,33 ] ,胡凯等[26 ] 结合镜质体反射率和氧同位素古温度计等测温方法,对碳质拉曼光谱各谱峰数据进行多元回归分析,给出了中低级变质样品(200~500 ℃)变质温度估算方法.后续有学者使用碳质拉曼光谱分析开展了岩石变质级别划分、有机物成熟度测定与油气演化等研究[27 ,28 ,29 ,30 ,31 ,34 ] . ...
... ,30 ,31 ,34 ]. ...
... 常用的拉曼光谱测试设备主要是HORIBA-JY LabRAM、Renishaw inViaTM 和Thermo Scientific™ DXR™2xi显微拉曼成像光谱仪,诸多研究使用的激光波长为514.5 nm.测试中可通过如下两种方式提高信噪比:采用长曝光时间(20~300 s[24 ,30 ,31 ] ),或信号多次叠加.本文展示的数据采集自Thermo Scientific™ DXR™2xi显微拉曼成像光谱仪,测试所用激光波长为514.5 nm,光斑直径约为1 μm,功率为1 mW,照射频率为10 Hz,时间为20 s,光谱接收范围为1 000~1 800 cm-1 . ...
大兴安岭北部上古生界极低级变质温度——来自碳质物拉曼光谱的证据
3
2015
... 国内外关于石墨化碳质物质温度计的研究由来已久,Rietmeijer等[22 ] 发现变质温度在400 ℃以下时,石墨d002 晶格面间隔与其峰期变质温度有一定的相关性;Wada等[23 ] 应用X射线衍射分析发现碳质物质石墨化程度与岩石变质温度在300~600 ℃范围内线性相关;Beyssac等[24 ] 结合矿物变质温度计、镜质体反射率(R O )等方法,建立了石墨化碳质物质拉曼温度计模型,并用于定量研究变质岩的峰期变质温度;此后的研究结合低温热年代学等方法,将该温度计拓展到更低温的范围[21 ] ,并应用于研究相关的变质、变形[19 ,25 ] .国内也开展了许多相关研究[26 ,27 ,28 ,29 ,30 ,31 ,32 ,33 ] ,胡凯等[26 ] 结合镜质体反射率和氧同位素古温度计等测温方法,对碳质拉曼光谱各谱峰数据进行多元回归分析,给出了中低级变质样品(200~500 ℃)变质温度估算方法.后续有学者使用碳质拉曼光谱分析开展了岩石变质级别划分、有机物成熟度测定与油气演化等研究[27 ,28 ,29 ,30 ,31 ,34 ] . ...
... ,30 ,31 ,34 ]. ...
... 常用的拉曼光谱测试设备主要是HORIBA-JY LabRAM、Renishaw inViaTM 和Thermo Scientific™ DXR™2xi显微拉曼成像光谱仪,诸多研究使用的激光波长为514.5 nm.测试中可通过如下两种方式提高信噪比:采用长曝光时间(20~300 s[24 ,30 ,31 ] ),或信号多次叠加.本文展示的数据采集自Thermo Scientific™ DXR™2xi显微拉曼成像光谱仪,测试所用激光波长为514.5 nm,光斑直径约为1 μm,功率为1 mW,照射频率为10 Hz,时间为20 s,光谱接收范围为1 000~1 800 cm-1 . ...
Raman spectrum characteristics of organic materials of Middle Permian Zhesi Formation in Suolun area, Inner Mongolia and their geological implication
3
2016
... 国内外关于石墨化碳质物质温度计的研究由来已久,Rietmeijer等[22 ] 发现变质温度在400 ℃以下时,石墨d002 晶格面间隔与其峰期变质温度有一定的相关性;Wada等[23 ] 应用X射线衍射分析发现碳质物质石墨化程度与岩石变质温度在300~600 ℃范围内线性相关;Beyssac等[24 ] 结合矿物变质温度计、镜质体反射率(R O )等方法,建立了石墨化碳质物质拉曼温度计模型,并用于定量研究变质岩的峰期变质温度;此后的研究结合低温热年代学等方法,将该温度计拓展到更低温的范围[21 ] ,并应用于研究相关的变质、变形[19 ,25 ] .国内也开展了许多相关研究[26 ,27 ,28 ,29 ,30 ,31 ,32 ,33 ] ,胡凯等[26 ] 结合镜质体反射率和氧同位素古温度计等测温方法,对碳质拉曼光谱各谱峰数据进行多元回归分析,给出了中低级变质样品(200~500 ℃)变质温度估算方法.后续有学者使用碳质拉曼光谱分析开展了岩石变质级别划分、有机物成熟度测定与油气演化等研究[27 ,28 ,29 ,30 ,31 ,34 ] . ...
... ,31 ,34 ]. ...
... 常用的拉曼光谱测试设备主要是HORIBA-JY LabRAM、Renishaw inViaTM 和Thermo Scientific™ DXR™2xi显微拉曼成像光谱仪,诸多研究使用的激光波长为514.5 nm.测试中可通过如下两种方式提高信噪比:采用长曝光时间(20~300 s[24 ,30 ,31 ] ),或信号多次叠加.本文展示的数据采集自Thermo Scientific™ DXR™2xi显微拉曼成像光谱仪,测试所用激光波长为514.5 nm,光斑直径约为1 μm,功率为1 mW,照射频率为10 Hz,时间为20 s,光谱接收范围为1 000~1 800 cm-1 . ...
内蒙古索伦地区中二叠统哲斯组有机质的拉曼光谱特征及地质意义
3
2016
... 国内外关于石墨化碳质物质温度计的研究由来已久,Rietmeijer等[22 ] 发现变质温度在400 ℃以下时,石墨d002 晶格面间隔与其峰期变质温度有一定的相关性;Wada等[23 ] 应用X射线衍射分析发现碳质物质石墨化程度与岩石变质温度在300~600 ℃范围内线性相关;Beyssac等[24 ] 结合矿物变质温度计、镜质体反射率(R O )等方法,建立了石墨化碳质物质拉曼温度计模型,并用于定量研究变质岩的峰期变质温度;此后的研究结合低温热年代学等方法,将该温度计拓展到更低温的范围[21 ] ,并应用于研究相关的变质、变形[19 ,25 ] .国内也开展了许多相关研究[26 ,27 ,28 ,29 ,30 ,31 ,32 ,33 ] ,胡凯等[26 ] 结合镜质体反射率和氧同位素古温度计等测温方法,对碳质拉曼光谱各谱峰数据进行多元回归分析,给出了中低级变质样品(200~500 ℃)变质温度估算方法.后续有学者使用碳质拉曼光谱分析开展了岩石变质级别划分、有机物成熟度测定与油气演化等研究[27 ,28 ,29 ,30 ,31 ,34 ] . ...
... ,31 ,34 ]. ...
... 常用的拉曼光谱测试设备主要是HORIBA-JY LabRAM、Renishaw inViaTM 和Thermo Scientific™ DXR™2xi显微拉曼成像光谱仪,诸多研究使用的激光波长为514.5 nm.测试中可通过如下两种方式提高信噪比:采用长曝光时间(20~300 s[24 ,30 ,31 ] ),或信号多次叠加.本文展示的数据采集自Thermo Scientific™ DXR™2xi显微拉曼成像光谱仪,测试所用激光波长为514.5 nm,光斑直径约为1 μm,功率为1 mW,照射频率为10 Hz,时间为20 s,光谱接收范围为1 000~1 800 cm-1 . ...
Genetic features of Dawudian graphite deposit in Urad Middle Banner, Inner Mongolia
1
2017
... 国内外关于石墨化碳质物质温度计的研究由来已久,Rietmeijer等[22 ] 发现变质温度在400 ℃以下时,石墨d002 晶格面间隔与其峰期变质温度有一定的相关性;Wada等[23 ] 应用X射线衍射分析发现碳质物质石墨化程度与岩石变质温度在300~600 ℃范围内线性相关;Beyssac等[24 ] 结合矿物变质温度计、镜质体反射率(R O )等方法,建立了石墨化碳质物质拉曼温度计模型,并用于定量研究变质岩的峰期变质温度;此后的研究结合低温热年代学等方法,将该温度计拓展到更低温的范围[21 ] ,并应用于研究相关的变质、变形[19 ,25 ] .国内也开展了许多相关研究[26 ,27 ,28 ,29 ,30 ,31 ,32 ,33 ] ,胡凯等[26 ] 结合镜质体反射率和氧同位素古温度计等测温方法,对碳质拉曼光谱各谱峰数据进行多元回归分析,给出了中低级变质样品(200~500 ℃)变质温度估算方法.后续有学者使用碳质拉曼光谱分析开展了岩石变质级别划分、有机物成熟度测定与油气演化等研究[27 ,28 ,29 ,30 ,31 ,34 ] . ...
内蒙古乌拉特中旗大乌淀石墨矿成因特征分析
1
2017
... 国内外关于石墨化碳质物质温度计的研究由来已久,Rietmeijer等[22 ] 发现变质温度在400 ℃以下时,石墨d002 晶格面间隔与其峰期变质温度有一定的相关性;Wada等[23 ] 应用X射线衍射分析发现碳质物质石墨化程度与岩石变质温度在300~600 ℃范围内线性相关;Beyssac等[24 ] 结合矿物变质温度计、镜质体反射率(R O )等方法,建立了石墨化碳质物质拉曼温度计模型,并用于定量研究变质岩的峰期变质温度;此后的研究结合低温热年代学等方法,将该温度计拓展到更低温的范围[21 ] ,并应用于研究相关的变质、变形[19 ,25 ] .国内也开展了许多相关研究[26 ,27 ,28 ,29 ,30 ,31 ,32 ,33 ] ,胡凯等[26 ] 结合镜质体反射率和氧同位素古温度计等测温方法,对碳质拉曼光谱各谱峰数据进行多元回归分析,给出了中低级变质样品(200~500 ℃)变质温度估算方法.后续有学者使用碳质拉曼光谱分析开展了岩石变质级别划分、有机物成熟度测定与油气演化等研究[27 ,28 ,29 ,30 ,31 ,34 ] . ...
Characteristics and significance of maturity of Raman spectra of type I kerogen during maturation
1
2018
... 国内外关于石墨化碳质物质温度计的研究由来已久,Rietmeijer等[22 ] 发现变质温度在400 ℃以下时,石墨d002 晶格面间隔与其峰期变质温度有一定的相关性;Wada等[23 ] 应用X射线衍射分析发现碳质物质石墨化程度与岩石变质温度在300~600 ℃范围内线性相关;Beyssac等[24 ] 结合矿物变质温度计、镜质体反射率(R O )等方法,建立了石墨化碳质物质拉曼温度计模型,并用于定量研究变质岩的峰期变质温度;此后的研究结合低温热年代学等方法,将该温度计拓展到更低温的范围[21 ] ,并应用于研究相关的变质、变形[19 ,25 ] .国内也开展了许多相关研究[26 ,27 ,28 ,29 ,30 ,31 ,32 ,33 ] ,胡凯等[26 ] 结合镜质体反射率和氧同位素古温度计等测温方法,对碳质拉曼光谱各谱峰数据进行多元回归分析,给出了中低级变质样品(200~500 ℃)变质温度估算方法.后续有学者使用碳质拉曼光谱分析开展了岩石变质级别划分、有机物成熟度测定与油气演化等研究[27 ,28 ,29 ,30 ,31 ,34 ] . ...
Ⅰ型干酪根热成熟过程中拉曼光谱特征及其成熟度意义
1
2018
... 国内外关于石墨化碳质物质温度计的研究由来已久,Rietmeijer等[22 ] 发现变质温度在400 ℃以下时,石墨d002 晶格面间隔与其峰期变质温度有一定的相关性;Wada等[23 ] 应用X射线衍射分析发现碳质物质石墨化程度与岩石变质温度在300~600 ℃范围内线性相关;Beyssac等[24 ] 结合矿物变质温度计、镜质体反射率(R O )等方法,建立了石墨化碳质物质拉曼温度计模型,并用于定量研究变质岩的峰期变质温度;此后的研究结合低温热年代学等方法,将该温度计拓展到更低温的范围[21 ] ,并应用于研究相关的变质、变形[19 ,25 ] .国内也开展了许多相关研究[26 ,27 ,28 ,29 ,30 ,31 ,32 ,33 ] ,胡凯等[26 ] 结合镜质体反射率和氧同位素古温度计等测温方法,对碳质拉曼光谱各谱峰数据进行多元回归分析,给出了中低级变质样品(200~500 ℃)变质温度估算方法.后续有学者使用碳质拉曼光谱分析开展了岩石变质级别划分、有机物成熟度测定与油气演化等研究[27 ,28 ,29 ,30 ,31 ,34 ] . ...
Elementary investigation on the application of laser raman microprobe in petroleum exploration
1
2004
... 国内外关于石墨化碳质物质温度计的研究由来已久,Rietmeijer等[22 ] 发现变质温度在400 ℃以下时,石墨d002 晶格面间隔与其峰期变质温度有一定的相关性;Wada等[23 ] 应用X射线衍射分析发现碳质物质石墨化程度与岩石变质温度在300~600 ℃范围内线性相关;Beyssac等[24 ] 结合矿物变质温度计、镜质体反射率(R O )等方法,建立了石墨化碳质物质拉曼温度计模型,并用于定量研究变质岩的峰期变质温度;此后的研究结合低温热年代学等方法,将该温度计拓展到更低温的范围[21 ] ,并应用于研究相关的变质、变形[19 ,25 ] .国内也开展了许多相关研究[26 ,27 ,28 ,29 ,30 ,31 ,32 ,33 ] ,胡凯等[26 ] 结合镜质体反射率和氧同位素古温度计等测温方法,对碳质拉曼光谱各谱峰数据进行多元回归分析,给出了中低级变质样品(200~500 ℃)变质温度估算方法.后续有学者使用碳质拉曼光谱分析开展了岩石变质级别划分、有机物成熟度测定与油气演化等研究[27 ,28 ,29 ,30 ,31 ,34 ] . ...
激光拉曼光谱在油气勘探中的应用研究初探
1
2004
... 国内外关于石墨化碳质物质温度计的研究由来已久,Rietmeijer等[22 ] 发现变质温度在400 ℃以下时,石墨d002 晶格面间隔与其峰期变质温度有一定的相关性;Wada等[23 ] 应用X射线衍射分析发现碳质物质石墨化程度与岩石变质温度在300~600 ℃范围内线性相关;Beyssac等[24 ] 结合矿物变质温度计、镜质体反射率(R O )等方法,建立了石墨化碳质物质拉曼温度计模型,并用于定量研究变质岩的峰期变质温度;此后的研究结合低温热年代学等方法,将该温度计拓展到更低温的范围[21 ] ,并应用于研究相关的变质、变形[19 ,25 ] .国内也开展了许多相关研究[26 ,27 ,28 ,29 ,30 ,31 ,32 ,33 ] ,胡凯等[26 ] 结合镜质体反射率和氧同位素古温度计等测温方法,对碳质拉曼光谱各谱峰数据进行多元回归分析,给出了中低级变质样品(200~500 ℃)变质温度估算方法.后续有学者使用碳质拉曼光谱分析开展了岩石变质级别划分、有机物成熟度测定与油气演化等研究[27 ,28 ,29 ,30 ,31 ,34 ] . ...
Towards a higher comparability of geothermometric data obtained by raman spectroscopy of carbonaceous material. Part I: Evaluation of biasing factors
6
2014
... 自石墨化碳质物质拉曼光谱温度计问世以来,诸多国内外学者从不同角度对该测温方法进行了详细的评述[9 ,25 ,26 ,35 ,36 ,37 ,38 ] .近年来的研究发现,石墨化碳质物质拉曼光谱信号还受到一些非温度因素的影响,这在前人综述中鲜有系统总结.因此,本文结合前人研究与作者的工作经历,试图系统地介绍该方法的原理、样品制备、测试流程、非温度影响因素、温度定量计算模型和相关地质应用. ...
... (1)荧光背景扣除.虽然诸多显微拉曼成像光谱仪具有消除荧光信号干扰的功能,但测试数据中仍会残留一定的荧光信号.中高温变质样品的荧光背景一般表现为近线性(图3 a),而低温变质样品的荧光背景往往为非线性(图3 b).因此,需要使用光谱分析软件,建立荧光背景基线,并进行扣除.基线校正可用Peakfit4.12 (https://systatsoftware.com )或Fityk(https://fityk.nieto.pl )等软件.由于1 000~1 100 cm-1 和1 700~1 800 cm-1 范围内不存在石墨特征拉曼谱峰,所观测的信号应为荧光背景,本文使用三次多项式函数拟合这些信号,进而构建荧光基线[35 ] . ...
... (2)分峰拟合.由于石墨峰(G峰)与缺陷峰(D峰)都具有一定的分布范围,当信号重叠时很难直接获得单个谱峰的信号强度与分布面积,因此需对光谱进行分峰拟合.使用不同的拟合函数会在一定程度上影响谱峰拟合的强度与面积,并最终影响温度计算结果,因此需选用合适的光谱拟合函数.光谱拟合函数种类多样,如线性函数(Linear)、多项式函数(Polyomial)、高斯函数(Gauss)、福格特函数(Voigt)和洛伦兹函数(Lorentzian)等.对于石墨拉曼光谱,常用的拟合函数为福格特函数和洛伦兹函数[8 ,19 ,24 ,35 ] .Lahfid等[8 ] 认为在变质温度较低时应使用洛伦兹函数对光谱进行分析,而Beyssca等[24 ] 的研究主要使用福格特函数.为了对比拟合函数不同对结果的影响,Lünsdorf等[35 ] 分别使用洛伦兹和福格特函数对19个不同变质温度的样品进行了光谱拟合,结果显示仅在低温(约小于350 ℃)变质样品的光谱拟合结果上产生较大差别,中高温变质样品未见明显区别.通过温度计算结果与其他温度计测温结果对比显示,在低温变质区间,洛伦兹函数的光谱拟合结果明显比福格特函数更加准确[35 ] .因此不论在何种温度区间,均可使用洛伦兹函数对光谱进行拟合分析.另外根据作者对龙门山云母片岩、胶北矽线石榴片麻岩的测试结果,在中高温变质区间,使用两种光谱拟合函数最终获得的变质温度差别小于10 ℃,因此统一使用洛伦兹函数进行光谱分析较为合理(图1 a). ...
... [35 ]分别使用洛伦兹和福格特函数对19个不同变质温度的样品进行了光谱拟合,结果显示仅在低温(约小于350 ℃)变质样品的光谱拟合结果上产生较大差别,中高温变质样品未见明显区别.通过温度计算结果与其他温度计测温结果对比显示,在低温变质区间,洛伦兹函数的光谱拟合结果明显比福格特函数更加准确[35 ] .因此不论在何种温度区间,均可使用洛伦兹函数对光谱进行拟合分析.另外根据作者对龙门山云母片岩、胶北矽线石榴片麻岩的测试结果,在中高温变质区间,使用两种光谱拟合函数最终获得的变质温度差别小于10 ℃,因此统一使用洛伦兹函数进行光谱分析较为合理(图1 a). ...
... [35 ].因此不论在何种温度区间,均可使用洛伦兹函数对光谱进行拟合分析.另外根据作者对龙门山云母片岩、胶北矽线石榴片麻岩的测试结果,在中高温变质区间,使用两种光谱拟合函数最终获得的变质温度差别小于10 ℃,因此统一使用洛伦兹函数进行光谱分析较为合理(图1 a). ...
... 激光照射会使石墨化碳质物质受热发生热氧化,进而影响拉曼测试结果[68 ] .这种现象的主要表现形式是碳质物质表面被烧蚀,且谱峰强度与位置发生改变[69 ] (图8 ).据前人研究,激光能量过强会使G峰频移减小,D峰强度降低[70 ,71 ] .因此在测试时需控制测试激光能量,对于直径1 μm的测试光斑,激光输出能量不宜超过1 mW[35 ] . ...
Raman spectroscopy of graphite
1
2004
... 自石墨化碳质物质拉曼光谱温度计问世以来,诸多国内外学者从不同角度对该测温方法进行了详细的评述[9 ,25 ,26 ,35 ,36 ,37 ,38 ] .近年来的研究发现,石墨化碳质物质拉曼光谱信号还受到一些非温度因素的影响,这在前人综述中鲜有系统总结.因此,本文结合前人研究与作者的工作经历,试图系统地介绍该方法的原理、样品制备、测试流程、非温度影响因素、温度定量计算模型和相关地质应用. ...
Laser raman spectroscopy carbon geothermometer—A new method of paleo-geothermal test
3
1992
... 自石墨化碳质物质拉曼光谱温度计问世以来,诸多国内外学者从不同角度对该测温方法进行了详细的评述[9 ,25 ,26 ,35 ,36 ,37 ,38 ] .近年来的研究发现,石墨化碳质物质拉曼光谱信号还受到一些非温度因素的影响,这在前人综述中鲜有系统总结.因此,本文结合前人研究与作者的工作经历,试图系统地介绍该方法的原理、样品制备、测试流程、非温度影响因素、温度定量计算模型和相关地质应用. ...
... 石墨化碳质物质拉曼温度计模型主要有以下几种.胡凯等[37 ] 使用Dilor-28型拉曼光谱显微探针,采用1 mW、488 nm的激光对样品进行分析.根据已通过氧同位素、变质矿物组合和镜质体反射率共同限定变质温度的岩石样品,使用多元回归分析方法,拟合了变质温度与碳质拉曼光谱参数,得到了在200~500 ℃范围内的温度计算公式[37 ] .Beyssac等[24 ] 使用DILOR XY拉曼光谱仪(激光参数为:波长514.5 nm、功率1~5 mW、光斑直径约2 µm),对岩石峰期变质温度与石墨化碳质物质拉曼光谱特征进行了更加系统地分析,从阿尔卑斯、日本、希腊等地选取了不同变质级别的岩石样品,根据变质矿物对独立限定样品的温压条件,通过拟合光谱测试的R 2参数[公式(1),其中D1、D2和G为石墨对应的拉曼谱峰]与变质温压的对应关系,发现R 2与岩石变质压力无关,与温度(T )有良好的线性关系[公式(2)],并确定该方法的适用温度区间为330~650 ℃,计算误差为±50 ℃. ...
... [37 ].Beyssac等[24 ] 使用DILOR XY拉曼光谱仪(激光参数为:波长514.5 nm、功率1~5 mW、光斑直径约2 µm),对岩石峰期变质温度与石墨化碳质物质拉曼光谱特征进行了更加系统地分析,从阿尔卑斯、日本、希腊等地选取了不同变质级别的岩石样品,根据变质矿物对独立限定样品的温压条件,通过拟合光谱测试的R 2参数[公式(1),其中D1、D2和G为石墨对应的拉曼谱峰]与变质温压的对应关系,发现R 2与岩石变质压力无关,与温度(T )有良好的线性关系[公式(2)],并确定该方法的适用温度区间为330~650 ℃,计算误差为±50 ℃. ...
激光拉曼光谱碳质地温计——一种新的古地温测试方法
3
1992
... 自石墨化碳质物质拉曼光谱温度计问世以来,诸多国内外学者从不同角度对该测温方法进行了详细的评述[9 ,25 ,26 ,35 ,36 ,37 ,38 ] .近年来的研究发现,石墨化碳质物质拉曼光谱信号还受到一些非温度因素的影响,这在前人综述中鲜有系统总结.因此,本文结合前人研究与作者的工作经历,试图系统地介绍该方法的原理、样品制备、测试流程、非温度影响因素、温度定量计算模型和相关地质应用. ...
... 石墨化碳质物质拉曼温度计模型主要有以下几种.胡凯等[37 ] 使用Dilor-28型拉曼光谱显微探针,采用1 mW、488 nm的激光对样品进行分析.根据已通过氧同位素、变质矿物组合和镜质体反射率共同限定变质温度的岩石样品,使用多元回归分析方法,拟合了变质温度与碳质拉曼光谱参数,得到了在200~500 ℃范围内的温度计算公式[37 ] .Beyssac等[24 ] 使用DILOR XY拉曼光谱仪(激光参数为:波长514.5 nm、功率1~5 mW、光斑直径约2 µm),对岩石峰期变质温度与石墨化碳质物质拉曼光谱特征进行了更加系统地分析,从阿尔卑斯、日本、希腊等地选取了不同变质级别的岩石样品,根据变质矿物对独立限定样品的温压条件,通过拟合光谱测试的R 2参数[公式(1),其中D1、D2和G为石墨对应的拉曼谱峰]与变质温压的对应关系,发现R 2与岩石变质压力无关,与温度(T )有良好的线性关系[公式(2)],并确定该方法的适用温度区间为330~650 ℃,计算误差为±50 ℃. ...
... [37 ].Beyssac等[24 ] 使用DILOR XY拉曼光谱仪(激光参数为:波长514.5 nm、功率1~5 mW、光斑直径约2 µm),对岩石峰期变质温度与石墨化碳质物质拉曼光谱特征进行了更加系统地分析,从阿尔卑斯、日本、希腊等地选取了不同变质级别的岩石样品,根据变质矿物对独立限定样品的温压条件,通过拟合光谱测试的R 2参数[公式(1),其中D1、D2和G为石墨对应的拉曼谱峰]与变质温压的对应关系,发现R 2与岩石变质压力无关,与温度(T )有良好的线性关系[公式(2)],并确定该方法的适用温度区间为330~650 ℃,计算误差为±50 ℃. ...
A new approach to develop the raman carbonaceous material geothermometer for low-grade metamorphism using peak width
4
2014
... 自石墨化碳质物质拉曼光谱温度计问世以来,诸多国内外学者从不同角度对该测温方法进行了详细的评述[9 ,25 ,26 ,35 ,36 ,37 ,38 ] .近年来的研究发现,石墨化碳质物质拉曼光谱信号还受到一些非温度因素的影响,这在前人综述中鲜有系统总结.因此,本文结合前人研究与作者的工作经历,试图系统地介绍该方法的原理、样品制备、测试流程、非温度影响因素、温度定量计算模型和相关地质应用. ...
... 除上述研究外,也有学者利用不同的光谱参数拟合浅变质样品的峰期变质温度,Kouketsu等[38 ] 使用Thermo Nicolet™拉曼光谱仪(激光参数为:波长532 nm、功率1~3 mW、光斑直径约1 µm),通过对经伊利石K-Ar同位素、伊利石结晶度和镜质体反射率共同限定变质温度的样品进行拉曼光谱分析,发现浅变质样品D1和D2峰的半高宽[公式(7)和(8)中的FWHM.D1与FWHM.D2参数]与峰期变质温度有很好的相关性,从而通过数据拟合,得到温度计算公式(7)和(8),适用温度为150~400 ℃,误差分别为±30和±50 ℃.由于实验室条件差异及下文将分析的非温度的影响因素,公式(7)和(8)仅使用一个独立参数可能会使结果波动性较大,同时测温结果的相对误差也较大,因此在使用这两个公式前最好有其他温度计对其进行标定[38 ] . ...
... [38 ]. ...
... 作为一种定量测试中低级变质岩峰期变质温度的方法,石墨化碳质物质拉曼光谱温度计具有样品制备简单、测试方便快捷、测试周期短等优点,相关实验与应用需要注意样品制备、碳质物质的非均质性与各向异性、样品风化程度等非温度因素的影响.抛砖引玉,作者认为该温度计方法理论与应用的进一步发展,需要在如下方面做更多工作:如前文所述,不同经验模型在中高温范围内的计算结果比较一致,然而在低温范围内,计算结果差异很大[38 ] ,因此探究低温编制样品碳质物质拉曼光谱信号的主控因素、开发针对低级变质样品的温度计算经验公式是有必要的.其次,如Lünsdorf等[25 ] 所指出的,现有的测试条件以及数据分析过程会因实验室和操作人员的不同有较大差别,这使得温度计算结果在一定程度上没有可比性,因此,此温度计未来发展中需要建立一个标准的样品制备和测试方法,以建立更加标准对比体系.最后,在应用方面,此温度计仍有较大空间值得开发,如可与热年代学方法结合,用于限定岩石的温度历史[21 ] ;与构造地质观测与矿物压力计等结合,限定岩石的变形与变质历史等[103 ] . ...
Raman spectrum of graphite
5
1970
... 拉曼散射与物质的成分和结构紧密相关[39 ,40 ,41 ,42 ,43 ] .对于碳质物质,其石墨化程度不同,拉曼光谱特征差异显著[39 ,44 ] :碳质石墨化较高时,碳原子层排列有序,层间间距较小,没有其他原子团,表现为显著的G峰(1 580 cm-1 ),其振动模式为E2g2 型[9 ,24 ,39 ] ;而在晶格结构有限的情况下,石墨碳层边界缺陷会导致形成D1缺陷峰(1 350 cm-1 ),振动模式为A1g 型[9 ,24 ,39 ] ;石墨化程度较低时,由于晶格缺陷较多,光谱会表现出较多的缺陷锋,如频移在1 620 cm-1 (D2)、1 510 cm-1 (D3)和1 245 cm-1 (D4)的谱峰[9 ,25 ,39 ,44 ,45 ,46 ,47 ] (图1 a). ...
... [39 ,44 ]:碳质石墨化较高时,碳原子层排列有序,层间间距较小,没有其他原子团,表现为显著的G峰(1 580 cm-1 ),其振动模式为E2g2 型[9 ,24 ,39 ] ;而在晶格结构有限的情况下,石墨碳层边界缺陷会导致形成D1缺陷峰(1 350 cm-1 ),振动模式为A1g 型[9 ,24 ,39 ] ;石墨化程度较低时,由于晶格缺陷较多,光谱会表现出较多的缺陷锋,如频移在1 620 cm-1 (D2)、1 510 cm-1 (D3)和1 245 cm-1 (D4)的谱峰[9 ,25 ,39 ,44 ,45 ,46 ,47 ] (图1 a). ...
... ,39 ];而在晶格结构有限的情况下,石墨碳层边界缺陷会导致形成D1缺陷峰(1 350 cm-1 ),振动模式为A1g 型[9 ,24 ,39 ] ;石墨化程度较低时,由于晶格缺陷较多,光谱会表现出较多的缺陷锋,如频移在1 620 cm-1 (D2)、1 510 cm-1 (D3)和1 245 cm-1 (D4)的谱峰[9 ,25 ,39 ,44 ,45 ,46 ,47 ] (图1 a). ...
... ,39 ];石墨化程度较低时,由于晶格缺陷较多,光谱会表现出较多的缺陷锋,如频移在1 620 cm-1 (D2)、1 510 cm-1 (D3)和1 245 cm-1 (D4)的谱峰[9 ,25 ,39 ,44 ,45 ,46 ,47 ] (图1 a). ...
... ,39 ,44 ,45 ,46 ,47 ](图1 a). ...
Raman spectroscopy of carbon materials: Structural basis of observed spectra
2
1990
... 拉曼散射与物质的成分和结构紧密相关[39 ,40 ,41 ,42 ,43 ] .对于碳质物质,其石墨化程度不同,拉曼光谱特征差异显著[39 ,44 ] :碳质石墨化较高时,碳原子层排列有序,层间间距较小,没有其他原子团,表现为显著的G峰(1 580 cm-1 ),其振动模式为E2g2 型[9 ,24 ,39 ] ;而在晶格结构有限的情况下,石墨碳层边界缺陷会导致形成D1缺陷峰(1 350 cm-1 ),振动模式为A1g 型[9 ,24 ,39 ] ;石墨化程度较低时,由于晶格缺陷较多,光谱会表现出较多的缺陷锋,如频移在1 620 cm-1 (D2)、1 510 cm-1 (D3)和1 245 cm-1 (D4)的谱峰[9 ,25 ,39 ,44 ,45 ,46 ,47 ] (图1 a). ...
... 前人研究发现,使用不同波长的激光(光子能量不同),相同样品得到的光谱结果有显著差异,主要体现为光谱形态与谱峰位置[40 ,65 ,66 ] .如图7 所示,随着激光波长逐渐增大,缺陷峰(D1峰)信号增强,石墨峰(G峰)信号相对减弱[9 ,66 ] .与此同时,缺陷峰频移增大,而石墨峰频移基本不变[46 ] . ...
Raman spectra of graphite as indicators of degree of metamorphism
1
1991
... 拉曼散射与物质的成分和结构紧密相关[39 ,40 ,41 ,42 ,43 ] .对于碳质物质,其石墨化程度不同,拉曼光谱特征差异显著[39 ,44 ] :碳质石墨化较高时,碳原子层排列有序,层间间距较小,没有其他原子团,表现为显著的G峰(1 580 cm-1 ),其振动模式为E2g2 型[9 ,24 ,39 ] ;而在晶格结构有限的情况下,石墨碳层边界缺陷会导致形成D1缺陷峰(1 350 cm-1 ),振动模式为A1g 型[9 ,24 ,39 ] ;石墨化程度较低时,由于晶格缺陷较多,光谱会表现出较多的缺陷锋,如频移在1 620 cm-1 (D2)、1 510 cm-1 (D3)和1 245 cm-1 (D4)的谱峰[9 ,25 ,39 ,44 ,45 ,46 ,47 ] (图1 a). ...
Structural characterization of kerogens to granulite-facies graphite: Applicability of raman microprobe spectroscopy
1
1993
... 拉曼散射与物质的成分和结构紧密相关[39 ,40 ,41 ,42 ,43 ] .对于碳质物质,其石墨化程度不同,拉曼光谱特征差异显著[39 ,44 ] :碳质石墨化较高时,碳原子层排列有序,层间间距较小,没有其他原子团,表现为显著的G峰(1 580 cm-1 ),其振动模式为E2g2 型[9 ,24 ,39 ] ;而在晶格结构有限的情况下,石墨碳层边界缺陷会导致形成D1缺陷峰(1 350 cm-1 ),振动模式为A1g 型[9 ,24 ,39 ] ;石墨化程度较低时,由于晶格缺陷较多,光谱会表现出较多的缺陷锋,如频移在1 620 cm-1 (D2)、1 510 cm-1 (D3)和1 245 cm-1 (D4)的谱峰[9 ,25 ,39 ,44 ,45 ,46 ,47 ] (图1 a). ...
Raman microspectroscopy of soot and related carbonaceous materials: Spectral analysis and structural information
1
2005
... 拉曼散射与物质的成分和结构紧密相关[39 ,40 ,41 ,42 ,43 ] .对于碳质物质,其石墨化程度不同,拉曼光谱特征差异显著[39 ,44 ] :碳质石墨化较高时,碳原子层排列有序,层间间距较小,没有其他原子团,表现为显著的G峰(1 580 cm-1 ),其振动模式为E2g2 型[9 ,24 ,39 ] ;而在晶格结构有限的情况下,石墨碳层边界缺陷会导致形成D1缺陷峰(1 350 cm-1 ),振动模式为A1g 型[9 ,24 ,39 ] ;石墨化程度较低时,由于晶格缺陷较多,光谱会表现出较多的缺陷锋,如频移在1 620 cm-1 (D2)、1 510 cm-1 (D3)和1 245 cm-1 (D4)的谱峰[9 ,25 ,39 ,44 ,45 ,46 ,47 ] (图1 a). ...
Raman spectroscopy of selected carbonaceous samples
2
2010
... 拉曼散射与物质的成分和结构紧密相关[39 ,40 ,41 ,42 ,43 ] .对于碳质物质,其石墨化程度不同,拉曼光谱特征差异显著[39 ,44 ] :碳质石墨化较高时,碳原子层排列有序,层间间距较小,没有其他原子团,表现为显著的G峰(1 580 cm-1 ),其振动模式为E2g2 型[9 ,24 ,39 ] ;而在晶格结构有限的情况下,石墨碳层边界缺陷会导致形成D1缺陷峰(1 350 cm-1 ),振动模式为A1g 型[9 ,24 ,39 ] ;石墨化程度较低时,由于晶格缺陷较多,光谱会表现出较多的缺陷锋,如频移在1 620 cm-1 (D2)、1 510 cm-1 (D3)和1 245 cm-1 (D4)的谱峰[9 ,25 ,39 ,44 ,45 ,46 ,47 ] (图1 a). ...
... ,44 ,45 ,46 ,47 ](图1 a). ...
Studying disorder in graphite-based systems by raman spectroscopy
1
2007
... 拉曼散射与物质的成分和结构紧密相关[39 ,40 ,41 ,42 ,43 ] .对于碳质物质,其石墨化程度不同,拉曼光谱特征差异显著[39 ,44 ] :碳质石墨化较高时,碳原子层排列有序,层间间距较小,没有其他原子团,表现为显著的G峰(1 580 cm-1 ),其振动模式为E2g2 型[9 ,24 ,39 ] ;而在晶格结构有限的情况下,石墨碳层边界缺陷会导致形成D1缺陷峰(1 350 cm-1 ),振动模式为A1g 型[9 ,24 ,39 ] ;石墨化程度较低时,由于晶格缺陷较多,光谱会表现出较多的缺陷锋,如频移在1 620 cm-1 (D2)、1 510 cm-1 (D3)和1 245 cm-1 (D4)的谱峰[9 ,25 ,39 ,44 ,45 ,46 ,47 ] (图1 a). ...
Defect characterization in graphene and carbon nanotubes using raman spectroscopy
2
2010
... 拉曼散射与物质的成分和结构紧密相关[39 ,40 ,41 ,42 ,43 ] .对于碳质物质,其石墨化程度不同,拉曼光谱特征差异显著[39 ,44 ] :碳质石墨化较高时,碳原子层排列有序,层间间距较小,没有其他原子团,表现为显著的G峰(1 580 cm-1 ),其振动模式为E2g2 型[9 ,24 ,39 ] ;而在晶格结构有限的情况下,石墨碳层边界缺陷会导致形成D1缺陷峰(1 350 cm-1 ),振动模式为A1g 型[9 ,24 ,39 ] ;石墨化程度较低时,由于晶格缺陷较多,光谱会表现出较多的缺陷锋,如频移在1 620 cm-1 (D2)、1 510 cm-1 (D3)和1 245 cm-1 (D4)的谱峰[9 ,25 ,39 ,44 ,45 ,46 ,47 ] (图1 a). ...
... 前人研究发现,使用不同波长的激光(光子能量不同),相同样品得到的光谱结果有显著差异,主要体现为光谱形态与谱峰位置[40 ,65 ,66 ] .如图7 所示,随着激光波长逐渐增大,缺陷峰(D1峰)信号增强,石墨峰(G峰)信号相对减弱[9 ,66 ] .与此同时,缺陷峰频移增大,而石墨峰频移基本不变[46 ] . ...
Raman spectroscopic characterization of some commercially available carbon black materials
1
1995
... 拉曼散射与物质的成分和结构紧密相关[39 ,40 ,41 ,42 ,43 ] .对于碳质物质,其石墨化程度不同,拉曼光谱特征差异显著[39 ,44 ] :碳质石墨化较高时,碳原子层排列有序,层间间距较小,没有其他原子团,表现为显著的G峰(1 580 cm-1 ),其振动模式为E2g2 型[9 ,24 ,39 ] ;而在晶格结构有限的情况下,石墨碳层边界缺陷会导致形成D1缺陷峰(1 350 cm-1 ),振动模式为A1g 型[9 ,24 ,39 ] ;石墨化程度较低时,由于晶格缺陷较多,光谱会表现出较多的缺陷锋,如频移在1 620 cm-1 (D2)、1 510 cm-1 (D3)和1 245 cm-1 (D4)的谱峰[9 ,25 ,39 ,44 ,45 ,46 ,47 ] (图1 a). ...
Contrasting degrees of recrystallization of carbonaceous material in the Nelson aureole, British Columbia and Ballachulish aureole, Scotland, with implications for thermometry based on raman spectroscopy of carbonaceous material
1
2019
... 作者使用Peakfit4.12和Fityk软件[48 ,49 ] 进行分峰拟合.Fityk软件有着较为友好的操作界面,分峰拟合过程快捷,同时也可以实现多条光谱的形态对比;对于峰期变质温度在350 ℃以上的样品,由于缺陷峰信号较弱,使用两种软件拟合的结果差别不大;当峰期变质温度较低时(小于约350 ℃),由于缺陷峰较多且荧光背景较强,使用Peakfit4.12软件进行分峰拟合的效果更好. ...
Fityk: A general-purpose peak fitting program
2
2010
... 作者使用Peakfit4.12和Fityk软件[48 ,49 ] 进行分峰拟合.Fityk软件有着较为友好的操作界面,分峰拟合过程快捷,同时也可以实现多条光谱的形态对比;对于峰期变质温度在350 ℃以上的样品,由于缺陷峰信号较弱,使用两种软件拟合的结果差别不大;当峰期变质温度较低时(小于约350 ℃),由于缺陷峰较多且荧光背景较强,使用Peakfit4.12软件进行分峰拟合的效果更好. ...
... 在油气地质学领域,镜质体反射率是反映有机质热演化成熟度比较通用的指标,是进行有机质生油阶段(温度小于约250 ℃)划分的标尺[91 ,92 ] .而在更高的有机质成熟阶段,镜质体反射率指标敏感度降低[92 ,93 ] ,同时有些样品可能不含镜质体[28 ] ,为了完善有机质成熟度的判断方法,诸多学者尝试利用有机质拉曼光谱分析进行成熟度评价:Kelemen等[93 ] 发现随成熟度增加,拉曼谱峰中D峰与G峰面积比值减小;刘德汉等[94 ] 利用不同热演化程度的样品,得出适用于高成熟度样品的成熟度计算经验公式;Wilkins等[95 ,96 ] 也根据不同热演化程度煤的拉曼光谱特征建立了有机质成熟度的计算方法;王民等[97 ] 在Wilkins等[95 ,96 ] 的工作基础上建立了一种镜质组随机反射率(Rr )在0.4%~2.5%范围内的有机质热成熟度评价的拉曼模型;张聪等[98 ] 结合样品扫描电镜分析结果,验证了拉曼光谱技术是测定高成熟度有机质的一种行之有效的手段.这些研究表明了有机质激光拉曼再判断有机质成熟度方面的潜力,尤其是镜质体缺失或镜质体反射率受到抑制或识别困难的沉积岩中具有广阔的应用前景[97 ] .在其他地球科学领域,也有石墨化碳质物质拉曼光谱温度计的应用方向:如探究岩浆侵入所伴随的热效应[19 ,49 ] ,球粒陨石的热演化[7 ] ,示踪沉积物源区与碳质物质经历的沉积循环[99 ,100 ,101 ,102 ] ,有机质矿化过程中的变质温度[2 ] ,造山带剥蚀过程[84 ,85 ] 等. ...
Paleoproterozoic UHT metamorphism in the Daqingshan Terrane, North China Craton: New constraints from phase equilibria modeling and SIMS U-Pb zircon dating
1
2017
... 经历不同峰期变质温度的碳质物质在拉曼光谱形态上有显著差异,如图1 b所示,变质温度较低的断层泥样品(来自龙门山映秀断裂带)含有较多信号较强的缺陷峰,G峰与D2峰难以区分;松潘—甘孜复理石样品缺陷峰主要为D1与D2,且D2峰与G峰信号强度相似;龙门山志留纪云母片岩样品石墨G峰较为明显,含有D1峰和微弱的D2峰;胶北矽线石榴片麻岩中的石墨一般仅有G峰,缺陷峰极其微弱或缺失.值得一提的是根据石墨拉曼光谱所计算得到的胶北矽线石榴片麻岩峰期变质温度为650~700 ℃(具体方法见下文),低于前人根据矿物组合的估算(最低860 ℃)[50 ,51 ,52 ,53 ] . ...
Short-lived High-temperature Prograde and Retrograde Metamorphism in Shaerqin Sapphirine-bearing metapelites from the Daqingshan Terrane, North China Craton
1
2015
... 经历不同峰期变质温度的碳质物质在拉曼光谱形态上有显著差异,如图1 b所示,变质温度较低的断层泥样品(来自龙门山映秀断裂带)含有较多信号较强的缺陷峰,G峰与D2峰难以区分;松潘—甘孜复理石样品缺陷峰主要为D1与D2,且D2峰与G峰信号强度相似;龙门山志留纪云母片岩样品石墨G峰较为明显,含有D1峰和微弱的D2峰;胶北矽线石榴片麻岩中的石墨一般仅有G峰,缺陷峰极其微弱或缺失.值得一提的是根据石墨拉曼光谱所计算得到的胶北矽线石榴片麻岩峰期变质温度为650~700 ℃(具体方法见下文),低于前人根据矿物组合的估算(最低860 ℃)[50 ,51 ,52 ,53 ] . ...
Paleoproterozoic granulites from Heling'er: Implications for regional ultrahigh-temperature metamorphism in the North China Craton
1
2012
... 经历不同峰期变质温度的碳质物质在拉曼光谱形态上有显著差异,如图1 b所示,变质温度较低的断层泥样品(来自龙门山映秀断裂带)含有较多信号较强的缺陷峰,G峰与D2峰难以区分;松潘—甘孜复理石样品缺陷峰主要为D1与D2,且D2峰与G峰信号强度相似;龙门山志留纪云母片岩样品石墨G峰较为明显,含有D1峰和微弱的D2峰;胶北矽线石榴片麻岩中的石墨一般仅有G峰,缺陷峰极其微弱或缺失.值得一提的是根据石墨拉曼光谱所计算得到的胶北矽线石榴片麻岩峰期变质温度为650~700 ℃(具体方法见下文),低于前人根据矿物组合的估算(最低860 ℃)[50 ,51 ,52 ,53 ] . ...
UHT sapphirine granulite metamorphism at 1.93-1.92 Ga caused by gabbronorite intrusions: Implications for tectonic evolution of the northern margin of the North China Craton
1
2012
... 经历不同峰期变质温度的碳质物质在拉曼光谱形态上有显著差异,如图1 b所示,变质温度较低的断层泥样品(来自龙门山映秀断裂带)含有较多信号较强的缺陷峰,G峰与D2峰难以区分;松潘—甘孜复理石样品缺陷峰主要为D1与D2,且D2峰与G峰信号强度相似;龙门山志留纪云母片岩样品石墨G峰较为明显,含有D1峰和微弱的D2峰;胶北矽线石榴片麻岩中的石墨一般仅有G峰,缺陷峰极其微弱或缺失.值得一提的是根据石墨拉曼光谱所计算得到的胶北矽线石榴片麻岩峰期变质温度为650~700 ℃(具体方法见下文),低于前人根据矿物组合的估算(最低860 ℃)[50 ,51 ,52 ,53 ] . ...
In situ analysis in geological thin-sections by laser raman microprobe spectroscopy: A cautionary note
2
1989
... 石墨为六方晶系片状矿物,具有显著的各向异性,与激光偏振一同造成了在不同晶轴方向上石墨拉曼光谱特征的细微差异,这一直是该温度计研究的难点[19 ,54 ,55 ,56 ] .Tan等[57 ] 曾用结晶完整的石墨对此问题进行了深入研究,并结合不同波长的激光进行对比(图5 ),结果显示:波长为514.5 nm的激光在照射石墨晶体平面时未出现明显的缺陷峰(D1峰与D2峰),而当激光偏振方向平行于石墨层时,出现缺陷峰.与此同时,随激光波长加大,缺陷峰强度增加. ...
... 石墨化碳质物质硬度较低,在薄片制作时,抛光的过程可能会产生更多的损伤,而影响拉曼测试结果[9 ] .Pasteris[54 ] 指出抛光后样品D峰的信号有一定增强(图9 ).Beyssac等[58 ] 通过对比研究了被抛光的石墨与透明矿物下方未受抛光影响的石墨的拉曼光谱,发现前者出现显著的D峰,这会极大影响温度的计算.此外,Wang等[55 ] 和Mostefaoui等[72 ] 也就石墨抛光对拉曼测试结果的影响进行了一系列研究,确认了抛光造成的结构损伤对测试结果有影响. ...
Characterization of graphite alteration in an uranium deposit by micro-raman spectroscopy, X-ray diffraction, transmission electron microscopy and scanning electron microscopy
2
1989
... 石墨为六方晶系片状矿物,具有显著的各向异性,与激光偏振一同造成了在不同晶轴方向上石墨拉曼光谱特征的细微差异,这一直是该温度计研究的难点[19 ,54 ,55 ,56 ] .Tan等[57 ] 曾用结晶完整的石墨对此问题进行了深入研究,并结合不同波长的激光进行对比(图5 ),结果显示:波长为514.5 nm的激光在照射石墨晶体平面时未出现明显的缺陷峰(D1峰与D2峰),而当激光偏振方向平行于石墨层时,出现缺陷峰.与此同时,随激光波长加大,缺陷峰强度增加. ...
... 石墨化碳质物质硬度较低,在薄片制作时,抛光的过程可能会产生更多的损伤,而影响拉曼测试结果[9 ] .Pasteris[54 ] 指出抛光后样品D峰的信号有一定增强(图9 ).Beyssac等[58 ] 通过对比研究了被抛光的石墨与透明矿物下方未受抛光影响的石墨的拉曼光谱,发现前者出现显著的D峰,这会极大影响温度的计算.此外,Wang等[55 ] 和Mostefaoui等[72 ] 也就石墨抛光对拉曼测试结果的影响进行了一系列研究,确认了抛光造成的结构损伤对测试结果有影响. ...
On the characterization of disordered and heterogeneous carbonaceous materials by raman spectroscopy
2
2003
... 石墨为六方晶系片状矿物,具有显著的各向异性,与激光偏振一同造成了在不同晶轴方向上石墨拉曼光谱特征的细微差异,这一直是该温度计研究的难点[19 ,54 ,55 ,56 ] .Tan等[57 ] 曾用结晶完整的石墨对此问题进行了深入研究,并结合不同波长的激光进行对比(图5 ),结果显示:波长为514.5 nm的激光在照射石墨晶体平面时未出现明显的缺陷峰(D1峰与D2峰),而当激光偏振方向平行于石墨层时,出现缺陷峰.与此同时,随激光波长加大,缺陷峰强度增加. ...
... 为避免上述抛光造成的影响,测试时应尽量选择透明矿物下或粒状矿物旁的石墨,这两种环境的石墨因受上覆或附近较坚硬矿物的保护,晶体结构基本不受抛光影响,同时石英等透明矿物的谱峰位置与石墨不同,对石墨光谱信号没有影响,因此可提供较可靠的测试谱图[56 ] . ...
Raman scattering of non-planar graphite: Arched edges, polyhedral crystals, whiskers and cones
4
2004
... 石墨为六方晶系片状矿物,具有显著的各向异性,与激光偏振一同造成了在不同晶轴方向上石墨拉曼光谱特征的细微差异,这一直是该温度计研究的难点[19 ,54 ,55 ,56 ] .Tan等[57 ] 曾用结晶完整的石墨对此问题进行了深入研究,并结合不同波长的激光进行对比(图5 ),结果显示:波长为514.5 nm的激光在照射石墨晶体平面时未出现明显的缺陷峰(D1峰与D2峰),而当激光偏振方向平行于石墨层时,出现缺陷峰.与此同时,随激光波长加大,缺陷峰强度增加. ...
... 石墨拉曼光谱各向异性分析图(据参考文献[
57 ]修改)
由上至下为在石墨不同晶轴方向上的测试结果;由左至右为使用不同波长激光的分析结果,右下角双向箭头为激光偏振方向 ...
... 由上至下为在石墨不同晶轴方向上的测试结果;由左至右为使用不同波长激光的分析结果,右下角双向箭头为激光偏振方向
Raman spectra of graphite anisotropy (modified after reference [<xref ref-type="bibr" rid="R57">57</xref>]) From top to bottom are the Raman spectra of graphite in different crystal axis directions; From left to right are the analysis results using lasers with different wavelengths. The double-headed arrows in the lower right corner of the panels mark the laser polarization direction ...
... 除降低激光能量外,也可选择透明矿物下的石墨进行测试(图1 ),上覆矿物能够有效吸收激光照射产生的热量,可显著降低热效应的影响[57 ] . ...
Graphitization in a high-pressure, low-temperature metamorphic gradient: A Raman microspectroscopy and HRTEM study
4
2002
... 透射电镜分析显示碳质物质的非均质性普遍存在[58 ,59 ,60 ,61 ] .如图6 所示为非均质碳质物质在透射电镜下呈现不同有序度的洋葱状结构和显微气孔结构[59 ] .此外,也有学者使用扫描透视X射线显微镜(Scanning Transmission X-ray Microscopy, STXM)对碳质物质的结构进行分析,得到了类似结果[62 ,63 ] .引起石墨非均质性的原因可能是局部化学成分的不均一或碳原子在不同晶轴方向上的杂乱排列,即结晶程度较低[64 ] .碳质物质的非均质性是影响温度计算结果的重要因素之一,多点测试(大于25个)是减小该影响的有效途径[19 ] . ...
... 碳质物质高分辨率透射电镜显微形貌照片(据参考文献[
58 ]修改)
(a)002晶面:可见到洋葱式结构,外圈比内圈有序度要高;(b)002晶面:有序度小于(a),发育显微气孔结构,不同区域有序度不同;(a)和(b)来自同一个样品的不同位置 ...
... (a)002晶面:可见到洋葱式结构,外圈比内圈有序度要高;(b)002晶面:有序度小于(a),发育显微气孔结构,不同区域有序度不同;(a)和(b)来自同一个样品的不同位置
HRTEM pictures from carbonaceous material (modified after reference [<xref ref-type="bibr" rid="R58">58</xref>]) (a) 002 lattice fringes image showing onion ring microtextures, the core is poorly organized in comparison with the outer part; (b) 002 lattice fringes image of microporous poorly organized carbonaceous material. The two pictures are taken from different locations of the same sample ...
... 石墨化碳质物质硬度较低,在薄片制作时,抛光的过程可能会产生更多的损伤,而影响拉曼测试结果[9 ] .Pasteris[54 ] 指出抛光后样品D峰的信号有一定增强(图9 ).Beyssac等[58 ] 通过对比研究了被抛光的石墨与透明矿物下方未受抛光影响的石墨的拉曼光谱,发现前者出现显著的D峰,这会极大影响温度的计算.此外,Wang等[55 ] 和Mostefaoui等[72 ] 也就石墨抛光对拉曼测试结果的影响进行了一系列研究,确认了抛光造成的结构损伤对测试结果有影响. ...
Mineral-templated growth of natural graphite films
2
2012
... 透射电镜分析显示碳质物质的非均质性普遍存在[58 ,59 ,60 ,61 ] .如图6 所示为非均质碳质物质在透射电镜下呈现不同有序度的洋葱状结构和显微气孔结构[59 ] .此外,也有学者使用扫描透视X射线显微镜(Scanning Transmission X-ray Microscopy, STXM)对碳质物质的结构进行分析,得到了类似结果[62 ,63 ] .引起石墨非均质性的原因可能是局部化学成分的不均一或碳原子在不同晶轴方向上的杂乱排列,即结晶程度较低[64 ] .碳质物质的非均质性是影响温度计算结果的重要因素之一,多点测试(大于25个)是减小该影响的有效途径[19 ] . ...
... [59 ].此外,也有学者使用扫描透视X射线显微镜(Scanning Transmission X-ray Microscopy, STXM)对碳质物质的结构进行分析,得到了类似结果[62 ,63 ] .引起石墨非均质性的原因可能是局部化学成分的不均一或碳原子在不同晶轴方向上的杂乱排列,即结晶程度较低[64 ] .碳质物质的非均质性是影响温度计算结果的重要因素之一,多点测试(大于25个)是减小该影响的有效途径[19 ] . ...
From organic matter to graphite: Graphitization
1
2014
... 透射电镜分析显示碳质物质的非均质性普遍存在[58 ,59 ,60 ,61 ] .如图6 所示为非均质碳质物质在透射电镜下呈现不同有序度的洋葱状结构和显微气孔结构[59 ] .此外,也有学者使用扫描透视X射线显微镜(Scanning Transmission X-ray Microscopy, STXM)对碳质物质的结构进行分析,得到了类似结果[62 ,63 ] .引起石墨非均质性的原因可能是局部化学成分的不均一或碳原子在不同晶轴方向上的杂乱排列,即结晶程度较低[64 ] .碳质物质的非均质性是影响温度计算结果的重要因素之一,多点测试(大于25个)是减小该影响的有效途径[19 ] . ...
Raman spectra of graphite edge planes
1
1988
... 透射电镜分析显示碳质物质的非均质性普遍存在[58 ,59 ,60 ,61 ] .如图6 所示为非均质碳质物质在透射电镜下呈现不同有序度的洋葱状结构和显微气孔结构[59 ] .此外,也有学者使用扫描透视X射线显微镜(Scanning Transmission X-ray Microscopy, STXM)对碳质物质的结构进行分析,得到了类似结果[62 ,63 ] .引起石墨非均质性的原因可能是局部化学成分的不均一或碳原子在不同晶轴方向上的杂乱排列,即结晶程度较低[64 ] .碳质物质的非均质性是影响温度计算结果的重要因素之一,多点测试(大于25个)是减小该影响的有效途径[19 ] . ...
Exceptional preservation of fossil plant spores in high-pressure metamorphic rocks
1
2007
... 透射电镜分析显示碳质物质的非均质性普遍存在[58 ,59 ,60 ,61 ] .如图6 所示为非均质碳质物质在透射电镜下呈现不同有序度的洋葱状结构和显微气孔结构[59 ] .此外,也有学者使用扫描透视X射线显微镜(Scanning Transmission X-ray Microscopy, STXM)对碳质物质的结构进行分析,得到了类似结果[62 ,63 ] .引起石墨非均质性的原因可能是局部化学成分的不均一或碳原子在不同晶轴方向上的杂乱排列,即结晶程度较低[64 ] .碳质物质的非均质性是影响温度计算结果的重要因素之一,多点测试(大于25个)是减小该影响的有效途径[19 ] . ...
Raman mapping using advanced line-scanning systems: Geological applications
1
2008
... 透射电镜分析显示碳质物质的非均质性普遍存在[58 ,59 ,60 ,61 ] .如图6 所示为非均质碳质物质在透射电镜下呈现不同有序度的洋葱状结构和显微气孔结构[59 ] .此外,也有学者使用扫描透视X射线显微镜(Scanning Transmission X-ray Microscopy, STXM)对碳质物质的结构进行分析,得到了类似结果[62 ,63 ] .引起石墨非均质性的原因可能是局部化学成分的不均一或碳原子在不同晶轴方向上的杂乱排列,即结晶程度较低[64 ] .碳质物质的非均质性是影响温度计算结果的重要因素之一,多点测试(大于25个)是减小该影响的有效途径[19 ] . ...
XANES, Raman and XRD study of anthracene-based cokes and saccharose-based chars submitted to high-temperature pyrolysis
1
2010
... 透射电镜分析显示碳质物质的非均质性普遍存在[58 ,59 ,60 ,61 ] .如图6 所示为非均质碳质物质在透射电镜下呈现不同有序度的洋葱状结构和显微气孔结构[59 ] .此外,也有学者使用扫描透视X射线显微镜(Scanning Transmission X-ray Microscopy, STXM)对碳质物质的结构进行分析,得到了类似结果[62 ,63 ] .引起石墨非均质性的原因可能是局部化学成分的不均一或碳原子在不同晶轴方向上的杂乱排列,即结晶程度较低[64 ] .碳质物质的非均质性是影响温度计算结果的重要因素之一,多点测试(大于25个)是减小该影响的有效途径[19 ] . ...
General equation for the determination of the crystallite size La of nanographite by raman spectroscopy
1
2006
... 前人研究发现,使用不同波长的激光(光子能量不同),相同样品得到的光谱结果有显著差异,主要体现为光谱形态与谱峰位置[40 ,65 ,66 ] .如图7 所示,随着激光波长逐渐增大,缺陷峰(D1峰)信号增强,石墨峰(G峰)信号相对减弱[9 ,66 ] .与此同时,缺陷峰频移增大,而石墨峰频移基本不变[46 ] . ...
Observation of raman band shifting with excitation wavelength for carbons and graphites
2
1981
... 前人研究发现,使用不同波长的激光(光子能量不同),相同样品得到的光谱结果有显著差异,主要体现为光谱形态与谱峰位置[40 ,65 ,66 ] .如图7 所示,随着激光波长逐渐增大,缺陷峰(D1峰)信号增强,石墨峰(G峰)信号相对减弱[9 ,66 ] .与此同时,缺陷峰频移增大,而石墨峰频移基本不变[46 ] . ...
... ,66 ].与此同时,缺陷峰频移增大,而石墨峰频移基本不变[46 ] . ...
D-band raman intensity of graphitic materials as a function of laser energy and crystallite size
2
2006
... 前人研究发现,使用不同波长的激光(光子能量不同),相同样品得到的光谱结果有显著差异,主要体现为光谱形态与谱峰位置
[40 ,65 ,66 ] .如
图7 所示,随着激光波长逐渐增大,缺陷峰(D1峰)信号增强,石墨峰(G峰)信号相对减弱
[9 ,66 ] .与此同时,缺陷峰频移增大,而石墨峰频移基本不变
[46 ] .
图7 激光波长对碳质拉曼光谱的影响(据参考文献[<xref ref-type="bibr" rid="R67">67</xref>]修改) 随波长增加,石墨峰(G峰)频移基本不变,缺陷峰(D1峰)频移增大,同时石墨峰信号相对于缺陷峰减弱 ...
... 随波长增加,石墨峰(G峰)频移基本不变,缺陷峰(D1峰)频移增大,同时石墨峰信号相对于缺陷峰减弱
Effect of laser wavelength on Raman spectroscopy of carbonaceous material (modified after reference [<xref ref-type="bibr" rid="R67">67</xref>]) With an increasing laser wavelength, the Raman shift of the G-band is relatively stable; The Raman shift of the D1-band increases; The ...
Maturation grade of coals as revealed by Raman spectroscopy: Progress and problems
1
2005
... 激光照射会使石墨化碳质物质受热发生热氧化,进而影响拉曼测试结果[68 ] .这种现象的主要表现形式是碳质物质表面被烧蚀,且谱峰强度与位置发生改变[69 ] (图8 ).据前人研究,激光能量过强会使G峰频移减小,D峰强度降低[70 ,71 ] .因此在测试时需控制测试激光能量,对于直径1 μm的测试光斑,激光输出能量不宜超过1 mW[35 ] . ...
Assessing low-maturity organic matter in shales using Raman spectroscopy: Effects of sample preparation and operating procedure
3
2018
... 激光照射会使石墨化碳质物质受热发生热氧化,进而影响拉曼测试结果[68 ] .这种现象的主要表现形式是碳质物质表面被烧蚀,且谱峰强度与位置发生改变[69 ] (图8 ).据前人研究,激光能量过强会使G峰频移减小,D峰强度降低[70 ,71 ] .因此在测试时需控制测试激光能量,对于直径1 μm的测试光斑,激光输出能量不宜超过1 mW[35 ] . ...
... )(据参考文献[
69 ]修改)
<strong>Images of carbonaceous material before</strong>(<strong>a</strong>)<strong>and after Raman spectroscopy analysis using different laser energy</strong>(<strong>b~e</strong>),<strong>and the corresponding Raman spectra</strong>(<strong>f</strong>)(<strong>modified after reference</strong>[<xref ref-type="bibr" rid="R69">69</xref>]) Fig.8 ![]()
除降低激光能量外,也可选择透明矿物下的石墨进行测试(图1 ),上覆矿物能够有效吸收激光照射产生的热量,可显著降低热效应的影响[57 ] . ...
... [
69 ])
Fig.8 ![]()
除降低激光能量外,也可选择透明矿物下的石墨进行测试(图1 ),上覆矿物能够有效吸收激光照射产生的热量,可显著降低热效应的影响[57 ] . ...
The effect of laser-induced heating upon the vibrational raman spectra of graphites and carbon fibers
1
1991
... 激光照射会使石墨化碳质物质受热发生热氧化,进而影响拉曼测试结果[68 ] .这种现象的主要表现形式是碳质物质表面被烧蚀,且谱峰强度与位置发生改变[69 ] (图8 ).据前人研究,激光能量过强会使G峰频移减小,D峰强度降低[70 ,71 ] .因此在测试时需控制测试激光能量,对于直径1 μm的测试光斑,激光输出能量不宜超过1 mW[35 ] . ...
Proper understanding of down-shifted Raman spectra of natural graphite: Direct estimation of baser-induced rise in sample temperature
1
1994
... 激光照射会使石墨化碳质物质受热发生热氧化,进而影响拉曼测试结果[68 ] .这种现象的主要表现形式是碳质物质表面被烧蚀,且谱峰强度与位置发生改变[69 ] (图8 ).据前人研究,激光能量过强会使G峰频移减小,D峰强度降低[70 ,71 ] .因此在测试时需控制测试激光能量,对于直径1 μm的测试光斑,激光输出能量不宜超过1 mW[35 ] . ...
Metal-associated carbon in primitive chondrites: Structure, isotopic composition, and origin
2
2000
... 石墨化碳质物质硬度较低,在薄片制作时,抛光的过程可能会产生更多的损伤,而影响拉曼测试结果[9 ] .Pasteris[54 ] 指出抛光后样品D峰的信号有一定增强(图9 ).Beyssac等[58 ] 通过对比研究了被抛光的石墨与透明矿物下方未受抛光影响的石墨的拉曼光谱,发现前者出现显著的D峰,这会极大影响温度的计算.此外,Wang等[55 ] 和Mostefaoui等[72 ] 也就石墨抛光对拉曼测试结果的影响进行了一系列研究,确认了抛光造成的结构损伤对测试结果有影响. ...
... ,
72 ]修改)
(a)显微镜下石墨照片,部分石墨直被抛光暴露(黑色点标注的透射光下的不透明、反射光下灰白色强反射的区域),部分处于透明矿物之下(白点所标注的反射光下的较虚的灰白色区域);(b)抛光暴露的与透明矿物下的石墨拉曼光谱测试结果 ...
Raman spectroscopy: Caution when interpreting organic carbon from oxidising environments
4
2016
... 样品风化氧化会产生赤铁矿,其拉曼谱峰(1 320 cm-1 )与石墨D1峰(1 350 cm-1 )位置接近(图10 a),会直接影响碳质拉曼光谱的测量[73 ] .在氧化样品中,由于赤铁矿谱峰影响会产生虚假的强D1缺陷峰,进而使温度计算参数R 1与R 1值[公式(1)和(3)]增大(图10 b).Brolly等[73 ] 使用HF酸对氧化样品进行处理,结果显示,酸处理后样品的R 1与R 2值与未氧化的样品基本相同(图10 b),有效降低了赤铁矿的影响.因此,为保证测试结果的相对准确,采样时应注意选择新鲜样品,或对采集的氧化样品进行HF酸处理[74 ] . ...
... [73 ]使用HF酸对氧化样品进行处理,结果显示,酸处理后样品的R 1与R 2值与未氧化的样品基本相同(图10 b),有效降低了赤铁矿的影响.因此,为保证测试结果的相对准确,采样时应注意选择新鲜样品,或对采集的氧化样品进行HF酸处理[74 ] . ...
... 赤铁矿对拉曼光谱影响(据参考文献[
73 ]修改)
(a)为石墨光谱形态与同频移段内赤铁矿光谱形态,其中赤铁矿谱峰位置为1 320 cm-1 ,与石墨D1缺陷峰位置(1 350 cm-1 )接近,插图为氧化(灰色)与未氧化(黑色)样品的测试谱图,显示氧化样品受赤铁矿谱峰影响而产生虚假的强D1缺陷峰;(b)为是否经HF酸处理的碳质物质R 1与R 2值的变化:未经过HF处理的氧化样品(灰色)R 1与R 2值明显大于未氧化样品(黑色);处理后两类样品基本相同 ...
... (a)为石墨光谱形态与同频移段内赤铁矿光谱形态,其中赤铁矿谱峰位置为1 320 cm
-1 ,与石墨D1缺陷峰位置(1 350 cm
-1 )接近,插图为氧化(灰色)与未氧化(黑色)样品的测试谱图,显示氧化样品受赤铁矿谱峰影响而产生虚假的强D1缺陷峰;(b)为是否经HF酸处理的碳质物质
R 1与
R 2值的变化:未经过HF处理的氧化样品(灰色)
R 1与
R 2值明显大于未氧化样品(黑色);处理后两类样品基本相同
Effect of hematite on Raman Spectra of graphite (modified after reference [<xref ref-type="bibr" rid="R73">73</xref>]) (a) Raman spectra of hematite (grey) and graphite (black). The Raman shift of hematite is located at 1 320 cm-1 , close to D1 band (1 350 cm-1 ) of graphite. The insetted panel shows a comparison of Raman spectra of oxidized (grey) and non-oxidised (black) samples, and the former shows a fake and strong D1 band due to influence of hematite. (b)R 1 andR 2 plots for untreated and HF-treated samples. Blue points indicate non-oxidised samples. Red points indicate oxidised samples. After treatment, the two types of samples yield similarR 1 andR 2 values ...
Thermal metamorphism in the lesser Himalaya of Nepal determined from raman spectroscopy of carbonaceous material
5
2004
... 样品风化氧化会产生赤铁矿,其拉曼谱峰(1 320 cm-1 )与石墨D1峰(1 350 cm-1 )位置接近(图10 a),会直接影响碳质拉曼光谱的测量[73 ] .在氧化样品中,由于赤铁矿谱峰影响会产生虚假的强D1缺陷峰,进而使温度计算参数R 1与R 1值[公式(1)和(3)]增大(图10 b).Brolly等[73 ] 使用HF酸对氧化样品进行处理,结果显示,酸处理后样品的R 1与R 2值与未氧化的样品基本相同(图10 b),有效降低了赤铁矿的影响.因此,为保证测试结果的相对准确,采样时应注意选择新鲜样品,或对采集的氧化样品进行HF酸处理[74 ] . ...
... 造山带中含有大量增生的沉积物,由于变质级别相对较低,往往缺乏特征变质矿物,给增生楔变质—变形研究带来了不便.然而,这类岩石中富含有机质,可利用石墨化碳质物质进行岩石峰期变质温度的测定.前人利用该方法研究了多处造山带的地表热结构与变质—构造演化[74 ,75 ,76 ,77 ] .下面介绍一个关于喜马拉雅构造变形的研究实例(图11 ). ...
... 构造—变质温度剖面(据参考文献[
74 ]修改)
图中给出构造地层的接触关系及一些样品的拉曼测温结果,(a)图为地质图所属地理位置;(b)NE-SW向剖面AA';LH: 低喜马拉雅;MCT:主中央逆冲断层;MBT:主边界逆冲断层;MFT:主前缘逆冲断层 ...
... 图中给出构造地层的接触关系及一些样品的拉曼测温结果,(a)图为地质图所属地理位置;(b)NE-SW向剖面AA';LH: 低喜马拉雅;MCT:主中央逆冲断层;MBT:主边界逆冲断层;MFT:主前缘逆冲断层
Geological map of western Nepal, on which Raman Spectroscopy of Carbonaceous Material (RSCM) thermometer results are compiled, and there also have a NE-SW cross-section A-A' with temperature and main thrusts (modified after reference[<xref ref-type="bibr" rid="R74">74</xref>]) There are major tectonostratigraphic zones and tectonic contacts and some RSCM thermometer results in the map. (a) Location of the studied area at the scale of Nepal. (b) A simplified NE-SW crosssection AAV with temperature and main thrusts. Abbreviation: LH:Lesser Himalaya,MCT:Main Central Thrust,MBT:Main Boundary Thrust,MFT:Main Frontal Thrust ...
... 主中央逆冲断层(Mmain Central Thrust, MCT)是南侧低喜马拉雅与北侧高喜马拉雅结晶杂岩体的分界,据前人研究发现此地有变质温度梯度倒转的现象,但由于缺少特征矿物组合进行温度测定,仅能用矿物等变线或伊利石结晶度进行简单的变质级别划分[78 ,79 ] .为了约束此地区的构造及热演化,Beyssac等[74 ] 使用碳质拉曼温度计对尼泊尔低喜马拉雅带内83个岩石样品进行测试分析(图11 a).该研究在低喜马拉雅(变质温度普遍在375~475 ℃)识别出零星分布的、与高喜马拉雅变质等级(变质温度大于475 ℃)类似的结晶岩系;这说明高喜马拉雅曾通过主中央断裂推覆到低喜马拉雅之上,并经历后期挤压、抬升与剥蚀,形成现今零星分布的飞来峰构造(图11 b). ...
Thermal structure of low-grade accreted Lower Cretaceous distal turbidites, the Central Pontides, Turkey: Insights for tectonic thickening of an accretionary wedge
2
2015
... 造山带中含有大量增生的沉积物,由于变质级别相对较低,往往缺乏特征变质矿物,给增生楔变质—变形研究带来了不便.然而,这类岩石中富含有机质,可利用石墨化碳质物质进行岩石峰期变质温度的测定.前人利用该方法研究了多处造山带的地表热结构与变质—构造演化[74 ,75 ,76 ,77 ] .下面介绍一个关于喜马拉雅构造变形的研究实例(图11 ). ...
... 除了上述地区的研究外,碳质物质拉曼温度计还被广泛应用于其他造山带的研究:如阿尔卑斯(Alps)造山带的变质温度、断层位置、俯冲过程中碳循环、地壳缩短模式[8 ,75 ,77 ,80 ,81 ] ;希腊克里特(Crete)地区拆离断层所引起变质温度突变[21 ] ;爱琴海两侧亚伯兰穹隆构造(Alboran Domain)[82 ] ;意大利阿普亚内山(Alpi Apuane)[83 ] 、中国台湾和日本[19 ,20 ,84 ,85 ] 的构造变形与变质作用. ...
Shortening of the European Dauphinois margin (Oisans Massif, Western Alps): New insights from RSCM maximum temperature estimates and 40Ar/39Ar in situ dating
1
2015
... 造山带中含有大量增生的沉积物,由于变质级别相对较低,往往缺乏特征变质矿物,给增生楔变质—变形研究带来了不便.然而,这类岩石中富含有机质,可利用石墨化碳质物质进行岩石峰期变质温度的测定.前人利用该方法研究了多处造山带的地表热结构与变质—构造演化[74 ,75 ,76 ,77 ] .下面介绍一个关于喜马拉雅构造变形的研究实例(图11 ). ...
Peak metamorphic temperature and thermal history of the Southern Alps (New Zealand)
2
2016
... 造山带中含有大量增生的沉积物,由于变质级别相对较低,往往缺乏特征变质矿物,给增生楔变质—变形研究带来了不便.然而,这类岩石中富含有机质,可利用石墨化碳质物质进行岩石峰期变质温度的测定.前人利用该方法研究了多处造山带的地表热结构与变质—构造演化[74 ,75 ,76 ,77 ] .下面介绍一个关于喜马拉雅构造变形的研究实例(图11 ). ...
... 除了上述地区的研究外,碳质物质拉曼温度计还被广泛应用于其他造山带的研究:如阿尔卑斯(Alps)造山带的变质温度、断层位置、俯冲过程中碳循环、地壳缩短模式[8 ,75 ,77 ,80 ,81 ] ;希腊克里特(Crete)地区拆离断层所引起变质温度突变[21 ] ;爱琴海两侧亚伯兰穹隆构造(Alboran Domain)[82 ] ;意大利阿普亚内山(Alpi Apuane)[83 ] 、中国台湾和日本[19 ,20 ,84 ,85 ] 的构造变形与变质作用. ...
The metamorphism in the Central Himalaya
1
1989
... 主中央逆冲断层(Mmain Central Thrust, MCT)是南侧低喜马拉雅与北侧高喜马拉雅结晶杂岩体的分界,据前人研究发现此地有变质温度梯度倒转的现象,但由于缺少特征矿物组合进行温度测定,仅能用矿物等变线或伊利石结晶度进行简单的变质级别划分[78 ,79 ] .为了约束此地区的构造及热演化,Beyssac等[74 ] 使用碳质拉曼温度计对尼泊尔低喜马拉雅带内83个岩石样品进行测试分析(图11 a).该研究在低喜马拉雅(变质温度普遍在375~475 ℃)识别出零星分布的、与高喜马拉雅变质等级(变质温度大于475 ℃)类似的结晶岩系;这说明高喜马拉雅曾通过主中央断裂推覆到低喜马拉雅之上,并经历后期挤压、抬升与剥蚀,形成现今零星分布的飞来峰构造(图11 b). ...
Tectonic and polymetamorphic history of the Lesser Himalaya in central Nepal
1
2000
... 主中央逆冲断层(Mmain Central Thrust, MCT)是南侧低喜马拉雅与北侧高喜马拉雅结晶杂岩体的分界,据前人研究发现此地有变质温度梯度倒转的现象,但由于缺少特征矿物组合进行温度测定,仅能用矿物等变线或伊利石结晶度进行简单的变质级别划分[78 ,79 ] .为了约束此地区的构造及热演化,Beyssac等[74 ] 使用碳质拉曼温度计对尼泊尔低喜马拉雅带内83个岩石样品进行测试分析(图11 a).该研究在低喜马拉雅(变质温度普遍在375~475 ℃)识别出零星分布的、与高喜马拉雅变质等级(变质温度大于475 ℃)类似的结晶岩系;这说明高喜马拉雅曾通过主中央断裂推覆到低喜马拉雅之上,并经历后期挤压、抬升与剥蚀,形成现今零星分布的飞来峰构造(图11 b). ...
3-D assessment of peak-metamorphic conditions by Raman spectroscopy of carbonaceous material: An example from the margin of the Lepontine dome (Swiss Central Alps)
1
2011
... 除了上述地区的研究外,碳质物质拉曼温度计还被广泛应用于其他造山带的研究:如阿尔卑斯(Alps)造山带的变质温度、断层位置、俯冲过程中碳循环、地壳缩短模式[8 ,75 ,77 ,80 ,81 ] ;希腊克里特(Crete)地区拆离断层所引起变质温度突变[21 ] ;爱琴海两侧亚伯兰穹隆构造(Alboran Domain)[82 ] ;意大利阿普亚内山(Alpi Apuane)[83 ] 、中国台湾和日本[19 ,20 ,84 ,85 ] 的构造变形与变质作用. ...
Graphite formation by carbonate reduction during subduction
1
2013
... 除了上述地区的研究外,碳质物质拉曼温度计还被广泛应用于其他造山带的研究:如阿尔卑斯(Alps)造山带的变质温度、断层位置、俯冲过程中碳循环、地壳缩短模式[8 ,75 ,77 ,80 ,81 ] ;希腊克里特(Crete)地区拆离断层所引起变质温度突变[21 ] ;爱琴海两侧亚伯兰穹隆构造(Alboran Domain)[82 ] ;意大利阿普亚内山(Alpi Apuane)[83 ] 、中国台湾和日本[19 ,20 ,84 ,85 ] 的构造变形与变质作用. ...
Thermal structure of the Alboran Domain in the Rif (northern Morocco) and the Western Betics (southern Spain). Constraints from raman spectroscopy of carbonaceous material
1
2006
... 除了上述地区的研究外,碳质物质拉曼温度计还被广泛应用于其他造山带的研究:如阿尔卑斯(Alps)造山带的变质温度、断层位置、俯冲过程中碳循环、地壳缩短模式[8 ,75 ,77 ,80 ,81 ] ;希腊克里特(Crete)地区拆离断层所引起变质温度突变[21 ] ;爱琴海两侧亚伯兰穹隆构造(Alboran Domain)[82 ] ;意大利阿普亚内山(Alpi Apuane)[83 ] 、中国台湾和日本[19 ,20 ,84 ,85 ] 的构造变形与变质作用. ...
RSCM thermometry in the Alpi Apuane (NW Tuscany, Italy): New constraints for the metamorphic and tectonic history of the inner northern Apennines
1
2018
... 除了上述地区的研究外,碳质物质拉曼温度计还被广泛应用于其他造山带的研究:如阿尔卑斯(Alps)造山带的变质温度、断层位置、俯冲过程中碳循环、地壳缩短模式[8 ,75 ,77 ,80 ,81 ] ;希腊克里特(Crete)地区拆离断层所引起变质温度突变[21 ] ;爱琴海两侧亚伯兰穹隆构造(Alboran Domain)[82 ] ;意大利阿普亚内山(Alpi Apuane)[83 ] 、中国台湾和日本[19 ,20 ,84 ,85 ] 的构造变形与变质作用. ...
Late Cenozoic metamorphic evolution and exhumation of Taiwan
2
2007
... 除了上述地区的研究外,碳质物质拉曼温度计还被广泛应用于其他造山带的研究:如阿尔卑斯(Alps)造山带的变质温度、断层位置、俯冲过程中碳循环、地壳缩短模式[8 ,75 ,77 ,80 ,81 ] ;希腊克里特(Crete)地区拆离断层所引起变质温度突变[21 ] ;爱琴海两侧亚伯兰穹隆构造(Alboran Domain)[82 ] ;意大利阿普亚内山(Alpi Apuane)[83 ] 、中国台湾和日本[19 ,20 ,84 ,85 ] 的构造变形与变质作用. ...
... 在油气地质学领域,镜质体反射率是反映有机质热演化成熟度比较通用的指标,是进行有机质生油阶段(温度小于约250 ℃)划分的标尺[91 ,92 ] .而在更高的有机质成熟阶段,镜质体反射率指标敏感度降低[92 ,93 ] ,同时有些样品可能不含镜质体[28 ] ,为了完善有机质成熟度的判断方法,诸多学者尝试利用有机质拉曼光谱分析进行成熟度评价:Kelemen等[93 ] 发现随成熟度增加,拉曼谱峰中D峰与G峰面积比值减小;刘德汉等[94 ] 利用不同热演化程度的样品,得出适用于高成熟度样品的成熟度计算经验公式;Wilkins等[95 ,96 ] 也根据不同热演化程度煤的拉曼光谱特征建立了有机质成熟度的计算方法;王民等[97 ] 在Wilkins等[95 ,96 ] 的工作基础上建立了一种镜质组随机反射率(Rr )在0.4%~2.5%范围内的有机质热成熟度评价的拉曼模型;张聪等[98 ] 结合样品扫描电镜分析结果,验证了拉曼光谱技术是测定高成熟度有机质的一种行之有效的手段.这些研究表明了有机质激光拉曼再判断有机质成熟度方面的潜力,尤其是镜质体缺失或镜质体反射率受到抑制或识别困难的沉积岩中具有广阔的应用前景[97 ] .在其他地球科学领域,也有石墨化碳质物质拉曼光谱温度计的应用方向:如探究岩浆侵入所伴随的热效应[19 ,49 ] ,球粒陨石的热演化[7 ] ,示踪沉积物源区与碳质物质经历的沉积循环[99 ,100 ,101 ,102 ] ,有机质矿化过程中的变质温度[2 ] ,造山带剥蚀过程[84 ,85 ] 等. ...
Nappe structure revealed by thermal constraints in the Taiwan metamorphic belt
2
2011
... 除了上述地区的研究外,碳质物质拉曼温度计还被广泛应用于其他造山带的研究:如阿尔卑斯(Alps)造山带的变质温度、断层位置、俯冲过程中碳循环、地壳缩短模式[8 ,75 ,77 ,80 ,81 ] ;希腊克里特(Crete)地区拆离断层所引起变质温度突变[21 ] ;爱琴海两侧亚伯兰穹隆构造(Alboran Domain)[82 ] ;意大利阿普亚内山(Alpi Apuane)[83 ] 、中国台湾和日本[19 ,20 ,84 ,85 ] 的构造变形与变质作用. ...
... 在油气地质学领域,镜质体反射率是反映有机质热演化成熟度比较通用的指标,是进行有机质生油阶段(温度小于约250 ℃)划分的标尺[91 ,92 ] .而在更高的有机质成熟阶段,镜质体反射率指标敏感度降低[92 ,93 ] ,同时有些样品可能不含镜质体[28 ] ,为了完善有机质成熟度的判断方法,诸多学者尝试利用有机质拉曼光谱分析进行成熟度评价:Kelemen等[93 ] 发现随成熟度增加,拉曼谱峰中D峰与G峰面积比值减小;刘德汉等[94 ] 利用不同热演化程度的样品,得出适用于高成熟度样品的成熟度计算经验公式;Wilkins等[95 ,96 ] 也根据不同热演化程度煤的拉曼光谱特征建立了有机质成熟度的计算方法;王民等[97 ] 在Wilkins等[95 ,96 ] 的工作基础上建立了一种镜质组随机反射率(Rr )在0.4%~2.5%范围内的有机质热成熟度评价的拉曼模型;张聪等[98 ] 结合样品扫描电镜分析结果,验证了拉曼光谱技术是测定高成熟度有机质的一种行之有效的手段.这些研究表明了有机质激光拉曼再判断有机质成熟度方面的潜力,尤其是镜质体缺失或镜质体反射率受到抑制或识别困难的沉积岩中具有广阔的应用前景[97 ] .在其他地球科学领域,也有石墨化碳质物质拉曼光谱温度计的应用方向:如探究岩浆侵入所伴随的热效应[19 ,49 ] ,球粒陨石的热演化[7 ] ,示踪沉积物源区与碳质物质经历的沉积循环[99 ,100 ,101 ,102 ] ,有机质矿化过程中的变质温度[2 ] ,造山带剥蚀过程[84 ,85 ] 等. ...
Investigation of the records of earthquake slip in carbonaceous materials from the Taiwan Chelungpu fault by means of infrared and Raman spectroscopies
3
2015
... 碳质物质拉曼光谱分析也被应用于地震断层泥的研究.地震具有发育时间短,产热集中的特点,因此断层泥经历的变质过程与传统区域变质作用有较大区别[86 ] .为分析断层滑动过程中摩擦生热对断层泥中碳质物质的影响,诸多学者开展了人工剪切摩擦实验[87 ,88 ] 和天然断层泥碳质物质的拉曼光谱分析[86 ,88 ,89 ,90 ] . ...
... [86 ,88 ,89 ,90 ]. ...
... 也有学者尝试将碳质物质拉曼温度计应用于限定断层滑动的峰值摩擦温度[86 ,89 ] .然而,在低温区域,碳质物质拉曼温度计的精度较低(图4 c),制约了相关研究;另外断层泥中碳质物质经历的变质过程与区域变质或接触变质有显著差别,且断层压力、滑动速率和含水量等因素均会影响断层泥碳质物质拉曼光谱信号,因此,相关的研究需要综合考虑多种影响因素. ...
Vitrinite reflectance and Raman spectra of carbonaceous material as indicators of frictional heating on faults: Constraints from friction experiments
1
2015
... 碳质物质拉曼光谱分析也被应用于地震断层泥的研究.地震具有发育时间短,产热集中的特点,因此断层泥经历的变质过程与传统区域变质作用有较大区别[86 ] .为分析断层滑动过程中摩擦生热对断层泥中碳质物质的影响,诸多学者开展了人工剪切摩擦实验[87 ,88 ] 和天然断层泥碳质物质的拉曼光谱分析[86 ,88 ,89 ,90 ] . ...
Fault gouge graphitization as evidence of past seismic slip
9
2017
... 碳质物质拉曼光谱分析也被应用于地震断层泥的研究.地震具有发育时间短,产热集中的特点,因此断层泥经历的变质过程与传统区域变质作用有较大区别[86 ] .为分析断层滑动过程中摩擦生热对断层泥中碳质物质的影响,诸多学者开展了人工剪切摩擦实验[87 ,88 ] 和天然断层泥碳质物质的拉曼光谱分析[86 ,88 ,89 ,90 ] . ...
... ,88 ,89 ,90 ]. ...
... Kuo等[88 ] 利用剪切摩擦实验研究了断层滑动速率与断层泥含水量对摩擦生热的影响.实验在8.5 MPa的压力下,变量包括等效剪切滑动速率(3与0.0003 m/s)和断层泥含水量(天然样品与添加10%蒸馏水的样品).结果显示:① 图12 a),D1峰频移变化不显著、但G峰频移变大(图12 b);② 图12 a),D1和G峰频移均变的更加集中(图12 b);③ 图12 a),D1和G峰频移均略有增加(图12 b). ...
... 剪切摩擦实验后样品拉曼光谱特征,及其与初始材料的对比(据参考文献[
88 ]修改)
(a) 初始样品与剪切摩擦实验后样品拉曼光谱D1/G峰宽值与D1/G强度值的变化;(b) 经初始样品标准化后的剪切样品D1/G半高宽值与D1与G峰拉曼频移位置 ...
... (a) 初始样品与剪切摩擦实验后样品拉曼光谱D1/G峰宽值与D1/G强度值的变化;(b) 经初始样品标准化后的剪切样品D1/G半高宽值与D1与G峰拉曼频移位置
Raman spectra analyses of gouges sheared in rock friction experiments, and comparison with the initial material (modified after reference [<xref ref-type="bibr" rid="R88">88</xref>]) (a) Defect band to graphite band (D1/G) width versus intensity ratios of samples before and after friction experiments; (b) Plots of D1 and G peak widths of sheared gouges verseus the D1/G width ratio normalized by average starting material ...
... 此外,Kuo等[88 ] 还对映秀断裂断层泥岩芯样品(汶川地震科学钻探1号孔)进行了拉曼光谱分析(图13 ).结果显示,与角砾岩相比,断层泥D1/G强度比值更低,为0.7~0.9(图13 b).同时,断层泥的G峰频移位置明显大于角砾岩,约为1 590 cm-1 (图13 c).结合剪切摩擦实验(图12 ),Kuo等[88 ] 认为在断层泥的碳质物质在断层滑动后主要有以下特点:① ② ③ -1 )(图12 ,13 ).由此可见,断层泥拉曼光谱分析或可为量化断裂地震过程中的流体活动、滑移速率提供一定的约束. ...
... [88 ]认为在断层泥的碳质物质在断层滑动后主要有以下特点:① ② ③ -1 )(图12 ,13 ).由此可见,断层泥拉曼光谱分析或可为量化断裂地震过程中的流体活动、滑移速率提供一定的约束. ...
... 岩芯照片及不同位置拉曼分析结果(据参考文献[
88 ]修改)
(a)龙门山断裂主要岩芯照片;(b)断层泥与角砾岩D1/G峰宽度比值与强度比值对比图;(c) 断层泥与角砾岩G、D1峰宽比及G峰与D1峰拉曼频移位置.插图显示断层泥G峰频移相对角砾岩增大;PSZ: 主滑动区域 ...
... (a)龙门山断裂主要岩芯照片;(b)断层泥与角砾岩D1/G峰宽度比值与强度比值对比图;(c) 断层泥与角砾岩G、D1峰宽比及G峰与D1峰拉曼频移位置.插图显示断层泥G峰频移相对角砾岩增大;PSZ: 主滑动区域
Wenchuan Earthquake Fault Scientific Drilling WFSD-1 borehole core with sample depth locations and results of Raman analyses (modified after reference [<xref ref-type="bibr" rid="R88">88</xref>]) (a) Core images of the WFSD-1 borehole; (b) Defect to graphite band (D1/G) peak width ratio versus D1/G intensity ratio; (c) Ratio of G and D1 peak width of gouge to average breccia peak width versus G band peak position. Inset shows systematic shift toward higher frequencies of G band observed in black gouge with respect to fault breccia; PSZ denotes the Principal Slip Zone ...
Raman spectra of carbonaceous materials in a fault zone in the Longmenshan thrust belt, China; comparisons with those of sedimentary and metamorphic rocks
2
2017
... 碳质物质拉曼光谱分析也被应用于地震断层泥的研究.地震具有发育时间短,产热集中的特点,因此断层泥经历的变质过程与传统区域变质作用有较大区别[86 ] .为分析断层滑动过程中摩擦生热对断层泥中碳质物质的影响,诸多学者开展了人工剪切摩擦实验[87 ,88 ] 和天然断层泥碳质物质的拉曼光谱分析[86 ,88 ,89 ,90 ] . ...
... 也有学者尝试将碳质物质拉曼温度计应用于限定断层滑动的峰值摩擦温度[86 ,89 ] .然而,在低温区域,碳质物质拉曼温度计的精度较低(图4 c),制约了相关研究;另外断层泥中碳质物质经历的变质过程与区域变质或接触变质有显著差别,且断层压力、滑动速率和含水量等因素均会影响断层泥碳质物质拉曼光谱信号,因此,相关的研究需要综合考虑多种影响因素. ...
Carbonaceous materials in the fault zone of the longmenshan fault belt: 2. characterization of fault gouge from deep drilling and implications for fault maturity
1
2018
... 碳质物质拉曼光谱分析也被应用于地震断层泥的研究.地震具有发育时间短,产热集中的特点,因此断层泥经历的变质过程与传统区域变质作用有较大区别[86 ] .为分析断层滑动过程中摩擦生热对断层泥中碳质物质的影响,诸多学者开展了人工剪切摩擦实验[87 ,88 ] 和天然断层泥碳质物质的拉曼光谱分析[86 ,88 ,89 ,90 ] . ...
Thermally simulating dtudy on the vitrinite teflectance and the rvolution of organic materials from various source rocks
1
1996
... 在油气地质学领域,镜质体反射率是反映有机质热演化成熟度比较通用的指标,是进行有机质生油阶段(温度小于约250 ℃)划分的标尺[91 ,92 ] .而在更高的有机质成熟阶段,镜质体反射率指标敏感度降低[92 ,93 ] ,同时有些样品可能不含镜质体[28 ] ,为了完善有机质成熟度的判断方法,诸多学者尝试利用有机质拉曼光谱分析进行成熟度评价:Kelemen等[93 ] 发现随成熟度增加,拉曼谱峰中D峰与G峰面积比值减小;刘德汉等[94 ] 利用不同热演化程度的样品,得出适用于高成熟度样品的成熟度计算经验公式;Wilkins等[95 ,96 ] 也根据不同热演化程度煤的拉曼光谱特征建立了有机质成熟度的计算方法;王民等[97 ] 在Wilkins等[95 ,96 ] 的工作基础上建立了一种镜质组随机反射率(Rr )在0.4%~2.5%范围内的有机质热成熟度评价的拉曼模型;张聪等[98 ] 结合样品扫描电镜分析结果,验证了拉曼光谱技术是测定高成熟度有机质的一种行之有效的手段.这些研究表明了有机质激光拉曼再判断有机质成熟度方面的潜力,尤其是镜质体缺失或镜质体反射率受到抑制或识别困难的沉积岩中具有广阔的应用前景[97 ] .在其他地球科学领域,也有石墨化碳质物质拉曼光谱温度计的应用方向:如探究岩浆侵入所伴随的热效应[19 ,49 ] ,球粒陨石的热演化[7 ] ,示踪沉积物源区与碳质物质经历的沉积循环[99 ,100 ,101 ,102 ] ,有机质矿化过程中的变质温度[2 ] ,造山带剥蚀过程[84 ,85 ] 等. ...
源岩镜质体反射率和有机质演化的热模拟研究
1
1996
... 在油气地质学领域,镜质体反射率是反映有机质热演化成熟度比较通用的指标,是进行有机质生油阶段(温度小于约250 ℃)划分的标尺[91 ,92 ] .而在更高的有机质成熟阶段,镜质体反射率指标敏感度降低[92 ,93 ] ,同时有些样品可能不含镜质体[28 ] ,为了完善有机质成熟度的判断方法,诸多学者尝试利用有机质拉曼光谱分析进行成熟度评价:Kelemen等[93 ] 发现随成熟度增加,拉曼谱峰中D峰与G峰面积比值减小;刘德汉等[94 ] 利用不同热演化程度的样品,得出适用于高成熟度样品的成熟度计算经验公式;Wilkins等[95 ,96 ] 也根据不同热演化程度煤的拉曼光谱特征建立了有机质成熟度的计算方法;王民等[97 ] 在Wilkins等[95 ,96 ] 的工作基础上建立了一种镜质组随机反射率(Rr )在0.4%~2.5%范围内的有机质热成熟度评价的拉曼模型;张聪等[98 ] 结合样品扫描电镜分析结果,验证了拉曼光谱技术是测定高成熟度有机质的一种行之有效的手段.这些研究表明了有机质激光拉曼再判断有机质成熟度方面的潜力,尤其是镜质体缺失或镜质体反射率受到抑制或识别困难的沉积岩中具有广阔的应用前景[97 ] .在其他地球科学领域,也有石墨化碳质物质拉曼光谱温度计的应用方向:如探究岩浆侵入所伴随的热效应[19 ,49 ] ,球粒陨石的热演化[7 ] ,示踪沉积物源区与碳质物质经历的沉积循环[99 ,100 ,101 ,102 ] ,有机质矿化过程中的变质温度[2 ] ,造山带剥蚀过程[84 ,85 ] 等. ...
Research status of vitrinite rreflectivity
2
2015
... 在油气地质学领域,镜质体反射率是反映有机质热演化成熟度比较通用的指标,是进行有机质生油阶段(温度小于约250 ℃)划分的标尺[91 ,92 ] .而在更高的有机质成熟阶段,镜质体反射率指标敏感度降低[92 ,93 ] ,同时有些样品可能不含镜质体[28 ] ,为了完善有机质成熟度的判断方法,诸多学者尝试利用有机质拉曼光谱分析进行成熟度评价:Kelemen等[93 ] 发现随成熟度增加,拉曼谱峰中D峰与G峰面积比值减小;刘德汉等[94 ] 利用不同热演化程度的样品,得出适用于高成熟度样品的成熟度计算经验公式;Wilkins等[95 ,96 ] 也根据不同热演化程度煤的拉曼光谱特征建立了有机质成熟度的计算方法;王民等[97 ] 在Wilkins等[95 ,96 ] 的工作基础上建立了一种镜质组随机反射率(Rr )在0.4%~2.5%范围内的有机质热成熟度评价的拉曼模型;张聪等[98 ] 结合样品扫描电镜分析结果,验证了拉曼光谱技术是测定高成熟度有机质的一种行之有效的手段.这些研究表明了有机质激光拉曼再判断有机质成熟度方面的潜力,尤其是镜质体缺失或镜质体反射率受到抑制或识别困难的沉积岩中具有广阔的应用前景[97 ] .在其他地球科学领域,也有石墨化碳质物质拉曼光谱温度计的应用方向:如探究岩浆侵入所伴随的热效应[19 ,49 ] ,球粒陨石的热演化[7 ] ,示踪沉积物源区与碳质物质经历的沉积循环[99 ,100 ,101 ,102 ] ,有机质矿化过程中的变质温度[2 ] ,造山带剥蚀过程[84 ,85 ] 等. ...
... [92 ,93 ],同时有些样品可能不含镜质体[28 ] ,为了完善有机质成熟度的判断方法,诸多学者尝试利用有机质拉曼光谱分析进行成熟度评价:Kelemen等[93 ] 发现随成熟度增加,拉曼谱峰中D峰与G峰面积比值减小;刘德汉等[94 ] 利用不同热演化程度的样品,得出适用于高成熟度样品的成熟度计算经验公式;Wilkins等[95 ,96 ] 也根据不同热演化程度煤的拉曼光谱特征建立了有机质成熟度的计算方法;王民等[97 ] 在Wilkins等[95 ,96 ] 的工作基础上建立了一种镜质组随机反射率(Rr )在0.4%~2.5%范围内的有机质热成熟度评价的拉曼模型;张聪等[98 ] 结合样品扫描电镜分析结果,验证了拉曼光谱技术是测定高成熟度有机质的一种行之有效的手段.这些研究表明了有机质激光拉曼再判断有机质成熟度方面的潜力,尤其是镜质体缺失或镜质体反射率受到抑制或识别困难的沉积岩中具有广阔的应用前景[97 ] .在其他地球科学领域,也有石墨化碳质物质拉曼光谱温度计的应用方向:如探究岩浆侵入所伴随的热效应[19 ,49 ] ,球粒陨石的热演化[7 ] ,示踪沉积物源区与碳质物质经历的沉积循环[99 ,100 ,101 ,102 ] ,有机质矿化过程中的变质温度[2 ] ,造山带剥蚀过程[84 ,85 ] 等. ...
镜质体反射率的研究现状
2
2015
... 在油气地质学领域,镜质体反射率是反映有机质热演化成熟度比较通用的指标,是进行有机质生油阶段(温度小于约250 ℃)划分的标尺[91 ,92 ] .而在更高的有机质成熟阶段,镜质体反射率指标敏感度降低[92 ,93 ] ,同时有些样品可能不含镜质体[28 ] ,为了完善有机质成熟度的判断方法,诸多学者尝试利用有机质拉曼光谱分析进行成熟度评价:Kelemen等[93 ] 发现随成熟度增加,拉曼谱峰中D峰与G峰面积比值减小;刘德汉等[94 ] 利用不同热演化程度的样品,得出适用于高成熟度样品的成熟度计算经验公式;Wilkins等[95 ,96 ] 也根据不同热演化程度煤的拉曼光谱特征建立了有机质成熟度的计算方法;王民等[97 ] 在Wilkins等[95 ,96 ] 的工作基础上建立了一种镜质组随机反射率(Rr )在0.4%~2.5%范围内的有机质热成熟度评价的拉曼模型;张聪等[98 ] 结合样品扫描电镜分析结果,验证了拉曼光谱技术是测定高成熟度有机质的一种行之有效的手段.这些研究表明了有机质激光拉曼再判断有机质成熟度方面的潜力,尤其是镜质体缺失或镜质体反射率受到抑制或识别困难的沉积岩中具有广阔的应用前景[97 ] .在其他地球科学领域,也有石墨化碳质物质拉曼光谱温度计的应用方向:如探究岩浆侵入所伴随的热效应[19 ,49 ] ,球粒陨石的热演化[7 ] ,示踪沉积物源区与碳质物质经历的沉积循环[99 ,100 ,101 ,102 ] ,有机质矿化过程中的变质温度[2 ] ,造山带剥蚀过程[84 ,85 ] 等. ...
... [92 ,93 ],同时有些样品可能不含镜质体[28 ] ,为了完善有机质成熟度的判断方法,诸多学者尝试利用有机质拉曼光谱分析进行成熟度评价:Kelemen等[93 ] 发现随成熟度增加,拉曼谱峰中D峰与G峰面积比值减小;刘德汉等[94 ] 利用不同热演化程度的样品,得出适用于高成熟度样品的成熟度计算经验公式;Wilkins等[95 ,96 ] 也根据不同热演化程度煤的拉曼光谱特征建立了有机质成熟度的计算方法;王民等[97 ] 在Wilkins等[95 ,96 ] 的工作基础上建立了一种镜质组随机反射率(Rr )在0.4%~2.5%范围内的有机质热成熟度评价的拉曼模型;张聪等[98 ] 结合样品扫描电镜分析结果,验证了拉曼光谱技术是测定高成熟度有机质的一种行之有效的手段.这些研究表明了有机质激光拉曼再判断有机质成熟度方面的潜力,尤其是镜质体缺失或镜质体反射率受到抑制或识别困难的沉积岩中具有广阔的应用前景[97 ] .在其他地球科学领域,也有石墨化碳质物质拉曼光谱温度计的应用方向:如探究岩浆侵入所伴随的热效应[19 ,49 ] ,球粒陨石的热演化[7 ] ,示踪沉积物源区与碳质物质经历的沉积循环[99 ,100 ,101 ,102 ] ,有机质矿化过程中的变质温度[2 ] ,造山带剥蚀过程[84 ,85 ] 等. ...
Maturity trends in raman spectra from kerogen and coal
2
2001
... 在油气地质学领域,镜质体反射率是反映有机质热演化成熟度比较通用的指标,是进行有机质生油阶段(温度小于约250 ℃)划分的标尺[91 ,92 ] .而在更高的有机质成熟阶段,镜质体反射率指标敏感度降低[92 ,93 ] ,同时有些样品可能不含镜质体[28 ] ,为了完善有机质成熟度的判断方法,诸多学者尝试利用有机质拉曼光谱分析进行成熟度评价:Kelemen等[93 ] 发现随成熟度增加,拉曼谱峰中D峰与G峰面积比值减小;刘德汉等[94 ] 利用不同热演化程度的样品,得出适用于高成熟度样品的成熟度计算经验公式;Wilkins等[95 ,96 ] 也根据不同热演化程度煤的拉曼光谱特征建立了有机质成熟度的计算方法;王民等[97 ] 在Wilkins等[95 ,96 ] 的工作基础上建立了一种镜质组随机反射率(Rr )在0.4%~2.5%范围内的有机质热成熟度评价的拉曼模型;张聪等[98 ] 结合样品扫描电镜分析结果,验证了拉曼光谱技术是测定高成熟度有机质的一种行之有效的手段.这些研究表明了有机质激光拉曼再判断有机质成熟度方面的潜力,尤其是镜质体缺失或镜质体反射率受到抑制或识别困难的沉积岩中具有广阔的应用前景[97 ] .在其他地球科学领域,也有石墨化碳质物质拉曼光谱温度计的应用方向:如探究岩浆侵入所伴随的热效应[19 ,49 ] ,球粒陨石的热演化[7 ] ,示踪沉积物源区与碳质物质经历的沉积循环[99 ,100 ,101 ,102 ] ,有机质矿化过程中的变质温度[2 ] ,造山带剥蚀过程[84 ,85 ] 等. ...
... [93 ]发现随成熟度增加,拉曼谱峰中D峰与G峰面积比值减小;刘德汉等[94 ] 利用不同热演化程度的样品,得出适用于高成熟度样品的成熟度计算经验公式;Wilkins等[95 ,96 ] 也根据不同热演化程度煤的拉曼光谱特征建立了有机质成熟度的计算方法;王民等[97 ] 在Wilkins等[95 ,96 ] 的工作基础上建立了一种镜质组随机反射率(Rr )在0.4%~2.5%范围内的有机质热成熟度评价的拉曼模型;张聪等[98 ] 结合样品扫描电镜分析结果,验证了拉曼光谱技术是测定高成熟度有机质的一种行之有效的手段.这些研究表明了有机质激光拉曼再判断有机质成熟度方面的潜力,尤其是镜质体缺失或镜质体反射率受到抑制或识别困难的沉积岩中具有广阔的应用前景[97 ] .在其他地球科学领域,也有石墨化碳质物质拉曼光谱温度计的应用方向:如探究岩浆侵入所伴随的热效应[19 ,49 ] ,球粒陨石的热演化[7 ] ,示踪沉积物源区与碳质物质经历的沉积循环[99 ,100 ,101 ,102 ] ,有机质矿化过程中的变质温度[2 ] ,造山带剥蚀过程[84 ,85 ] 等. ...
Sample maturation calculated using raman spectroscopic parameters for solid organics: Methodology and geological applications
1
2013
... 在油气地质学领域,镜质体反射率是反映有机质热演化成熟度比较通用的指标,是进行有机质生油阶段(温度小于约250 ℃)划分的标尺[91 ,92 ] .而在更高的有机质成熟阶段,镜质体反射率指标敏感度降低[92 ,93 ] ,同时有些样品可能不含镜质体[28 ] ,为了完善有机质成熟度的判断方法,诸多学者尝试利用有机质拉曼光谱分析进行成熟度评价:Kelemen等[93 ] 发现随成熟度增加,拉曼谱峰中D峰与G峰面积比值减小;刘德汉等[94 ] 利用不同热演化程度的样品,得出适用于高成熟度样品的成熟度计算经验公式;Wilkins等[95 ,96 ] 也根据不同热演化程度煤的拉曼光谱特征建立了有机质成熟度的计算方法;王民等[97 ] 在Wilkins等[95 ,96 ] 的工作基础上建立了一种镜质组随机反射率(Rr )在0.4%~2.5%范围内的有机质热成熟度评价的拉曼模型;张聪等[98 ] 结合样品扫描电镜分析结果,验证了拉曼光谱技术是测定高成熟度有机质的一种行之有效的手段.这些研究表明了有机质激光拉曼再判断有机质成熟度方面的潜力,尤其是镜质体缺失或镜质体反射率受到抑制或识别困难的沉积岩中具有广阔的应用前景[97 ] .在其他地球科学领域,也有石墨化碳质物质拉曼光谱温度计的应用方向:如探究岩浆侵入所伴随的热效应[19 ,49 ] ,球粒陨石的热演化[7 ] ,示踪沉积物源区与碳质物质经历的沉积循环[99 ,100 ,101 ,102 ] ,有机质矿化过程中的变质温度[2 ] ,造山带剥蚀过程[84 ,85 ] 等. ...
固体有机质拉曼光谱参数计算样品热演化程度的方法与地质应用
1
2013
... 在油气地质学领域,镜质体反射率是反映有机质热演化成熟度比较通用的指标,是进行有机质生油阶段(温度小于约250 ℃)划分的标尺[91 ,92 ] .而在更高的有机质成熟阶段,镜质体反射率指标敏感度降低[92 ,93 ] ,同时有些样品可能不含镜质体[28 ] ,为了完善有机质成熟度的判断方法,诸多学者尝试利用有机质拉曼光谱分析进行成熟度评价:Kelemen等[93 ] 发现随成熟度增加,拉曼谱峰中D峰与G峰面积比值减小;刘德汉等[94 ] 利用不同热演化程度的样品,得出适用于高成熟度样品的成熟度计算经验公式;Wilkins等[95 ,96 ] 也根据不同热演化程度煤的拉曼光谱特征建立了有机质成熟度的计算方法;王民等[97 ] 在Wilkins等[95 ,96 ] 的工作基础上建立了一种镜质组随机反射率(Rr )在0.4%~2.5%范围内的有机质热成熟度评价的拉曼模型;张聪等[98 ] 结合样品扫描电镜分析结果,验证了拉曼光谱技术是测定高成熟度有机质的一种行之有效的手段.这些研究表明了有机质激光拉曼再判断有机质成熟度方面的潜力,尤其是镜质体缺失或镜质体反射率受到抑制或识别困难的沉积岩中具有广阔的应用前景[97 ] .在其他地球科学领域,也有石墨化碳质物质拉曼光谱温度计的应用方向:如探究岩浆侵入所伴随的热效应[19 ,49 ] ,球粒陨石的热演化[7 ] ,示踪沉积物源区与碳质物质经历的沉积循环[99 ,100 ,101 ,102 ] ,有机质矿化过程中的变质温度[2 ] ,造山带剥蚀过程[84 ,85 ] 等. ...
Thermal maturity evaluation from inertinites by raman spectroscopy: The “RaMM” technique
2
2014
... 在油气地质学领域,镜质体反射率是反映有机质热演化成熟度比较通用的指标,是进行有机质生油阶段(温度小于约250 ℃)划分的标尺[91 ,92 ] .而在更高的有机质成熟阶段,镜质体反射率指标敏感度降低[92 ,93 ] ,同时有些样品可能不含镜质体[28 ] ,为了完善有机质成熟度的判断方法,诸多学者尝试利用有机质拉曼光谱分析进行成熟度评价:Kelemen等[93 ] 发现随成熟度增加,拉曼谱峰中D峰与G峰面积比值减小;刘德汉等[94 ] 利用不同热演化程度的样品,得出适用于高成熟度样品的成熟度计算经验公式;Wilkins等[95 ,96 ] 也根据不同热演化程度煤的拉曼光谱特征建立了有机质成熟度的计算方法;王民等[97 ] 在Wilkins等[95 ,96 ] 的工作基础上建立了一种镜质组随机反射率(Rr )在0.4%~2.5%范围内的有机质热成熟度评价的拉曼模型;张聪等[98 ] 结合样品扫描电镜分析结果,验证了拉曼光谱技术是测定高成熟度有机质的一种行之有效的手段.这些研究表明了有机质激光拉曼再判断有机质成熟度方面的潜力,尤其是镜质体缺失或镜质体反射率受到抑制或识别困难的沉积岩中具有广阔的应用前景[97 ] .在其他地球科学领域,也有石墨化碳质物质拉曼光谱温度计的应用方向:如探究岩浆侵入所伴随的热效应[19 ,49 ] ,球粒陨石的热演化[7 ] ,示踪沉积物源区与碳质物质经历的沉积循环[99 ,100 ,101 ,102 ] ,有机质矿化过程中的变质温度[2 ] ,造山带剥蚀过程[84 ,85 ] 等. ...
... [95 ,96 ]的工作基础上建立了一种镜质组随机反射率(Rr )在0.4%~2.5%范围内的有机质热成熟度评价的拉曼模型;张聪等[98 ] 结合样品扫描电镜分析结果,验证了拉曼光谱技术是测定高成熟度有机质的一种行之有效的手段.这些研究表明了有机质激光拉曼再判断有机质成熟度方面的潜力,尤其是镜质体缺失或镜质体反射率受到抑制或识别困难的沉积岩中具有广阔的应用前景[97 ] .在其他地球科学领域,也有石墨化碳质物质拉曼光谱温度计的应用方向:如探究岩浆侵入所伴随的热效应[19 ,49 ] ,球粒陨石的热演化[7 ] ,示踪沉积物源区与碳质物质经历的沉积循环[99 ,100 ,101 ,102 ] ,有机质矿化过程中的变质温度[2 ] ,造山带剥蚀过程[84 ,85 ] 等. ...
A RaMM study of thermal maturity of dispersed organic matter in marine source rocks
2
2015
... 在油气地质学领域,镜质体反射率是反映有机质热演化成熟度比较通用的指标,是进行有机质生油阶段(温度小于约250 ℃)划分的标尺[91 ,92 ] .而在更高的有机质成熟阶段,镜质体反射率指标敏感度降低[92 ,93 ] ,同时有些样品可能不含镜质体[28 ] ,为了完善有机质成熟度的判断方法,诸多学者尝试利用有机质拉曼光谱分析进行成熟度评价:Kelemen等[93 ] 发现随成熟度增加,拉曼谱峰中D峰与G峰面积比值减小;刘德汉等[94 ] 利用不同热演化程度的样品,得出适用于高成熟度样品的成熟度计算经验公式;Wilkins等[95 ,96 ] 也根据不同热演化程度煤的拉曼光谱特征建立了有机质成熟度的计算方法;王民等[97 ] 在Wilkins等[95 ,96 ] 的工作基础上建立了一种镜质组随机反射率(Rr )在0.4%~2.5%范围内的有机质热成熟度评价的拉曼模型;张聪等[98 ] 结合样品扫描电镜分析结果,验证了拉曼光谱技术是测定高成熟度有机质的一种行之有效的手段.这些研究表明了有机质激光拉曼再判断有机质成熟度方面的潜力,尤其是镜质体缺失或镜质体反射率受到抑制或识别困难的沉积岩中具有广阔的应用前景[97 ] .在其他地球科学领域,也有石墨化碳质物质拉曼光谱温度计的应用方向:如探究岩浆侵入所伴随的热效应[19 ,49 ] ,球粒陨石的热演化[7 ] ,示踪沉积物源区与碳质物质经历的沉积循环[99 ,100 ,101 ,102 ] ,有机质矿化过程中的变质温度[2 ] ,造山带剥蚀过程[84 ,85 ] 等. ...
... ,96 ]的工作基础上建立了一种镜质组随机反射率(Rr )在0.4%~2.5%范围内的有机质热成熟度评价的拉曼模型;张聪等[98 ] 结合样品扫描电镜分析结果,验证了拉曼光谱技术是测定高成熟度有机质的一种行之有效的手段.这些研究表明了有机质激光拉曼再判断有机质成熟度方面的潜力,尤其是镜质体缺失或镜质体反射率受到抑制或识别困难的沉积岩中具有广阔的应用前景[97 ] .在其他地球科学领域,也有石墨化碳质物质拉曼光谱温度计的应用方向:如探究岩浆侵入所伴随的热效应[19 ,49 ] ,球粒陨石的热演化[7 ] ,示踪沉积物源区与碳质物质经历的沉积循环[99 ,100 ,101 ,102 ] ,有机质矿化过程中的变质温度[2 ] ,造山带剥蚀过程[84 ,85 ] 等. ...
Thermal maturity evaluation of sedimentary organic matter using laser Raman spectroscopy
2
2016
... 在油气地质学领域,镜质体反射率是反映有机质热演化成熟度比较通用的指标,是进行有机质生油阶段(温度小于约250 ℃)划分的标尺[91 ,92 ] .而在更高的有机质成熟阶段,镜质体反射率指标敏感度降低[92 ,93 ] ,同时有些样品可能不含镜质体[28 ] ,为了完善有机质成熟度的判断方法,诸多学者尝试利用有机质拉曼光谱分析进行成熟度评价:Kelemen等[93 ] 发现随成熟度增加,拉曼谱峰中D峰与G峰面积比值减小;刘德汉等[94 ] 利用不同热演化程度的样品,得出适用于高成熟度样品的成熟度计算经验公式;Wilkins等[95 ,96 ] 也根据不同热演化程度煤的拉曼光谱特征建立了有机质成熟度的计算方法;王民等[97 ] 在Wilkins等[95 ,96 ] 的工作基础上建立了一种镜质组随机反射率(Rr )在0.4%~2.5%范围内的有机质热成熟度评价的拉曼模型;张聪等[98 ] 结合样品扫描电镜分析结果,验证了拉曼光谱技术是测定高成熟度有机质的一种行之有效的手段.这些研究表明了有机质激光拉曼再判断有机质成熟度方面的潜力,尤其是镜质体缺失或镜质体反射率受到抑制或识别困难的沉积岩中具有广阔的应用前景[97 ] .在其他地球科学领域,也有石墨化碳质物质拉曼光谱温度计的应用方向:如探究岩浆侵入所伴随的热效应[19 ,49 ] ,球粒陨石的热演化[7 ] ,示踪沉积物源区与碳质物质经历的沉积循环[99 ,100 ,101 ,102 ] ,有机质矿化过程中的变质温度[2 ] ,造山带剥蚀过程[84 ,85 ] 等. ...
... [97 ].在其他地球科学领域,也有石墨化碳质物质拉曼光谱温度计的应用方向:如探究岩浆侵入所伴随的热效应[19 ,49 ] ,球粒陨石的热演化[7 ] ,示踪沉积物源区与碳质物质经历的沉积循环[99 ,100 ,101 ,102 ] ,有机质矿化过程中的变质温度[2 ] ,造山带剥蚀过程[84 ,85 ] 等. ...
激光拉曼技术评价沉积有机质热成熟度
2
2016
... 在油气地质学领域,镜质体反射率是反映有机质热演化成熟度比较通用的指标,是进行有机质生油阶段(温度小于约250 ℃)划分的标尺[91 ,92 ] .而在更高的有机质成熟阶段,镜质体反射率指标敏感度降低[92 ,93 ] ,同时有些样品可能不含镜质体[28 ] ,为了完善有机质成熟度的判断方法,诸多学者尝试利用有机质拉曼光谱分析进行成熟度评价:Kelemen等[93 ] 发现随成熟度增加,拉曼谱峰中D峰与G峰面积比值减小;刘德汉等[94 ] 利用不同热演化程度的样品,得出适用于高成熟度样品的成熟度计算经验公式;Wilkins等[95 ,96 ] 也根据不同热演化程度煤的拉曼光谱特征建立了有机质成熟度的计算方法;王民等[97 ] 在Wilkins等[95 ,96 ] 的工作基础上建立了一种镜质组随机反射率(Rr )在0.4%~2.5%范围内的有机质热成熟度评价的拉曼模型;张聪等[98 ] 结合样品扫描电镜分析结果,验证了拉曼光谱技术是测定高成熟度有机质的一种行之有效的手段.这些研究表明了有机质激光拉曼再判断有机质成熟度方面的潜力,尤其是镜质体缺失或镜质体反射率受到抑制或识别困难的沉积岩中具有广阔的应用前景[97 ] .在其他地球科学领域,也有石墨化碳质物质拉曼光谱温度计的应用方向:如探究岩浆侵入所伴随的热效应[19 ,49 ] ,球粒陨石的热演化[7 ] ,示踪沉积物源区与碳质物质经历的沉积循环[99 ,100 ,101 ,102 ] ,有机质矿化过程中的变质温度[2 ] ,造山带剥蚀过程[84 ,85 ] 等. ...
... [97 ].在其他地球科学领域,也有石墨化碳质物质拉曼光谱温度计的应用方向:如探究岩浆侵入所伴随的热效应[19 ,49 ] ,球粒陨石的热演化[7 ] ,示踪沉积物源区与碳质物质经历的沉积循环[99 ,100 ,101 ,102 ] ,有机质矿化过程中的变质温度[2 ] ,造山带剥蚀过程[84 ,85 ] 等. ...
Raman spectrum characteristics of organic matter in silurian Longmaxi Formation shale of well Anye-1 and its geological significance
1
2019
... 在油气地质学领域,镜质体反射率是反映有机质热演化成熟度比较通用的指标,是进行有机质生油阶段(温度小于约250 ℃)划分的标尺[91 ,92 ] .而在更高的有机质成熟阶段,镜质体反射率指标敏感度降低[92 ,93 ] ,同时有些样品可能不含镜质体[28 ] ,为了完善有机质成熟度的判断方法,诸多学者尝试利用有机质拉曼光谱分析进行成熟度评价:Kelemen等[93 ] 发现随成熟度增加,拉曼谱峰中D峰与G峰面积比值减小;刘德汉等[94 ] 利用不同热演化程度的样品,得出适用于高成熟度样品的成熟度计算经验公式;Wilkins等[95 ,96 ] 也根据不同热演化程度煤的拉曼光谱特征建立了有机质成熟度的计算方法;王民等[97 ] 在Wilkins等[95 ,96 ] 的工作基础上建立了一种镜质组随机反射率(Rr )在0.4%~2.5%范围内的有机质热成熟度评价的拉曼模型;张聪等[98 ] 结合样品扫描电镜分析结果,验证了拉曼光谱技术是测定高成熟度有机质的一种行之有效的手段.这些研究表明了有机质激光拉曼再判断有机质成熟度方面的潜力,尤其是镜质体缺失或镜质体反射率受到抑制或识别困难的沉积岩中具有广阔的应用前景[97 ] .在其他地球科学领域,也有石墨化碳质物质拉曼光谱温度计的应用方向:如探究岩浆侵入所伴随的热效应[19 ,49 ] ,球粒陨石的热演化[7 ] ,示踪沉积物源区与碳质物质经历的沉积循环[99 ,100 ,101 ,102 ] ,有机质矿化过程中的变质温度[2 ] ,造山带剥蚀过程[84 ,85 ] 等. ...
安页1井志留系龙马溪组页岩有机质拉曼光谱特征及其地质意义
1
2019
... 在油气地质学领域,镜质体反射率是反映有机质热演化成熟度比较通用的指标,是进行有机质生油阶段(温度小于约250 ℃)划分的标尺[91 ,92 ] .而在更高的有机质成熟阶段,镜质体反射率指标敏感度降低[92 ,93 ] ,同时有些样品可能不含镜质体[28 ] ,为了完善有机质成熟度的判断方法,诸多学者尝试利用有机质拉曼光谱分析进行成熟度评价:Kelemen等[93 ] 发现随成熟度增加,拉曼谱峰中D峰与G峰面积比值减小;刘德汉等[94 ] 利用不同热演化程度的样品,得出适用于高成熟度样品的成熟度计算经验公式;Wilkins等[95 ,96 ] 也根据不同热演化程度煤的拉曼光谱特征建立了有机质成熟度的计算方法;王民等[97 ] 在Wilkins等[95 ,96 ] 的工作基础上建立了一种镜质组随机反射率(Rr )在0.4%~2.5%范围内的有机质热成熟度评价的拉曼模型;张聪等[98 ] 结合样品扫描电镜分析结果,验证了拉曼光谱技术是测定高成熟度有机质的一种行之有效的手段.这些研究表明了有机质激光拉曼再判断有机质成熟度方面的潜力,尤其是镜质体缺失或镜质体反射率受到抑制或识别困难的沉积岩中具有广阔的应用前景[97 ] .在其他地球科学领域,也有石墨化碳质物质拉曼光谱温度计的应用方向:如探究岩浆侵入所伴随的热效应[19 ,49 ] ,球粒陨石的热演化[7 ] ,示踪沉积物源区与碳质物质经历的沉积循环[99 ,100 ,101 ,102 ] ,有机质矿化过程中的变质温度[2 ] ,造山带剥蚀过程[84 ,85 ] 等. ...
Provenance analysis using Raman spectroscopy of carbonaceous material: A case study in the Southern Alps of New Zealand
1
2015
... 在油气地质学领域,镜质体反射率是反映有机质热演化成熟度比较通用的指标,是进行有机质生油阶段(温度小于约250 ℃)划分的标尺[91 ,92 ] .而在更高的有机质成熟阶段,镜质体反射率指标敏感度降低[92 ,93 ] ,同时有些样品可能不含镜质体[28 ] ,为了完善有机质成熟度的判断方法,诸多学者尝试利用有机质拉曼光谱分析进行成熟度评价:Kelemen等[93 ] 发现随成熟度增加,拉曼谱峰中D峰与G峰面积比值减小;刘德汉等[94 ] 利用不同热演化程度的样品,得出适用于高成熟度样品的成熟度计算经验公式;Wilkins等[95 ,96 ] 也根据不同热演化程度煤的拉曼光谱特征建立了有机质成熟度的计算方法;王民等[97 ] 在Wilkins等[95 ,96 ] 的工作基础上建立了一种镜质组随机反射率(Rr )在0.4%~2.5%范围内的有机质热成熟度评价的拉曼模型;张聪等[98 ] 结合样品扫描电镜分析结果,验证了拉曼光谱技术是测定高成熟度有机质的一种行之有效的手段.这些研究表明了有机质激光拉曼再判断有机质成熟度方面的潜力,尤其是镜质体缺失或镜质体反射率受到抑制或识别困难的沉积岩中具有广阔的应用前景[97 ] .在其他地球科学领域,也有石墨化碳质物质拉曼光谱温度计的应用方向:如探究岩浆侵入所伴随的热效应[19 ,49 ] ,球粒陨石的热演化[7 ] ,示踪沉积物源区与碳质物质经历的沉积循环[99 ,100 ,101 ,102 ] ,有机质矿化过程中的变质温度[2 ] ,造山带剥蚀过程[84 ,85 ] 等. ...
Erosion of the southern alps of New Zealand during the last deglaciation
1
2018
... 在油气地质学领域,镜质体反射率是反映有机质热演化成熟度比较通用的指标,是进行有机质生油阶段(温度小于约250 ℃)划分的标尺[91 ,92 ] .而在更高的有机质成熟阶段,镜质体反射率指标敏感度降低[92 ,93 ] ,同时有些样品可能不含镜质体[28 ] ,为了完善有机质成熟度的判断方法,诸多学者尝试利用有机质拉曼光谱分析进行成熟度评价:Kelemen等[93 ] 发现随成熟度增加,拉曼谱峰中D峰与G峰面积比值减小;刘德汉等[94 ] 利用不同热演化程度的样品,得出适用于高成熟度样品的成熟度计算经验公式;Wilkins等[95 ,96 ] 也根据不同热演化程度煤的拉曼光谱特征建立了有机质成熟度的计算方法;王民等[97 ] 在Wilkins等[95 ,96 ] 的工作基础上建立了一种镜质组随机反射率(Rr )在0.4%~2.5%范围内的有机质热成熟度评价的拉曼模型;张聪等[98 ] 结合样品扫描电镜分析结果,验证了拉曼光谱技术是测定高成熟度有机质的一种行之有效的手段.这些研究表明了有机质激光拉曼再判断有机质成熟度方面的潜力,尤其是镜质体缺失或镜质体反射率受到抑制或识别困难的沉积岩中具有广阔的应用前景[97 ] .在其他地球科学领域,也有石墨化碳质物质拉曼光谱温度计的应用方向:如探究岩浆侵入所伴随的热效应[19 ,49 ] ,球粒陨石的热演化[7 ] ,示踪沉积物源区与碳质物质经历的沉积循环[99 ,100 ,101 ,102 ] ,有机质矿化过程中的变质温度[2 ] ,造山带剥蚀过程[84 ,85 ] 等. ...
Recycling of graphite during himalayan Erosion: A geological stabilization of carbon in the crust
1
2008
... 在油气地质学领域,镜质体反射率是反映有机质热演化成熟度比较通用的指标,是进行有机质生油阶段(温度小于约250 ℃)划分的标尺[91 ,92 ] .而在更高的有机质成熟阶段,镜质体反射率指标敏感度降低[92 ,93 ] ,同时有些样品可能不含镜质体[28 ] ,为了完善有机质成熟度的判断方法,诸多学者尝试利用有机质拉曼光谱分析进行成熟度评价:Kelemen等[93 ] 发现随成熟度增加,拉曼谱峰中D峰与G峰面积比值减小;刘德汉等[94 ] 利用不同热演化程度的样品,得出适用于高成熟度样品的成熟度计算经验公式;Wilkins等[95 ,96 ] 也根据不同热演化程度煤的拉曼光谱特征建立了有机质成熟度的计算方法;王民等[97 ] 在Wilkins等[95 ,96 ] 的工作基础上建立了一种镜质组随机反射率(Rr )在0.4%~2.5%范围内的有机质热成熟度评价的拉曼模型;张聪等[98 ] 结合样品扫描电镜分析结果,验证了拉曼光谱技术是测定高成熟度有机质的一种行之有效的手段.这些研究表明了有机质激光拉曼再判断有机质成熟度方面的潜力,尤其是镜质体缺失或镜质体反射率受到抑制或识别困难的沉积岩中具有广阔的应用前景[97 ] .在其他地球科学领域,也有石墨化碳质物质拉曼光谱温度计的应用方向:如探究岩浆侵入所伴随的热效应[19 ,49 ] ,球粒陨石的热演化[7 ] ,示踪沉积物源区与碳质物质经历的沉积循环[99 ,100 ,101 ,102 ] ,有机质矿化过程中的变质温度[2 ] ,造山带剥蚀过程[84 ,85 ] 等. ...
Survival of graphitized petrogenic organic carbon through multiple erosional cycles
1
2020
... 在油气地质学领域,镜质体反射率是反映有机质热演化成熟度比较通用的指标,是进行有机质生油阶段(温度小于约250 ℃)划分的标尺[91 ,92 ] .而在更高的有机质成熟阶段,镜质体反射率指标敏感度降低[92 ,93 ] ,同时有些样品可能不含镜质体[28 ] ,为了完善有机质成熟度的判断方法,诸多学者尝试利用有机质拉曼光谱分析进行成熟度评价:Kelemen等[93 ] 发现随成熟度增加,拉曼谱峰中D峰与G峰面积比值减小;刘德汉等[94 ] 利用不同热演化程度的样品,得出适用于高成熟度样品的成熟度计算经验公式;Wilkins等[95 ,96 ] 也根据不同热演化程度煤的拉曼光谱特征建立了有机质成熟度的计算方法;王民等[97 ] 在Wilkins等[95 ,96 ] 的工作基础上建立了一种镜质组随机反射率(Rr )在0.4%~2.5%范围内的有机质热成熟度评价的拉曼模型;张聪等[98 ] 结合样品扫描电镜分析结果,验证了拉曼光谱技术是测定高成熟度有机质的一种行之有效的手段.这些研究表明了有机质激光拉曼再判断有机质成熟度方面的潜力,尤其是镜质体缺失或镜质体反射率受到抑制或识别困难的沉积岩中具有广阔的应用前景[97 ] .在其他地球科学领域,也有石墨化碳质物质拉曼光谱温度计的应用方向:如探究岩浆侵入所伴随的热效应[19 ,49 ] ,球粒陨石的热演化[7 ] ,示踪沉积物源区与碳质物质经历的沉积循环[99 ,100 ,101 ,102 ] ,有机质矿化过程中的变质温度[2 ] ,造山带剥蚀过程[84 ,85 ] 等. ...
The Mesozoic along-strike tectonometamorphic segmentation of Longmen Shan (eastern Tibetan Plateau)
1
2018
... 作为一种定量测试中低级变质岩峰期变质温度的方法,石墨化碳质物质拉曼光谱温度计具有样品制备简单、测试方便快捷、测试周期短等优点,相关实验与应用需要注意样品制备、碳质物质的非均质性与各向异性、样品风化程度等非温度因素的影响.抛砖引玉,作者认为该温度计方法理论与应用的进一步发展,需要在如下方面做更多工作:如前文所述,不同经验模型在中高温范围内的计算结果比较一致,然而在低温范围内,计算结果差异很大[38 ] ,因此探究低温编制样品碳质物质拉曼光谱信号的主控因素、开发针对低级变质样品的温度计算经验公式是有必要的.其次,如Lünsdorf等[25 ] 所指出的,现有的测试条件以及数据分析过程会因实验室和操作人员的不同有较大差别,这使得温度计算结果在一定程度上没有可比性,因此,此温度计未来发展中需要建立一个标准的样品制备和测试方法,以建立更加标准对比体系.最后,在应用方面,此温度计仍有较大空间值得开发,如可与热年代学方法结合,用于限定岩石的温度历史[21 ] ;与构造地质观测与矿物压力计等结合,限定岩石的变形与变质历史等[103 ] . ...


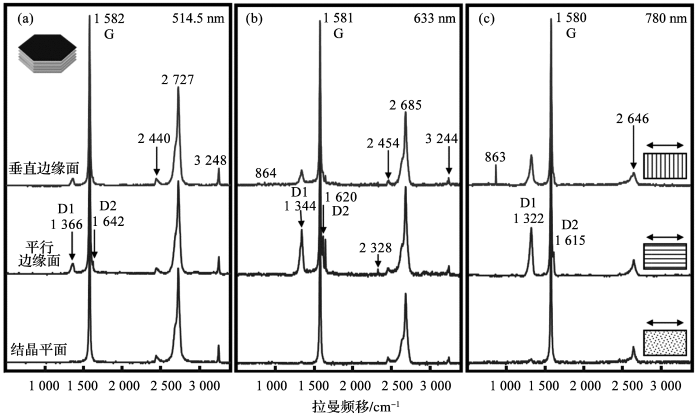
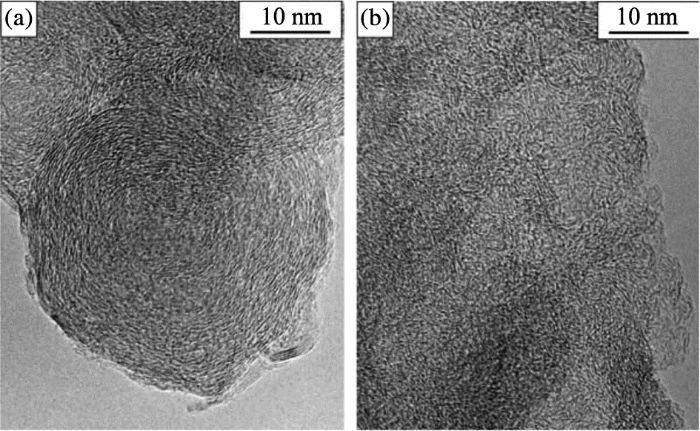
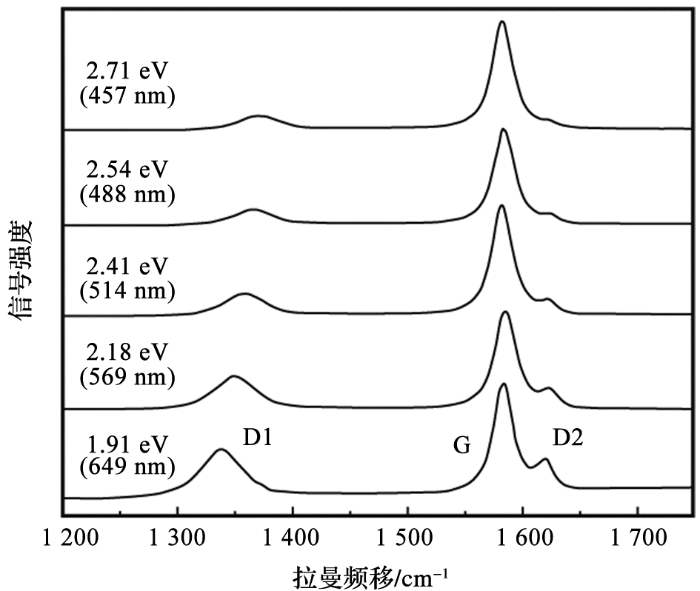
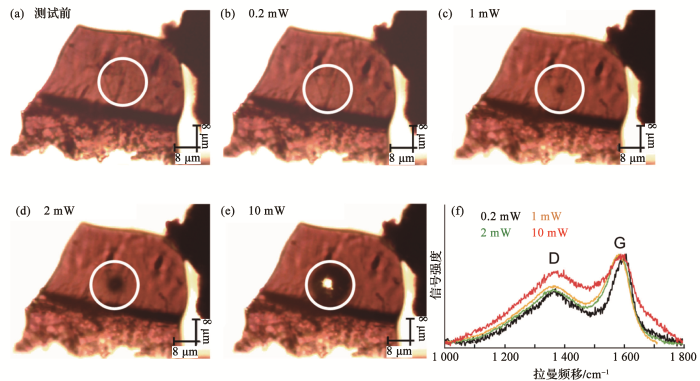

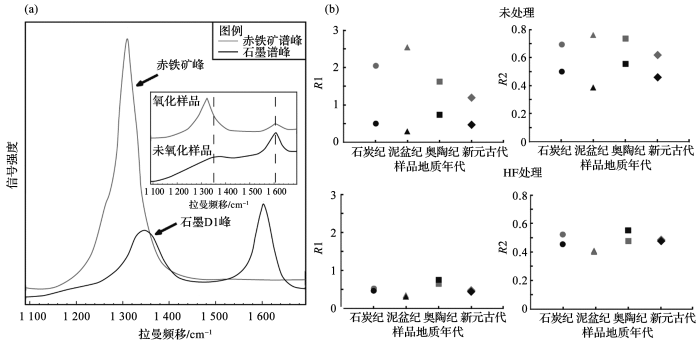
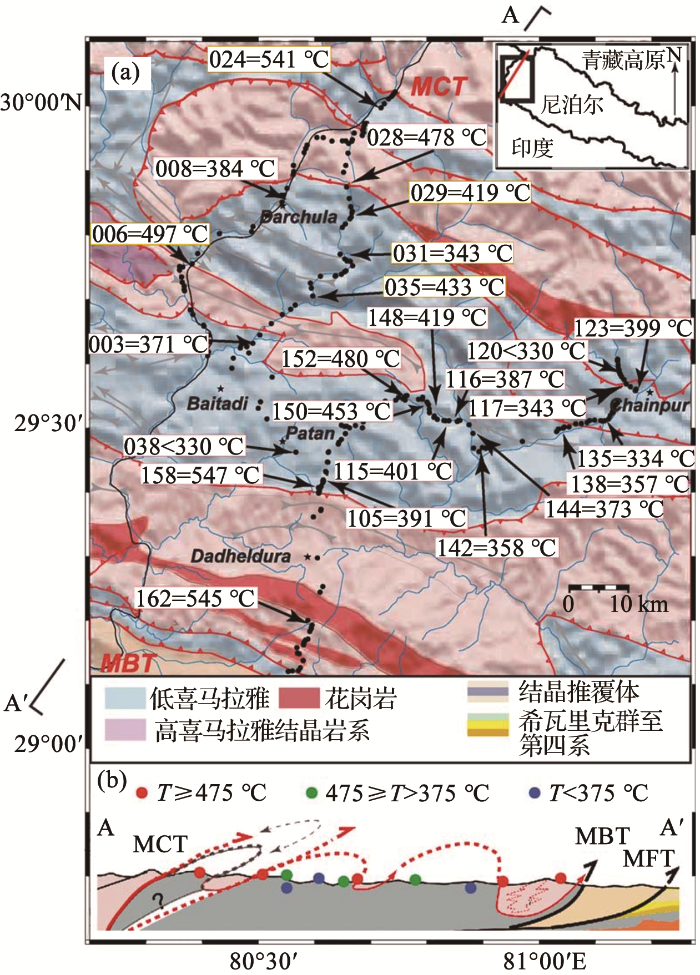
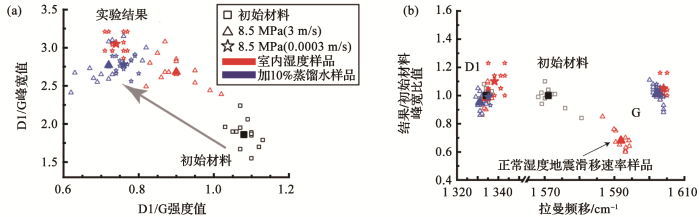
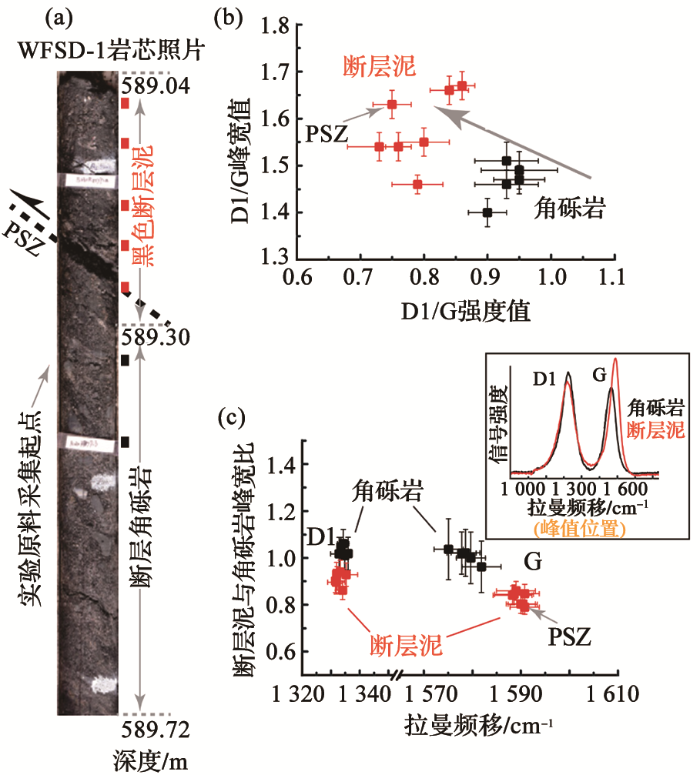
