石墨化碳质物质拉曼光谱温度计原理与应用
Fundamentals and Applications of Raman Spectroscopy of Carbonaceous Material(RSCM)Thermometry
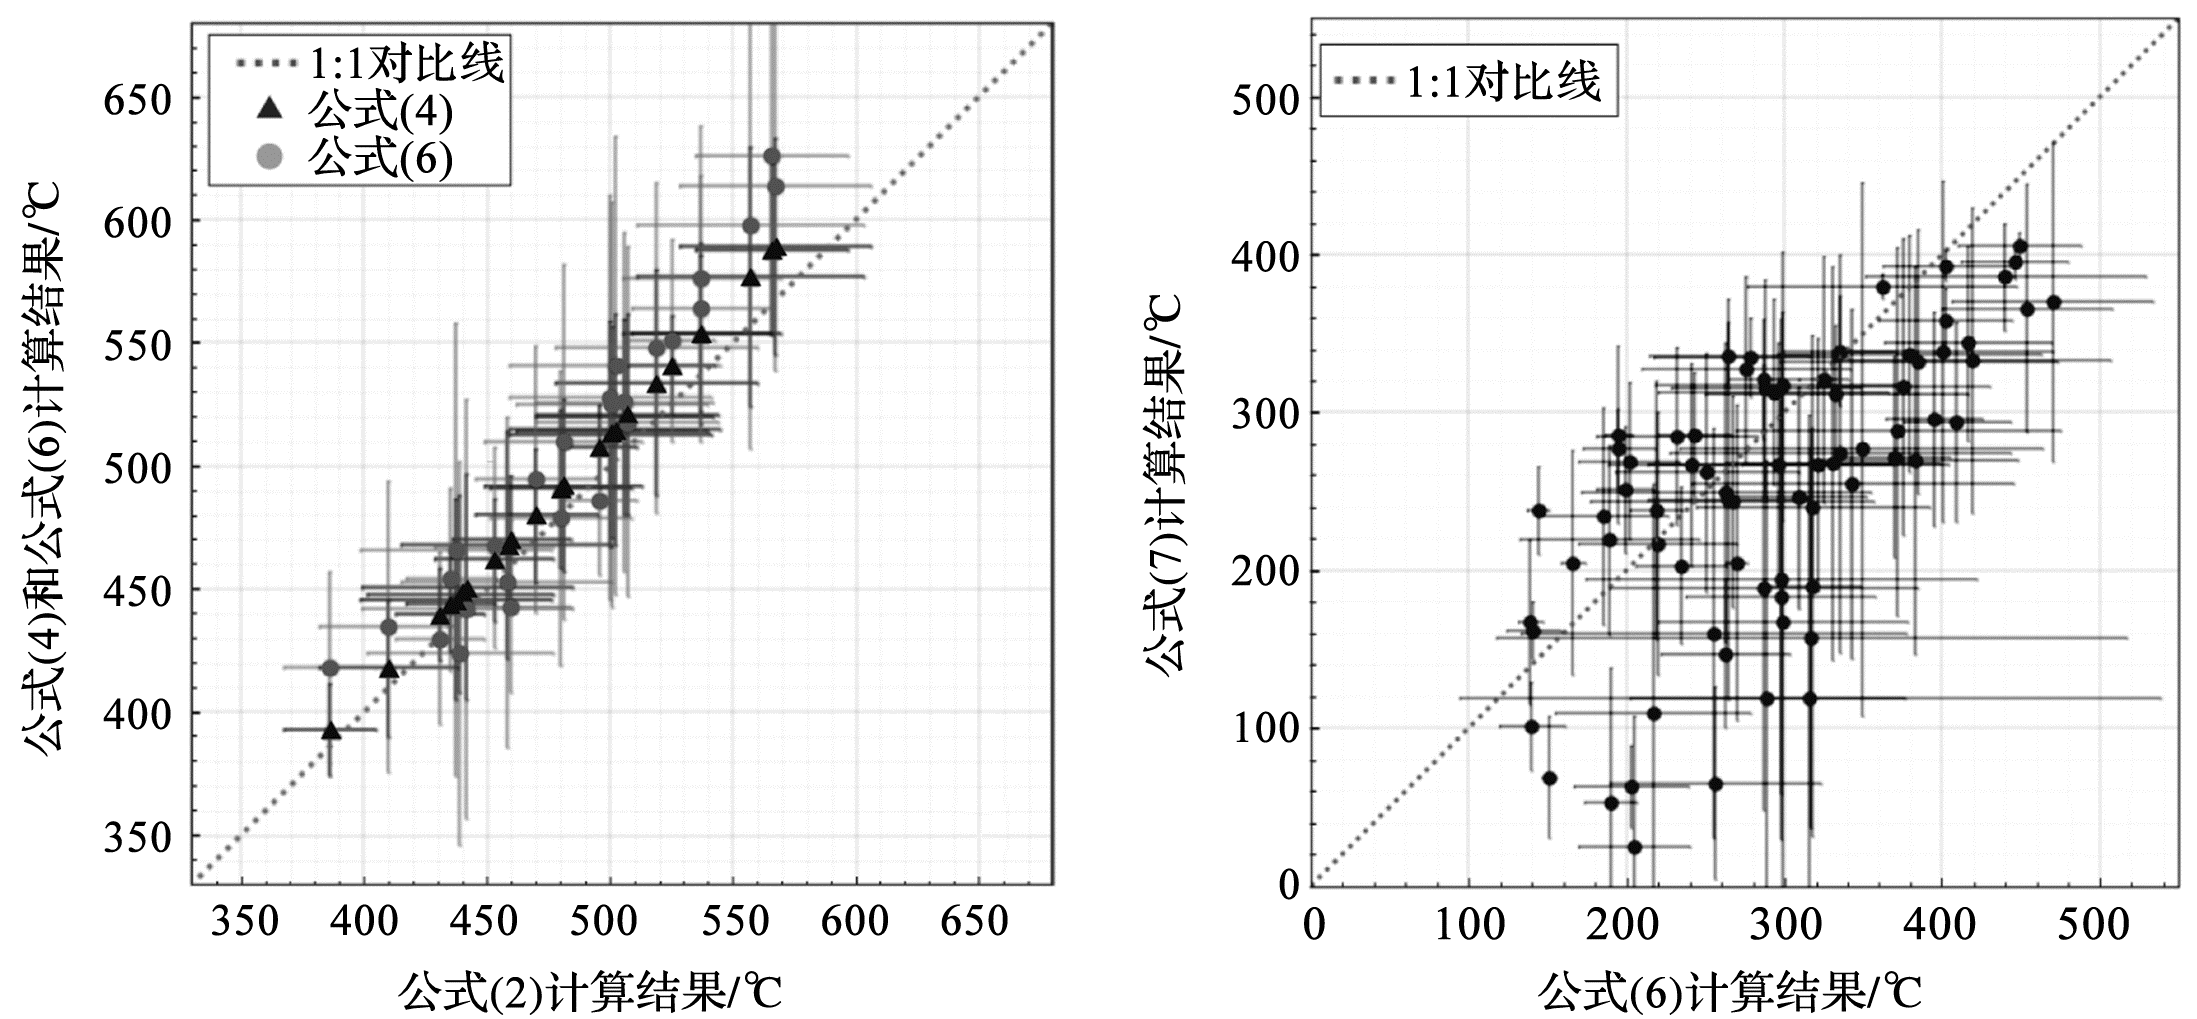
(a)高温样品的经验公式计算结果对比图,结果显示,除个别异常点,公式(4)与(6)的计算温度明显高于公式(2);(b)适用于相对低温样品的经验公式(6)(横坐标)与公式(7)(纵坐标)低温(<400 ℃)计算结果对比,二者计算相对误差均较大,整体上公式(7)计算结果小于公式(6);拉曼数据源自参考文献[
(a) Comparison of the temperatures calculated by equations (2) (x-axis) and (4), (6) (y-axis) that are suitable for a relatively higher temperature range; The calculation results show that except for several outliners, the calculated temperatures by formula (4) and (6) are higher than that by formula (2); (b) Comparison of equation 6 (x-axis) and 7 (y-axis) at low temperature (<400 ℃). Both errors are large, and the calculated results of equation 7 are relatively smaller than those of equation 6. Raman data are derived from reference[