石墨化碳质物质拉曼光谱温度计原理与应用
Fundamentals and Applications of Raman Spectroscopy of Carbonaceous Material(RSCM)Thermometry
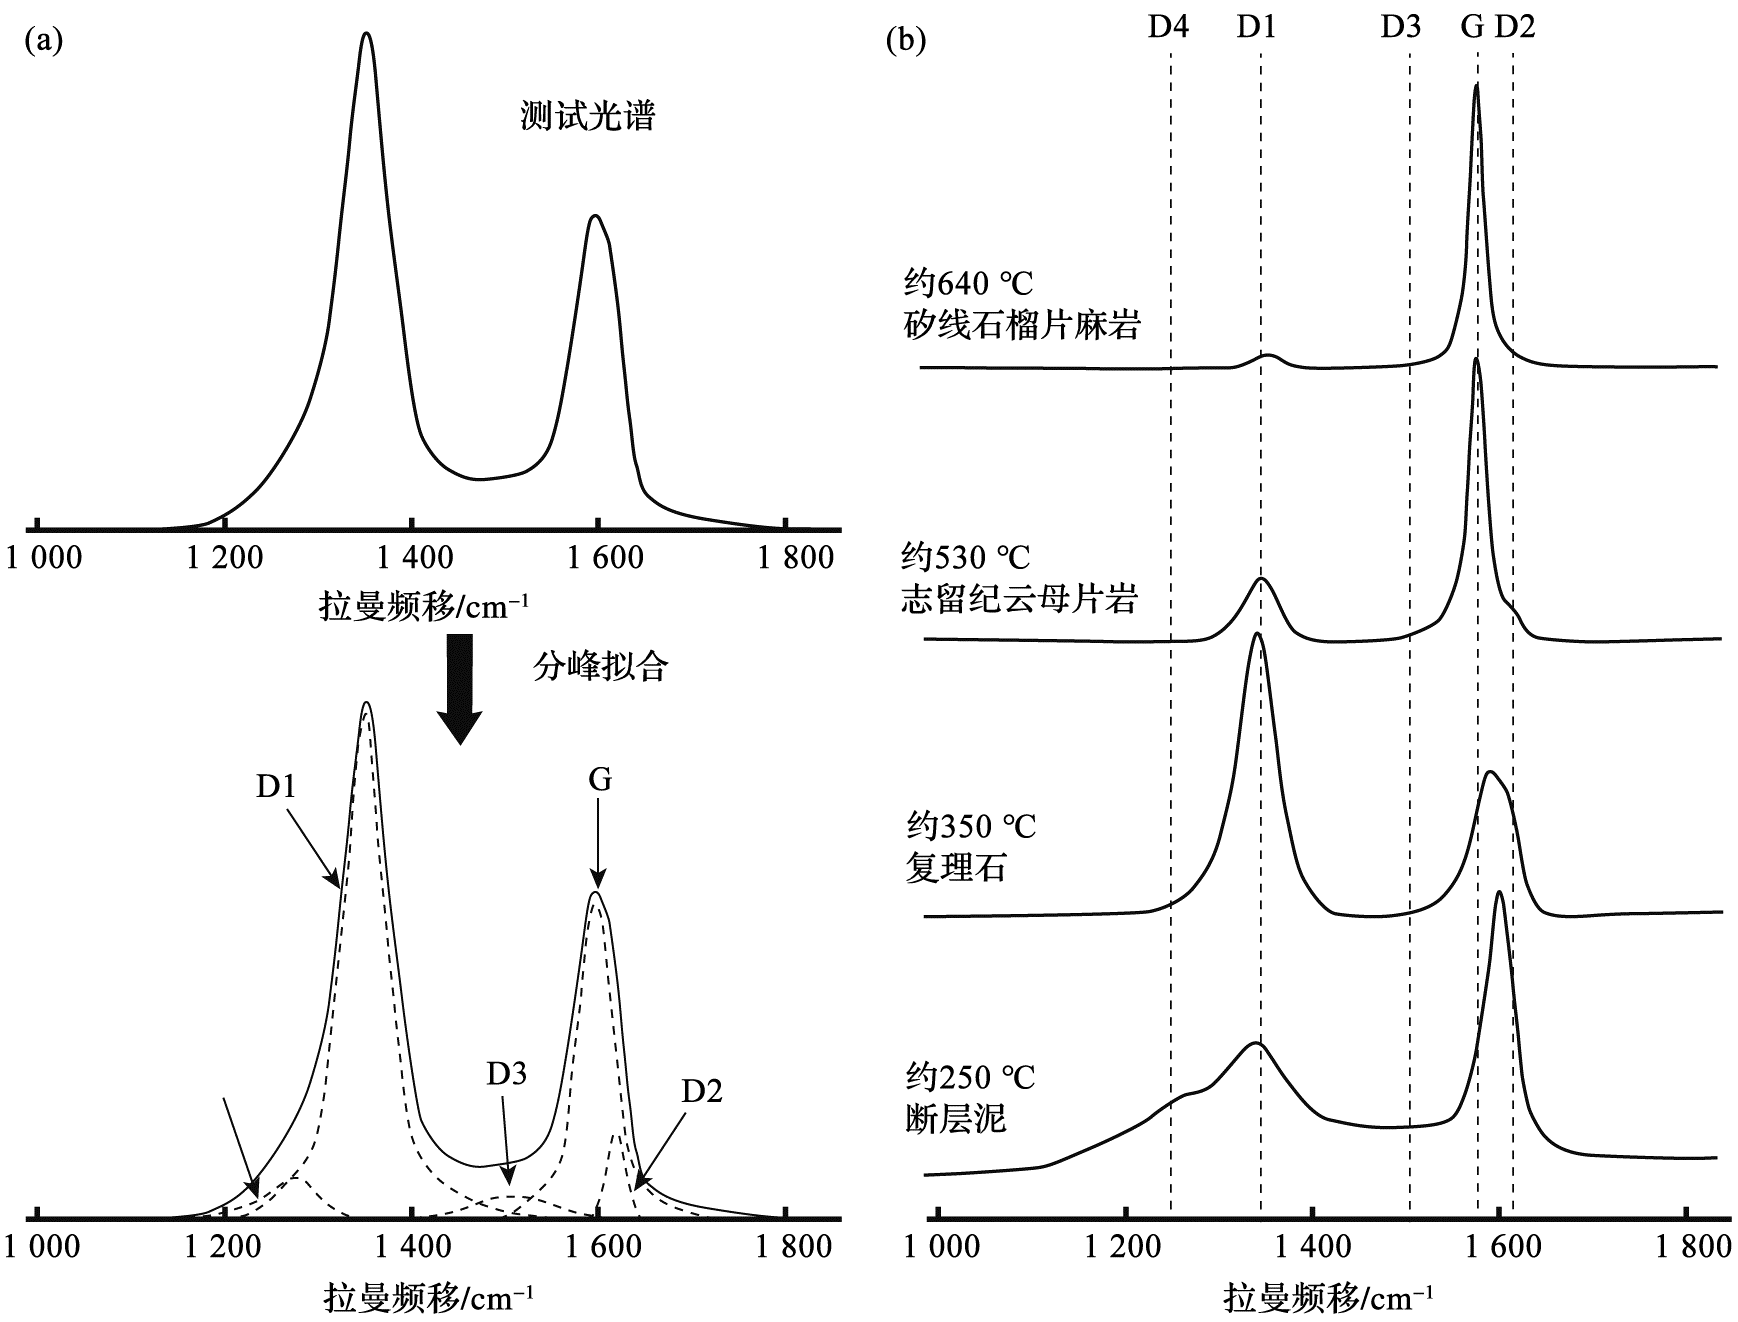
(a)光谱拟合示意图(据参考文献[
(a) Images of typical raman spectra and spectral fitting results (modified after reference [
石墨化碳质物质拉曼光谱温度计原理与应用 |
| 田野, 田云涛 |
|
Fundamentals and Applications of Raman Spectroscopy of Carbonaceous Material(RSCM)Thermometry |
| Ye Tian, Yuntao Tian |
| 图1 碳质物质拉曼光谱特征、光谱拟合及经历了不同变质温度样品光谱信号 (a)光谱拟合示意图(据参考文献[ |
| Fig.1 Images of typical raman spectra, spectral fitting results and the spectra of samples that have experienced different peak metamorphic temperatures (a) Images of typical raman spectra and spectral fitting results (modified after reference [ |
|
|