
林晓娟 , 高姗, 仉天宇
Lin Xiaojuan, Gao Shan, Zhang Tianyu
中图分类号: P76
文献标识码: A
文章编号: 1001-8166(2018)04-0373-12
通讯作者:
收稿日期: 2017-09-5
修回日期: 2017-12-18
网络出版日期: 2018-04-20
版权声明: 2018 地球科学进展 编辑部
基金资助:
作者简介:
First author:Lin Xiaojuan(1991-),female,Fu’an City, Fujian Province,Master student.Research areas include eutrophication of offshore seawater.E-mail:lin-xiaojuan@foxmail.com
作者简介:林晓娟(1991-),女,福建福安人,硕士研究生,主要从事近岸海水富营养化研究.E-mail:lin-xiaojuan@foxmail.com
展开
摘要
简要概述了海水富营养化的概念及对生态系统的影响。介绍了几类常用的海水富营养化评价方法,包括单因子法、富营养化指数法、水质指数法和营养状态质量法等国内常用的评价方法,以及近年来国际上发展起来的以富营养化症状为考虑因素的第二代海水富营养评价方法,包括综合评价法、河口富营养化评价法和波罗的海行动计划等,第二代方法的评价标准更为细化,对富营养化带来的环境效应也提供一定的判断标准。阐述了现阶段我国海水富营养化评价方法的应用现状,尤其是在近海河口区域针对富营养化程度进行的区域等级划分,旨在提出各种海水富营养化评价方法应用现状和特点,为不同海域在选用富营养化评价方法提供参考。最后,对海水富营养化评价的应用方向提出未来展望,给出水质监测管理以及海洋生态环境灾害预测防御的指导性建议。
关键词:
Abstract
The concept of eutrophication of seawater and its impact on the ecosystem were briefly summarized. The commonly used evaluation methods in China for eutrophication of seawater were introduced, including single factor, eutrophication index, water quality index and nutritional status, etc. In recent years, the second generation of seawater eutrophication evaluation methods, including OSPAR (Oslo-Paris Convention) Assessment Tool and NEEA-ASSESSMENT (United States National Estuarine Eutrophication Assessment) and HELCOM (Helsinki Commission) Eutrophication Assessment Tool, has developed in the world, and the second generation method has had more refined evaluation standards, which provide some criterion to judge the eutrophication effects to the environment. The present situation of the application of seawater eutrophication evaluation method in our country at present stage was described, especially in the coastal and estuary areas, eutrophication degree of regional dividing was carried out, which aimed to put forward the application status and characteristics of various water eutrophication evaluation methods to provide references for the selection of eutrophication evaluation methods in different areas. Finally, the future prospects of the application of eutrophication assessment were put forward, and the guidance of the monitoring and management of water quality monitoring and the forecasting and defensing of marine eco-environmental disasters were presented.
Keywords:
关于富营养化的定义多种多样,不同的研究者基于不同的着眼点,对这一术语有着不同的理解;根据不同水体也有不同理解,本文主要指针对海水这类水体的富营养化。富营养化原本是个自然过程,是指营养盐等要素随地球化学循环进入水体环境后,在适当的光照、温度等条件下,引发诸如藻类等生物增殖的自然过程[1]。Nixon[2]定义的富营养化是指水体中由于营养盐供给速率的增加,系统初级生产力显著提高,特别是近几十年农药化肥的施用和化石燃料的燃烧,加速了氮磷等营养元素随着地表径流或大气沉降向近海的输移,营养盐增多,这是导致沿海水域有机质输入增多的最主要因素。Edmondson[3]则指出富营养化是由于营养盐来源的增加导致某一水域营养状况改变的过程。同时Jørgensen等[4] 也指出,应该区分自然过程引起的自然富营养化和人类活动引起的文明富营养化(即人为因素造成的富营养化),强调了人为富营养化应该重点关注。美国河口评价项目组、欧盟的奥斯陆—巴黎协议策略(Oslo-Paris COMISSION,OSPAR)[5]和欧洲环境署(European Environment Agency)[6]等对富营养化的概念进行了进一步补充和完善,在《欧洲沿岸海域富营养状况(Eutrophication in Europe’s coastal waters)》报告中[6],海洋富营养化被定义为:因水体营养盐富集而致使海水中藻类加速生长、干扰海洋中高等植物系统平衡稳定、影响水体水质的现象,反映的是人类活动所导致的营养盐富集而产生的不良效应,并指出环境管理应关注人为增加的、对环境有害的营养盐部分。这是现在广泛认同的最恰当的定义[7]。尽管富营养化的定义各有侧重,但上述各种关于富营养化的定义中,均认为富营养化是水体中营养盐,尤其是氮、磷以及有机质的增加[810],并且重点关注人为富营养化[11]。
富营养化直接导致了植物生长所需的氮磷等营养物质的增加,为藻类暴发提供了物质基础,富营养化破坏了水域的生态平衡,使原有生态系统结构改变[12,13]、功能退化[14,15]。现在人们已经充分认识到富营养化是许多河口和沿岸海域面临的严重问题,如叶绿素浓度过高[2,16],藻类过度繁殖和浮游植物的暴发性增长,水体出现缺氧和低氧[17,18],有毒有害藻类大量生长繁殖[19]。
近岸海水富营养化的影响非常深远,可导致鱼类死亡[20]、贝类养殖受损[21]、海底植被减少[2224]、底栖动物窒息[19]。这些影响造成巨大的经济损失和社会问题[25],有些损失甚至难以估量[26]。海水富营养化对生态系统的影响可以分为初级富营养化特征和次级富营养化特征。初级富营养化特征主要包括海洋浮游植物、大型藻类、附生植物等海洋初级生产者“异常”生长,进而导致海洋生物量“异常”增加,引起赤潮等海洋生态环境灾害[27]。次级富营养化的特征是,营养物质耗尽后,随之而来的是藻类的大量死亡和水体中有机物的大量增加并向底层转移,增加了底栖动物的食物和底栖植物的养分,同时降低了海水的透明度[11],限制了生活在较深水层的大型植物(如褐藻和红藻)的生长和繁殖[28]。由于食物供应增加,底栖动物生长加快会增加氧气消耗,细菌对沉入深水的死亡浮游植物的分解需要大量的氧气以及位于沉积物表层的硫细菌产生硫化氢(H2S)扩散到海水上层还会消耗氧气进而形成缺氧环境,大型底栖生物就会大量死亡。这些条件为厌氧细菌提供了大量高质量的食物使其迅速繁殖,形成恶性循环。综上所述,次级富营养化特征是由于初级症状加剧而产生的结果,这些特征主要包括颗粒有机碳(Particulate Organic Carbon,POC)、化学需氧量(Chemical Oxygen Demand,COD)等浓度“异常”升高,底层海水中溶解氧浓度显著降低(缺氧状况)[29,30],水下植被因透光率降低而生长受损等。
第一代富营养化评价的概念起源于陆地湖沼学研究,并被早期的海洋学家引用到近海富营养化问题的研究中,这一概念认为,当营养盐输入增大或减小时,水体生态系统会直接进行线性的响应和表达,导致浮游生物生物量的增减,因此营养盐的多寡能直接表征系统的富营养化状态[31]。根据第一代富营养化概念模型,第一代富营养化评价方法主要强调营养盐在富营养化状态中的作用,最早出现的是单因子指数法,后来又采用多因子的组合来反映富营养化程度,如富营养化指数法(E),营养状态质量法(NQI)等[32,33]。另外,还有根据近海系统模糊性和不确定性而提出的模糊数学法和神经网络等方法。
2.1.1 单因子法
单因子法包括物理参数法、化学参数法和生物参数法。物理参数法最常用的是测量水体透明度,但该方法不适合用在水体悬浮物多的地方,因为悬浮物也会影响水体透明度,进而影响最后的观测结果;化学参数法主要指与藻类生长繁殖有直接关系的二氧化碳(CO2)、溶解氧(DO)、氮(N)、磷(P)和化学需氧量(COD)等参数的指示方法;生物学参数法则主要指藻类现存量或者叶绿素a、浮游植物的种类、多样性种类、藻类增殖潜力等参数的指示方法[34]。采用单因子法进行海水富营养化评价简单易行,但是海水富营养化是一个非线性多影响因素的复杂现象,因而单因子已无法满足现在富营养评价的需要[35,36]。
2.1.2 综合指数法
(1) 富营养化指数法(E)
该方法最早在日本使用,后由邹景忠引入,在研究渤海问题时根据具体情况,对常数a重新赋值[34]:
式中:E由化学需氧量(COD)、溶解无机氮(Dissolved Inorganic Nitrogen,DIN)、溶解无机磷(dissolved inorganic phosphorus,DIP)以及根据不同海域环境给定的常数a计算得出。当E≥1时,表明海水为富营养化状态;其中常数a的值为1 500和4 500[32,33]。富营养化指数法是国内最常用的评价方法之一[31]。
(2)氮磷比值法
氮磷比值法以海洋浮游植物对氮、磷营养盐吸收的Redfield值为理论基础,当氮磷比(N/P)<8则为氮限制;N/P>30则为磷限制。根据国家一类海水水质标准,确定贫营养型、中营养型和富营养型海水中溶解无机氮(Dissolved Inorganic Nitrogen,DIN)和活性磷酸盐(Dissolved Inorganic Phosphorus,DIP)浓度的上限或下限阈值[22]。氮磷比值法多应用于计算潜在富营养化,揭示营养盐对富营养化的限制,认为只有氮磷比接近Redfield值的情况下,才能使潜在部分的营养盐对富营养化的贡献释放出来[37]。
(3)营养状态质量法(NQI)
式中:NQI由化学需氧量(COD)、溶解无机氮(DIN)、溶解无机磷(DIP)和叶绿素a(chlorophyll a,简称Chl-a)计算得到,上角标为s的参量表示相应的标准值。当NQI<2表示海水处于贫营养型,2<NQI<3表示中等营养型,NQI≥3 表示富营养型。营养状态指数法也是国内用的较多的富营养化评价方法之一[38,39]。
(4)水质指数法(A)
式中:A由化学需氧量(COD)、溶解无机氮(DIN)、溶解无机磷(DIP)和溶解氧(DO)计算得到,对应下角标为t的参量是实测值,下角标为s的参量是水质标准值。A的临界值为2,若A>2,说明水质已受到有机物污染,<2则为正常营养水平[40]。
(5)营养盐正态分布法
把水体分为近岸海湾水、离岸海湾水、近岸大洋水和离岸大洋水4类,用统计学方法将目标海域的氮、磷历史数据归一化处理,结果成正态分布,确定相应平均值(μ)和标准差(σ)。实测值介于μ和(μ+σ)之间的目标水域为贫营养型,介于(μ+σ)和(μ+2σ)之间的为中等营养型,介于(μ+2σ)和(μ+3σ)之间的为富营养型[41]。
(6)溶解氧饱和参数法
式中:D
(7)神经网格法
该类评价方法适用于机理复杂、影响因素较多以及难以建立有效数学模型等的非线性海域。评价因子选取5个主要指标: COD,DO,PO4-P,DIN和Chl-a,该方法经过模型学习训练后,全局误差趋于极小,满足收敛的要求,并且具有泛化性,能较好的进行模拟[43]。
(8)模糊数学法
该类评价方法多以COD,DIN,Chl-a,DIP和DO为指标。其中COD,DIN,DIP和DO以国家海水质标准为基础,Chl-a则根据不同评价区域的叶绿素a浓度状况来确定。通过计算不同指标对于一类、二类和三类水质标准的隶属度,形成一个n(评价指标个数)×m(水质标准层级)的隶属度矩阵,再将隶属度矩阵与每个因子对于富营养化的贡献率w相关联,得出富营养化指标[44]。其中每个因子的贡献率w值的确定很重要,它反映了各个因素在综合决策中所占的地位或所起的作用,可以直接影响到模糊评价的结果[45]。因而不同的研究者采用了不同的方法来确定,张思冲等[46]采用“最佳因子”赋权原则,先用主成分分析法算出“最佳关系权”wjp,而后用层次分析法对因子进行两两比较,构造判断矩阵,计算出“相对重要性关系权”wja,通过二者的算术平均得到最终的w值。陈鸣渊等[44]将各因子的实测值与国家海水水质标准平均值的比值作为贡献率w的值,并将各个指标的w值进行归一化处理得到最终的贡献率
(9)浮游植物群落结构指数评价法
浮游植物群落结构指数评价法以目标海域浮游植物群落的个体密度、生物量、多样性指数及均匀性指数评价指标,评判目标海域的富营养化症状[47]。将富营养化程度分为贫营养型、中等营养型和富营养型3级,分别赋分为1分,2分和3分。将目标海域各站位的个体密度、生物量、多样性指数及均匀性指数与富营养等级标准(表1)相比较,然后确定各单项评价指标的分级,最后以单项评价所得分数的均值评价目标海域的富营养化程度。
式中: q为目标海域富营养化指标,当 q>2.5时,目标海域为富营养型;当 1.5<q<2.5时,目标海域为中等营养化型;当 q<1.5时,目标海域为贫营养型; qi为单项指标(浮游植物个体密度、Chl-a、浮游植物多样性指数和浮游植物均匀度指数)[48]。
表1 富营养化分级等级表
Table 1 Eutrophication classification scale
| 营养水平 | 赋分 | 浮游植物个体 密度/(万个/L) | Chl-a /(mg/m3) | 浮游植物多 样性指数 | 浮游植物均 匀度指数 |
|---|---|---|---|---|---|
| 贫营养型 | 1 | <30 | <1.90 | >3 | 0.50.8 |
| 中营养型 | 2 | 30100 | 1.9010.9 | 13 | 0.30.5 |
| 富营养型 | 3 | >100 | >10.9 | 01 | 00.3 |
与单因子法相比,综合指数法不仅考虑了影响海水富营养化的直接因素,还考虑到了海水富营养化的一些症状指标,常见如Chl-a,DO和COD。因此,对比单因子法,综合指数法更全面。另外,综合指数法的计算公式较简单,选择的评价指标也多是目前易于监测到的数据,数据易于获取,这使得综合指数法中富营养化指数法(E)和营养状态质量法(NQI)得到较为广泛的应用。但由于不同海洋对于营养盐的敏感程度有区别,如长江口,虽然靠近入海口的海域营养盐浓度较高,但并不经常暴发赤潮;稍远离入海口的海域赤潮发生则较为频繁。因此,综合指数法这种线性经验模型应用于所有海洋系统的响应存在一定的不足之处。在具体海域应用时应根据该海域具体的情况适当调整。
以营养盐为基础的第一代富营养化评价方法,在某些情况下并不能很好地反映出富营养化的程度,国际上很多海洋研究机构开始尝试建立多参数的第二代海水富营养化评价模型[49]。海水第二代富营养化评价方法是在第二代海水富营养化模型的基础上建立的,与第一代的主要区别在于第二代海水富营养化评价方法强调富营养化的过程而不仅仅是营养盐的输入[48],包括综合评价法和河口富营养化评价法等。
2.2.1 综合评价法(OSPAR)
综合评价法(The Convention for the Protection of the Marine Environment of the North-East Atlantic, OSPAR)需首先对海域进行盐度分区,分成河口海域、近岸海域和外海域,目标是通过对富营养化特点的判断,将研究海域划分为3类:①问题区域,表示目标海域呈现出营养盐富集的增长趋势,并伴随着直接、间接和其他不良富营养化效应;或者目标区域在没有明显的营养盐富集增长趋势时,出现了直接、间接和其他不良富营养化效应[50]。②潜在性问题区域,表示目标海域营养盐富集的程度在增加,但具有严格的科学证据表明该目标海域并无直接、间接或其他不良富营养化效应;或者该目标海域确实存在营养盐富集的情况,但数据不足以支持将目标海域划为潜在性问题区域。③无问题区域,表示目标海域无营养盐富集及相关的直接、间接或其他不良富营养化效应[6]。
评价方法包含4个类型部分(表2),致害因素(营养盐富集因子,包括TN:Totally Nitrogen,TP:Totally Phosphorus,DIN和DIP等)、营养盐富集直接效应(Chl-a、浮游植物优势种群、沉水植被、大型藻类和小型底栖植物等参数的变化)、营养盐富集间接效应(缺氧程度、海水中有机碳浓度变化、底栖动物及鱼类死亡等)和衍生效应(有毒有害藻华等)。利用评价浓度值与区域背景浓度值比较,当超过可接受的阈值(如超出50%)时,评分即为“+”,否则为“-”。每个类型部分状态的计算,依据“一荣俱荣、一损俱损(one out ,all out)”的原则,只要该类型中有一指标属于问题区域,整个类型将划为问题区域。最终,海域总的富营养化等级通过对4个类型状态等级的综合判断[5]进行划分。
2.2.2 河口富营养化评价法
河口富营养化评价法(United States National Estuarine Eutrophication Assessment, NEEA-ASSETS)是基于美国国家海洋和大气管理局(National Oceanic and Atmospheric Administration, NOAA)对美国138处河口的富营养化状态评价而改进的富营养化综合评价模型[5],适用于海湾、河口等不同特点的近海系统。核心是依靠3个诊断工具(表3):①压力指数(人类营养盐的输入);②以现象为基础的富营养状态(叶绿素a浓度、藻类、溶解氧和赤潮发生的状态);③人类营养盐输入的变化(水动力敏感度、陆源排放),通过对这3个方面的综合评价得到目标海域的综合富营养化状况[49]。
河口富营养化评价法可以用来对比河口与近岸海水的富营养化程度,进行分级并为管理者决策提供依据,包括定量的和半定量的成分,利用实测数据、模型数据和前人的经验提供“压力—状态—响应(Pressure-Status-Reaction,PSR)”型的指示[49]。具体应用步骤是,先对评价区域(河口或海湾)基于盐度进行分区,在评价过程中,目标海域根据盐度划分为咸潮区、河口混合区和近岸海水区3个盐度分区,计算每个盐度分区的指标得分,计算每个指标根据盐度分区的面积加权得分的和,然后选初级症状所有指标的平均值和次级症状所有指标的最差值进行综合,得到系统富营养化状况。值得注意的是,指标得分的计算不仅仅考虑指标的浓度,还考虑浓度出现的频率和空间覆盖度,更全面地反映问题的严重程度[53,54]。
表2 海水富营养化综合评价指示因子的评价标准(据参考文献[50,51] 修改)
Table 2 The evaluation criteria of OSPAR indicators of seawater eutrophication (modified after references [50,51])
| 类别 | 指示因子 | 用以评价的环境要素 | 评价标准 |
|---|---|---|---|
| 营养盐富 集因子 | 海水富营养 化直接原因 | 河流、点源等陆源TN和 TP排海通量 | 比前一年增加或 趋势增加50%以上 |
| 海水富营养 化直接结果 | 冬季目标海域海水中的 DIN和DIP浓度 | 比目标海域背景值高 50%以上 | |
| 冬季目标海域海水中的 DIN和DIP比值 | ≥25 | ||
| 营养盐富集 直接效应 | 海水富营养 化初级特征 | 目标海域海水中Chl-a浓度 最大值和平均值 | 比目标海域背景值高 50%以上 |
| 目标海域海洋浮游 植物优势种 | 生物量增加、持续期延长 | ||
| 目标海域大型藻类等 | 从长期优势种演变为短 期优势种或有害种 | ||
| 营养盐富集 间接效应 | 海水富营养 化次级特征 | 目标海域海水缺氧程度 | DO<2 mg/L为急性危害 DO=4~5 mg/L为危害/缺乏 DO=5~6 mg/L为不足 |
| 目标海域海水中有机碳/ 有机物浓度变化 | 浓度增加 (适用于沉积群落) | ||
| 海水富营养 化长期环境 生态效应 | 目标海域底栖动物 | 生物量、种类组成出现 显著的长期变化 | |
| 目标海域鱼类 | 主要由于缺氧和/或 有毒藻类导致死亡 | ||
| 营养盐富集的衍生效应 | 藻类毒素贻贝传染事件等 | ||
表3 河口富营养化评价因子、环境要素和评价要点(据参考文献[51,52]修改)
Table 3 Evaluation factors, environmental elements and evaluation points of eutrophication of NEEA-ASSETS (modified after references [51,52])
| 评价项 | 指示因子 | 环境要素 | 评价要点 |
|---|---|---|---|
| 压力 | 直接原因 | 陆源DIN排放 | 陆源排放淡水中DIN浓度 |
| 直接结果 | 目标海域中DIN浓度 | 目标海域河口混合区、 海水区中DIN浓度 | |
| 状态 | 初级症状 | Chl-a | 含量、范围、频率 |
| 大型藻类 | 存在问题、频率 | ||
| 附生植物 | 存在问题、频率 | ||
| 次级症状 | 缺氧状况 | 溶解氧浓度、范围、频率 | |
| 水下植被 | 存在问题、覆盖度损失量 | ||
| 有害赤潮 | 发生状况、持续时间、频率 | ||
| 有毒赤潮 | 发生状况、持续时间、频率 | ||
| 响应趋势 | 水动力敏感度 | 稀释能力 | 分层状况、稀释容量 |
| 冲刷能力 | 潮差、陆源淡水输入 | ||
| 陆源DIN排放 | 未来变化趋势 | ||
2.2.3 波罗的海行动计划
赫尔辛基委员会(Helsinki Commission,HELCOM)通过了波罗的海行动计划,目的是联合波罗的海沿岸各国恢复波罗的海的渔业生产。为了达到完全统一和协调的评估,首先,统一使用了多参数的、指标集合为基础的工具[55,56]HEAT 3.0(HELCOM Eutrophication Assessment Tool 3.0)[57];其次,采用系统定量的方法,结合不同指标的相对不确定性,利用变化系数分析了富营养化状况评价的可信度变化。这2个因素代表了我们对富营养化状况的理解迈出了重要一步,首先是做基础研究,并进一步估计目前监测数据是否足够用来评估波罗的海的富营养化状况[58]。
HELCOM方法一共分为6个步骤:①制定富营养化质量标准[55,59](Eutrophication Quality Target,ET);②计算富营养化比例(表4);③将评价因子归项:分别归入营养盐富集因子项、直接效应项及间接效应项[60];④根据富营养化比例对富营养化状况进行评价,每个评价因子现在该类别下进行平均或加权平均,得出3类评价项富营养化比例(ER),再根据表5中优、良、中、差、劣[58]的规则来评价;⑤“一损俱损”原则:由3类评价项中最差的一项决定海水富营养化的等级;⑥信心评级:对3类评价项根据其与评价标准的误差进行可信度的计算[61]。
表4 HELCOM方法的评价指标集合富营养化目标和富营养化比例[
Table 4 HELCOM Eutrophication Assessment Tools’ grouping of indicator Eutrophication Quality Target and Eutrophication Ratio (ER)[
| 富营养化评价项 | 富营养化评价因子 | 富营养化比例 |
|---|---|---|
| 营养盐富集因子 | 溶解态无机氮(DIN) | ER = ES/ET正相关 (富营养化评价因子状态/特 定因子当年的目标值) |
| 溶解态无机磷(DIP) | ||
| 直接效应 | 叶绿素a(Chl-a) | |
| 透明度(SD) | ER = ET/ES负相关 (特定因子当年的目标值/富 营养化评价因子状态) | |
| 间接效应 | 氧负债(OD) | |
| 底栖无脊椎动物(BI) |
表5 富营养化比例对应的营养状态、富营养化分类和变化范围[
Table 5 ER intervals and corresponding eutrophication status,eutrophication classes, and deviation range used for the classification of eutrophication in the Baltic Sea[
| 富营养化比例ER | 状态 | 分类 | 变化范围 |
|---|---|---|---|
| 0.0≤ER≤0.5 | 没有受到富营养化的影响 | 优 | 与背景值相比没有明显变化 |
| 0.5≤ER≤1.0 | 良 | 略低于目标值 | |
| 1.0≤ER≤1.5 | 受富营养化影响 | 中 | 略高于目标值 |
| 1.5≤ER≤2.0 | 差 | 大部分高于目标值 | |
| ER≥2.0 | 劣 | 显著高于目标值 |
对比上述3种评价方法(表6),综合评价法更侧重于沿岸海域,将评价因子分别归入营养盐富集因子项、直接效应项及间接效应项,在评价过程中按照“一损俱损”原则来确定每项指示因子是否具备富营养化条件。河口富营养化评价法则更侧重于河口系统,评价因子分为压力项、状态项和响应趋势项,根据给定的标准值对3类评价因子进行赋分评判,用评价因子组合矩阵标准判别表来确定目标海域海水富营养化状况和变化趋势,形成优、良、中、差、劣 5 种海水富营养化状况。波罗的海行动计划主要是针对波罗的海海域,该方法结合前2种方法,将评价因子分为3类:营养盐富集因子项、直接效应项及间接效应项,对其中每个因子进行评价,而后按照“一损俱损”的原则,由其中最差项来决定海水的富营养化状况,但是该方法最后会对富营养化评价的可信度进行计算。
表6 第二代海水富营养化评价方法差异表(据参考文献[52,58] 修改)
Table 6 The difference of second generation seawater eutrophication evaluation method (modified after references [52,58])
| 不同点 | 综合评价法 | 河口富营养化评价法 | 波罗的海行动计划 |
|---|---|---|---|
| 评价区域的侧重点 | 侧重于沿岸海域 | 侧重于河口系统 | 侧重于波罗的海海域 |
| 评价因子的侧重点 | 给予致害因素(即营养盐浓度、比值及输入通量)与症状(直接和间接效应)相同的权重 | 给予症状较大权重(初级症状和次级症状)。压力评价只考察人为的溶解态无机氮(DIN)浓度比率而未及其他 | 给予致害因素(即营养盐浓度、比值及输入通量)与症状(直接和间接效应)相同的权重 |
| 评价原则 | 使用“一损俱损”原则,即各类别的分级和最终的定级取决于其中最差级别 | 适用3类(压力—状态—响应)分值的加权综合定级 | 使用“一损俱损”原则,但最后会对评价可信度进行验证 |
| 评价标准的参考值 | 使用区域专属的背景值做为评价的标准,即不同的区域分别有不同的背景值 | 使用统一的评价标准 | 使用统一的评价标准 |
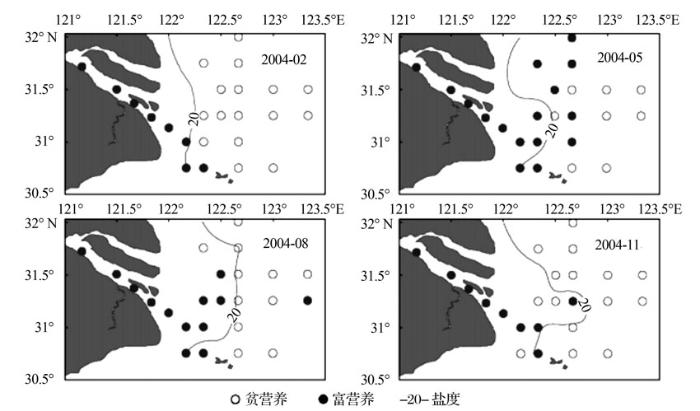
目前我国海洋环境监测或调查项目以常规化学、生物、水文等环境要素为主,很少开展大量的大型藻类、水下植被等生物学要素的调查监测,同时也缺乏浮游植物、底栖动物、鱼类等生物群落结构有关的环境生态要素,因此我国的主要应用的还是第一代海水富营养化评价方法。这种评价方法在我国部分近岸海域早有应用,邹景忠等[33]基于日本海水水质基准利用富营养化指数法,采用1978—1980年耗氧有机物、无机氮和无机磷等调查数据,对渤海湾进行了富营养化程度的等级划分,并结合赤潮生态的生态特点分析了富营养化的原因与赤潮的关系,为防治渤海湾富营养化及赤潮灾害提供了科学依据。营养状态质量法和富营养化指数法是富营养评价常用的2种方法,全为民等[62]根据2000—2002年积累的耗氧有机物、无机氮、无机磷和溶解氧等调查数据,分别利用富营养化指数法和水质指数法对长江口及邻近海域进行了富营养化评价,富营养化状况从西向东、从北向南污染程度逐渐降低,2种评价方法的趋势分布基本相似,可以更全面地体现研究区域的富营养程度。随着调查数据的丰富,叶绿素a、溶解氧等参数也被作为评价海水富营养化的指标,如陈鸣渊等[44]利用模糊数学法,依据我国海水水质标准,采用2004年不同季节的调查数据,综合评价了长江口富营养化水平的季节变化,并与营养状态质量法、富营养化指数法进行了比较,从富营养程度的评价结果和20盐度等值线的分布可以看出长江口冲淡水以及营养盐限制特点等因素对富营养化的影响(图1)。
图1 应用模糊数学法对不同季节长江口的富营养化评价[
Fig.1 Evaluating the eutrophication of Changjiang Estuary in different seasons use fuzzy mathematics[
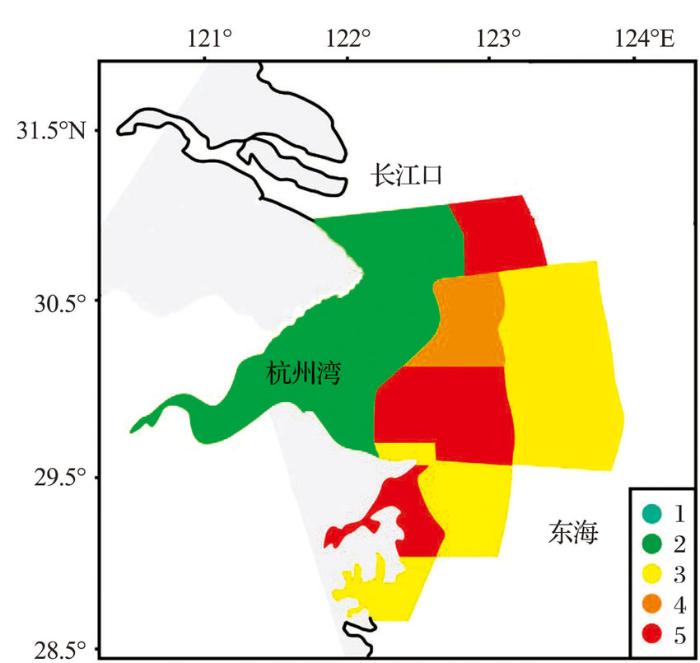
随着近年来我国对富营养化的重视,各大站点的监测数据,现场调查的数据等越来越丰富,以营养盐浓度为基础的第一代富营养化评价方法不能准确地指示出进一步的生态效应的营养盐加富的最差情况[62]。因而近年来,国内一些学者尝试建立第二代富营养化评价方法,如吴迪[64]基于PSR指标框架,全面利用营养物质压力指标、富营养化症状指标、富营养化次级症状指标和富营养化的其他症状的四大类,综合评价了辽宁双台子河典型河口区,结合赤潮实际发生状况统计来看,与评价分级也基本相符,体现了评价结果的可靠性。闭文妮[48]也基于PSR框架,构建了以富营养化症状强弱衡量目标海域富营养化程度的海水富营养化评价方法,对广西沿海的钦州湾、防城湾及铁山湾进行了富营养化评价,评价指标涉及初级生产力、浮游植物群落、水体溶解氧、赤潮、有机物沉积等多类评价范畴,可以避免海湾对营养盐限制不一致造成的富营养化误判,综合给出何种指标更适合于描述海水富营养化症状的强弱。吴在兴[65]构建了基于水质状态和生态响应的富营养化综合评价方法,应用于我国渤海西南部、山东半岛典型海域以及长江口和杭州湾等典型海域,从图2中可以看出应用这种评价方法可以更细化评价结果,形象直观地体现富营养化状况(图2中15分别代表优、良、中、差、劣),结合赤潮发生频率、季节特点以及变化趋势都做出了系统的分析,对认识赤潮灾害暴发的季节特征、陆源排放、防范区域划分都具有很好的指导意义。
图2 应用第二代富营养化评价方法对长江口和杭州湾的富营养化评价[
Fig.2 Evaluation of the eutrophication of Changjiang Estuary and Hangzhou Bay by using the second generation eutrophication evaluation method[
这些研究虽然都从各个方面获得数据和资料,并在不同程度上对第二代富营养化评价方法进行尝试,但是仍有一些缺陷:①虽然尝试用第二代方法,但是底栖动植物的数据资料仍旧缺乏,数据不够完整;②没有考虑富营养化评价的连续性,没有将富营养化评价在现实的海洋监测管理中应用起来,这可能是由于富营养化评价的数据部分来源于巡航实测,数据无法连续引起的。
随着我国沿海地区经济的迅猛增长,河口及近岸海域的人为营养盐输入量急剧增长,过量的营养盐致使水体中藻类过度生长,导致了水质的恶化,妨碍了河口或近岸海域正常开发利用。为了满足我国近岸海域富营养化问题的研究及管理,合理评价目标海域的富营养化程度尤为迫切[65]。并且富营养化评价可以全面掌握富营养化问题的程度和范围,在管理和消除富营养化问题上能优化资源配置、制定正确决策[58]。
综合考虑,第一、二代富营养化评价方法在应用上各有其优缺点:第一代海水富营养化评价方法可以适用于任何空间尺度的富营养化采样点,在时间尺度上一次富营养化调查数据即可指示出海域的营养盐加富状况,便于计算,需要的数据易于获取,缺点是并没有考虑到不同海域对营养盐输入后的响应存在差异性,缺乏对系统表达出来的富营养化症状的考虑[65]。第二代富营养化评价方法考虑的指标体系更加全面,且能代表系统富营养化的不同阶段和程度[1],对比第一代方法更具系统性、合理性,综合评价能力强,缺点是由于数据和方法差异性较大,目标海域沿岸流、潮汐、地理、气候、生物等多种因素导致营养盐限制的复杂性[48]而影响该方法的广泛推行,实施难度较大。因此,在开展海水富营养化评价时,应综合考虑各种影响因素:如果可用于评价的数据在空间和时间尺度的局限性较大,可以采用第一代评价方法;反之,如果目标海域可用于评价的数据是系统全面连续性的,可以根据表征富营养化的症状来综合开展评价,则采用第二代评价方法将具有更显著的指示性价值。
随着未来数据采集能力的增强、研究方法的深入、先进技术的引进,针对我国海域的海水富营养化方法的发展应用将重点关注以下4个方面:
(1)合理开发使用数据是海水富营养化评价方法应用的基础。随着我国在沿岸、近海乃至大洋的长期连续观测和监测能力的提升,包括气象水文、生物化学等数据资料将不断丰富,台站、生态剖面浮标(Bio-Argo)、潜标、航次标准断面站、卫星遥感、水下滑翔机、无人机和无人艇等多平台多设备的集成,以及海洋—地球生物化学数值模式的多年再分析背景场,都将提供大量的数据支持。如果可以将这些数据运用到海水富营养化评价的研究中,那么将对评价体系产生新的认识,可以更综合、更全面、更精细化地掌握目标海域的环境因素和富营养化程度,为赤潮、绿潮等生态灾害的防御提供有效的服务管理决策。
(2)海水富营养化评价应注重海洋生态环境的差异性。海洋生态环境一方面受局地驱动的影响,如风、潮汐和地形等因素,另一方面受外源强迫的调控,如海洋边界的水体交换、河流输入、大气—海洋界面的相互作用等。在多种因素作用下,目标海域富营养化程度也具有显著不同,在开展海水富营养化评价时应针对不同环境特点差异化研究,采用不同方法满足不同需求。
(3)海水富营养化评价应考虑与不断发展的先进技术相结合,例如数值模式再分析数据、大数据挖掘、基于神经网络智能反演、精细化格点计算等。一方面可弥补调查数据的不足以及评价方法的局限性,另一方面可提高评价结果的精细化程度,合理做好区域划分,发展计算结果更科学、结论更便于理解和应用的富营养化评价方法。
(4)海水富营养化评价应重视与实际生产生活的应用性,尤其是与赤潮等生态灾害预警、海洋水质预报、渔业生产评估[66,67]、海洋环境预测等研究领域的结合,满足在近岸、海湾、河口、养殖区、海水浴场等不同需求,完善评价结果的标准化、规范化,为水质监测管理以及海洋生态环境灾害预测防御的提供具有科学依据的指导性建议。
The authors have declared that no competing interests exist.
| [1] |
Application and sensitivity testing of a eutrophication assessment method on coastal systems in the United States and European Union [J].
Abstract The Assessment of Estuarine Trophic Status (ASSETS) screening model has been extended to allow its application to both estuarine and coastal systems. The model, which combines elements of pressure, state and response, was tested on four systems: Maryland Coastal Bays and Long Island Sound in the United States and The Firth of Clyde (Scotland) and Tagus Estuary (Portugal) in the European Union. The overall scores were: Maryland Coastal Bays: Bad; Firth of Clyde: Poor; Tagus Estuary: Good. Long Island Sound was modelled along a timeline, using 1991 data (score: Bad) and 2002 data (score: Moderate). The improvement registered for Long Island Sound is a consequence of the reduction in nutrient loading, and the ASSETS score changed accordingly. The two main areas where developments are needed are (a) In the definition of type-specific ranges for eutrophication parameters, due to the recognition that natural or pristine conditions may vary widely, and the use of a uniform set of thresholds artificially penalizes some systems and potentially leads to misclassification; (b) In the definition and quantification of measures which will result in an improved state through a change in pressures, as well as in the definition of appropriate metrics through which response may be assessed. One possibility is the use of detailed research models where different response scenarios potentially produce changes in pressure and state. These outputs may be used to drive screening models and analyze the suitability of candidate metrics for evaluating management options.
|
| [2] |
Coastal marine eutrophication—A definition, social causes, and future concerns [J]. |
| [3] |
Eutrophication [J]. |
| [4] |
Eutrophication in Coastal Marine Ecosystems: Coastal and Estuarine Studies [M]. |
| [5] |
Second Integrated Report on the Eutrophication Status of the OSPAR Maritime Area[R] . |
| [6] |
Eutrophication in Europe’s Coastal Waters[R] . |
| [7] |
Eutrophication and Its Ecological Effects in the Yangtze Estuary and Its Adjacent Waters[D] .长江口及邻近海域富营养化状况及其生态效应[D] . |
| [8] |
Long-term changes in macrozoobenthos in the Å land archipelago, northern Baltic Sea [J].
Eutrophication is the major threat for marine ecosystems in coastal and archipelago areas of the Baltic Sea. Eutrophication-induced effects on benthic macrofauna were studied over a 30 year period in the 脜land Islands, northern Baltic Sea. This study describes the present soft-bottom community and analyses changes in community structure in definable archipelago zones, and relates them to environmental changes since the 1970s. Similar analyses are made for changes in the benthic communities in the transition zone between the outer archipelago and the open sea over the last decade. Abundance and biomass peaked in the late 1980s after which a general decrease has taken place, but in different ways in the various archipelago zones. This decline seems to be closely linked with local nutrient loads, rather than to the overall trends in the Baltic Sea. A new species in this low-diversity area is the polychaete Marenzelleria viridis, which since its first observation in 1993 has rapidly spread over the entire region and is now among the five most dominant species in the benthic assemblage.
|
| [9] |
The role of nutrient loading and eutrophication in estuarine ecology [J].
Eutrophication is a process that can be defined as an increase in the rate of supply of organic matter (OM) to an ecosystem. We provide a general overview of the major features driving estuarine eutrophication and outline some of the consequences of that process. The main chemical constituent of OM is carbon (C), and therefore rates of eutrophication are expressed in units of C per area per unit time. OM occurs in both particulate and dissolved forms. Allochthonous OM originates outside the estuary, whereas autochthonous OM is generated within the system, mostly by primary producers or by benthic regeneration of OM. The supply rates of limiting nutrients regulate phytoplankton productivity that contributes to inputs of autochthonous OM. The trophic status of an estuary is often based on eutrophication rates and can be categorized as oligotrophic (<100 g C m(-2) y(-1), mesotrophic (100-300 g C m(-2) y(-1), eutrophic (300-500 g C m(-2) y(-1), or hypertrophic (>500 g C m(-2) y(-1). Ecosystem responses to eutrophication depend on both export rates (flushing, microbially mediated losses through respiration, and denitrification) and recycling/regeneration rates within the estuary. The mitigation of the effects of eutrophication involves the regulation of inorganic nutrient (primarily N and P) inputs into receiving waters. Appropriately scaled and parameterized nutrient and hydrologic controls are the only realistic options for controlling phytoplankton blooms, algal toxicity, and other symptoms of eutrophication in estuarine ecosystems.
|
| [10] |
Notes of workshop on a conceptual framework for the assessment of Eutrophication in European waters [J].
|
| [11] |
Pelagic coelenterates and eutrophication: A review [J].
Although eutrophication is a widespread problem in marine waters, its effects are often difficult to separate from normal fluctuations of pelagic coelenterate populations and from other anthropogenic changes due to industrial pollution, construction, introductions, global warming and overfishing. The least complex situations are in small coastal water bodies such as the Caribbean lagoons and Scandinavian fjords. Typically, the diversity of pelagic coelenterates decreases, but the biomass of a small number of species (such as the hydromedusae Aglantha digitale and Rathkea octopunctata and the scyphomedusae Aurelia aurita and Cassiopea spp.) may increase. Adaptations that may allow these species to survive under eutrophic conditions are discussed.
|
| [12] |
Response of aquatic communities to anthropogenic stress: A comparative study of Neva Bay and the eastern Gulf of Finland [J]. |
| [13] |
The planktonic food web structure of a temperate zone estuary. The planktonic food web structure of a temperate zone estuary,its alteration due to eutrophication [J]. |
| [14] |
Marine benthic hypoxia: A review of its ecological effects and the behavioural responses of benthic macrofauna [J].
In this review the effects of hypoxia on benthic fauna are summarized and detailed information is given on (1) the impact on community structure and function in fjords, estuaries, coastal and offshore areas (2) behavioural changes (3) recovery processes (4) ecosystem energy flow implications, and (5) tolerance in experimental studies. There is no other environmental variable of such ecological importance to coastal marine ecosystems that has changed so drastically in such a short period as dissolved oxygen. While hypoxia and anoxic environments have existed through geological time, their occurrence in shallow coastal and estuarine areas appears to be increasing, most likely accelerated by human activities. Ecological problems associated with the occurrence of low oxygen are increasing on a global scale. The oxygen budgets of most major estuarine and coastal ecosystems have been adversely affected mainly through the process of eutrophication, which acts as an accelerant or enhancing factor to hypoxia and anoxia, and when coupled with adverse meteorological and hydrodynamic events, hypoxia increases in frequency and severity. The area of hypoxic and anoxic bottom water is even increasing within systems that historically are considered oxygen stressed. Many ecosystems that are now severely stressed by hypoxia appear to be near or at a threshold. Should oxygen concentrations become slightly lower, catastrophic events may overcome the systems and alter the productivity base that leads to fisheries species. Examples of such events are becoming increasingly common. At what point permanent damage will result is difficult to say. To date there is no large system that has recovered after development of persistent hypoxia or anoxia. The only exception may be small systems where pollution inputs have ceased and recovery initiated from surrounding non-affected areas. The expanding occurrence of hypoxia and anoxia continues to bring about significant structural changes in benthic communities and to affect benthic-pelagic coupling. Restoring ecosystem balance and reversing the trend of increasing hypoxia and anoxia will require dealing with the global problem of coastal eutrophication and determining how to reduce the production of organic matter in sensitive estuarine and coastal areas.
|
| [15] |
Harmful or exceptional phytoplankton blooms in the marine ecosystem [J]. |
| [16] |
A comparative analysis of nutrients and other factors influencing estuarine phytoplankton production [C]// |
| [17] |
Nationwide Review of Oxygen Depletionand Eutrophication in Estuarine and Coastal Waters: Executive Summary[R]. Completion Report Submitted to U.S. Department of Commerce, NOAA, NOS, |
| [18] |
Nitrogen, phosphorus, plankton and oxygen deficiency in the German Bight and in Kiel Bay [J]. |
| [19] |
Nutrient changes in the Mississippi River and system responses on the adjacent continental shelf [J].
The Mississippi River system ranks among the world's top 10 rivers in freshwater and sediment inputs to the coastal ocean. The river contributes 90% of the freshwater loading to the Gulf of Mexico, and terminates amidst one of the United States' most productive fisheries regions and the location of the largest zone of hypoxia, in the western Atlantic Ocean. Significant increases in riverine nutrient concentrations and loadings of nitrate and phosphorus and decreases in silicate have occurred this century, and have accelerated since 1950. Consequently, major alterations have occurred in the probable nutrient limitation and overall stoichiometric nutrient balance in the adjacent continental shelf system. Changes in the nutrient balances and reduction in riverine silica loading to, the continental shelf appear to have led to phytoplankton species shifts offshore and to an increase in primary production. The phytoplankton community response, as indicated by long-term changes in biological uptake of silicate and accumulation of biologically bound silica in sediments, has shown how the system has responded to changes in riverine nutrient loadings. Indeed, the accumulation of biologically bound silica in sediments beneath the Mississippi River plume increased during the past two decades, presumably in response to, increased nitrogen loading. The duration, size, and severity of hypoxia has probably increased as a consequence of the increased primary production. Management alternatives directed at water pollution issues within the Mississippi River watershed may have unintended and contrasting impacts on the coastal waters of the northern Gulf of Mexico.
|
| [20] |
Water quality trends and management implications from a five-year study of a eutrophic estuary [J].
The Neuse River and Estuary, a major tributary of the second largest estuary on the United States mainland, historically has sustained excessive blooms of algae and toxic dinoflagellates, hypoxia, and fish kills. Previous attempts have been made to use short-term databases of 2-3 years, or data sets from infrequent (monthly) sampling, to assess whether nutrient inputs to the Neuse are increasing and supporting higher algal production. These previous efforts also have relied on single-point-determined flow velocity data, at upstream sites remote from the estuary, to estimate the volume of flow in quantifying nutrient loading to the estuary. We completed a five-year study of the Neuse, including a comparative inventory of nutrients to the watershed from point sources and from concentrated animal operations (CAOs) as recent nonpoint sources, as well as an intensive assessment of water quality over time in the mesohaline estuary. Estimates of nutrient loads were based on volume of flow data from shore-to-shore transect cross sections, taken with a boat-mounted acoustic Doppler current profiler at the westernmost edge of the estuary. A total of 441 point dischargers contributed at least 3.34 x 10⁸L effluent/d to the Neuse system, much of which came from municipal wastewater treatment plants (2.03 x 10⁸L effluent/d, excluding periods of plant malfunctions; total annual loadings of at least 9 x 10⁵kg P and 2.1 x 10⁶kg N, with a 17% increase in human population over the past decade). The Neuse basin also included 554 CAOs, with 76% in swine production (1.7 x 10⁶animals, from a 285% increase in the past decade) and 23% in poultry (5.5 x 10⁵animals). An estimated 5.9 x 10⁹kg manure produced by swine and poultry during 1998 contributed 鈭4.1 x 10⁷kg N and 1.4 x 10⁷kg P to the Neuse watershed. About 20% of the area in the watershed now has enough manure from CAOs to exceed the P requirements of all nonlegume crops and forages. About two-thirds of the N- and P-rich feeds for these animals are imported (with 4.0 x 10⁷kg N and 1.6 x 10⁷kg P in 1998); thus, the watershed increasingly has become a nutrient sink. Over the five-year study in the Neuse Estuary study area, P loading significantly declined (by an estimated 14%), whereas TN (total nitrogen) loading significantly increased (by an average of 16%) and TNi(total inorganic nitrogen) increased by 鈭38%. The increased inorganic N (Ni), partly related to severe storms with high precipitation in years 4-5, coincided with a decrease in phytoplankton biomass (as chlorophyll a) that likely reflected displacement/washout of algal populations and cysts. Thus, while both N and P supplies have increased in the watershed, there is evidence for a significant increase in Niloading but, as yet, no apparent signal for increased P in the lower estuary. Weather patterns ultimately control when/whether the elevated Nisupply will support increased algal production, so that estuarine algal blooms, hypoxia, and fish kills will remain difficult, at best, to predict in modeling efforts. We recommend that decadal data sets, with sufficient sampling frequency to capture nutrient loadings from major storm events, be used to assess fluctuations in algal production of lower rivers and estuaries, and relationships with changing nutrient inputs. Given increased N and P supplies in the Neuse watershed from ongoing growth of both human and swine populations, a current management goal of 30% N reduction should be altered to include increased focus on Niand strengthened comanagement of P. As for estuaries in other regions, nutrient reduction goals should be interpreted as "moving targets" that likely will have to be substantially adjusted upward, over time, to accomplish noticeable reductions in algal blooms, hypoxia, and fish kills in the lower Neuse River and Estuary.
|
| [21] |
Interannual variability of PSP (Paralytic Shellfish Poisoning) outbreaks on the north east UK coast. J. Plankton [J]. |
| [22] |
Macroalgal blooms contribute to the decline of seagrass in nutrient-enriched coastal waters [J].
Nutrient over-enrichment of coastal waters has led to widespread decline in seagrass populations worldwide. It has been well documented in numerous observational and experimental studies that this loss is in large part caused by excessive microalgal growth. Phytoplankton biomass (as well as total suspended particles) increases in nutrient-enriched waters and reduces light penetration through the water column to benthic plant comnnmities (e.g. Kemp et al. 1983, Monbet 1992, Johansson and Lewis 1992, Moore et al. 1996). Epiphytic microalgae also become more abundant on seagrass leaves in eutrophic waters and contribute to light attenuation at the leaf surface (e.g. Borum 1985, Twilley et al. 1985, Short et al. 1995), as well as to reduced gas and nutrient exchange (Sand-Jensen 1977). The result of light interception by these fast-growing alga taxa is a decrease in the maximum depth limit and areal coverage of seagrasses (Dennison et al. 1993, Duarte 1995, Krause-Jensen et al. 2000).
|
| [23] |
Nutrient enrichment of estuarine submersed vascular plant communities. I. Algal growth and effects on production of plants and associated communities [J].
ABSTRACT: Eight experimental ponds containing submersed vascular plants (predominantly Potamogeton perfoliatus and Ruppja maritirna) were subjected in duplicate to 4 levels (including controls) of fertilization from J u n e to August 1981. Seston a n d phytoplankton chlorophyll a increased with fertilization, and pronounced algal blooms were evident under high dosage. Of the total seston. phytoplankton exerted the greatest influence on attenuation of photosynthetically active radiation (PAR), such that there was insufficient light for submersed vascular plant growth at the sediment surface during bloonls. An extensive epiphytic community developed on plants in all nutrient-treated ponds at densities similar to those observed in nature on senescent plants. At high nutrient treatments the accumulation of epiphytic material resulted in > 80 % attenuation of the incident radiation at the leaf surface. Biomass of submersed macrophytes decreased significantly under high a n d medium nutrient treatments compared to control and low treatments within 60 d following initial fertilization. Apparent production of vascular plants (based on oxygen production and I4C-bicarbonate uptake) was reduced at the higher nutrient treatments for both R. maritirna and P. perfoliatus. Most of this reduction in macrophyte photosynthesis could be explained by attenuation of PAR associated with epiphytic material. However, without PAR attenuance in the overlying water, observed levels of epiphytic growth would be insufficient to reduce light below compensation levels needed to sustain vascular plant growth. At the high fertilization rates, integrated primary production of pond communities was significantly reduced with the loss of the vascular plants, even though phytoplankton and epiphytic growth were enhanced.
|
| [24] |
New ‘phantom’ dinoflagellate is the causative agent of major estuarine fish kills [J].
Abstract A worldwide increase in toxic phytoplankton blooms over the past 20 years has coincided with increasing reports of fish diseases and deaths of unknown cause. Among estuaries that have been repeatedly associated with unexplained fish kills on the western Atlantic Coast are the Pamlico and Neuse Estuaries of the southeastern United States. Here we describe a new toxic dinoflagellate with 'phantom-like' behaviour that has been identified as the causative agent of a significant portion of the fish kills in these estuaries, and which may also be active in other geographic regions. The alga requires live finfish or their fresh excreta for excystment and release of a potent toxin. Low cell densities cause neurotoxic signs and fish death, followed by rapid algal encystment and dormancy unless live fish are added. This dinoflagellate was abundant in the water during major fish kills in local estuaries, but only while fish were dying; within several hours of death where carcasses were still present, the flagellated vegetative algal population had encysted and settled back to the sediments. Isolates from each event were highly lethal to finfish and shellfish in laboratory bioassays. Given its broad temperature and salinity tolerance, and its stimulation by phosphate enrichment, this toxic phytoplankter may be a widespread but undetected source of fish mortality in nutrient-enriched estuaries.
|
| [25] |
Towards Integrated Modelling and Analysis in Coastal Zones: Principles and Practices, LOICZ Reports and Studies [M]. |
| [26] |
Managing nutrient fluxes and pollution in the Baltic: An interdisciplinary simulation study [J].
This interdisciplinary paper reports the results of a study into the costs and benefits of eutrophication reduction in the Baltic Sea. A large multidisciplinary team of natural and social scientists estimated nutrient loadings and pathways within the entire Baltic drainage basin, together with the costs of a range of abatement options and strategies. The abatement cost results were compared with clean-up benefits on a basin-wide scale, in order to explore the potential for international agreements among the countries which border the Baltic. Most countries would seem to gain net economic benefits from the simulated 50% nitrogen and phosphorus reduction policy.
|
| [27] |
Eutrophication and some European waters of restricted exchange [J].
Regions of Restricted Exchange (RREs) are an important feature of the European coastline. They are historically preferred sites for human settlement and aquaculture and their ecosystems, and consequent human use, may be at risk from eutrophication. The OAERRE project (EVK3-CT1999-0002) concerns ‘Oceanographic Applications to Eutrophication in Regions of Restricted Exchange’. It began in July 2000, and studies six sites. Four of these sites are fjords: Kongsfjorden (west coast of Spitzbergen); Gullmaren (Skagerrak coast of Sweden); Himmerfj01rden (Baltic coast of Sweden); and the Firth of Clyde (west coast of Scotland). Two are bays sheltered by sand bars: Golfe de Fos (French Mediterranean); and Ria Formosa (Portuguese Algarve). Together they exemplify a range of hydrographic and enrichment conditions. The project aims to understand the physical, biogeochemical and biological processes, and their interactions, that determine the trophic status of these coastal marine RRE through the development of simple screening models to define, predict and assess eutrophication. This paper introduces the sites and describes the component parts of a basic screening model and its application to each site using historical data. The model forms the starting point for the OAERRE project and views an RRE as a well-mixed box, exchanging with the sea at a daily rate E determined by physical processes, and converting nutrient to phytoplankton chlorophyll at a fixed yield q. It thus uses nutrient levels to estimate maximum biomass; these preliminary results are discussed in relation to objective criteria used to assess trophic status. The influence of factors such as grazing and vertical mixing on key parameters in the screening model are further studied using simulations of a complex ‘research’ model for the Firth of Clyde. The future development of screening models in general and within OAERRE in particular is discussed. In addition, the paper looks ahead with a broad discussion of progress in the scientific understanding of eutrophication and the legal and socio-economic issues that need to be taken into account in managing the trophic status of RREs.
|
| [28] |
Comparison of the fuzzy comprehensive evaluation model of seawater quality [J].海水水质的模糊综合评价模型的比较 [J]. |
| [29] |
Recent Trend Variations of Oceanological Parameters in the Baltic Sea-Proc XIII Conf. Baltic Oceanographers [M]. |
| [30] |
Marine eutrophication studies in Sweden [J].
ABSTRACT Ambio, ISSN 0044-7447, vol. 19, nr. 3, 102-108 This article summarizes the eutrophication of two sea areas: 1) the Baltic Sea and in particular a coastal area which is affected primarily by effluents from a tertiary sewage plant; and 2) the Kattegat and in particular the Laholm Bay, which is affected primarily by nutrient inputs from agriculture and forest land. During this decade, inputs of N and P to these larger sea areas have increased by factors of approximately 4 to 6 and >8, respectively. Internal nutrient transport and atmospheric deposition is discussed. It is concluded that N availablility generally limits primary production, except in the Bothnian Bay, where P has this role. P is, however, the limiting factor at times in some coastal areas, and in the Baltic for N-fixing blue-green-algae, which bloom in warm summers when low N/P ratios prevail. Noted eutrophication effects are localized elevated primary production, decreased depth distribution and species richness of macroalgae. Eutrophication is most likely a stimulus to high benthic infaunal biomass and fish biomass in well ventilated sea areas. Other areas suffer today from almost permanent (the Baltic proper) or seasonal (the Kattegat) hypoxia with devastating effects on benthos and demersal fish. The N cycle and futuer possible consequences in relation to nutrient input are discussed. It is concluded that a reduction by at least half of external N and P inputs to the Baltic Sea, and of N inputs to the Kattegat is needed to mitigate the negative effects of eutrophication.
|
| [31] |
et al. Environmental characteristics and eutrophication of seawater assessment in spring and summer of 2013 Laizhou Bay [J].2013年春夏季莱州湾海水环境要素特征和富营养化评估 [J].
根据2013年5(春季)、8月(夏季)莱州湾海水环境要素的调查资料,采用富营养化指数、潜在性富营养化评价模式和灰色聚类分析方法研究环境要素特征和评估海水富营养化状况。结果表明,无机氮是莱州湾水质的主要污染要素,春夏季的N/P平均值分别为100.76、117.84,潜在性富营养化评价模式结果表明,春夏季各站位的营养级均只包括Ⅳ_P、Ⅵ_P两类,磷限制为莱州湾的营养盐结构特征;富营养化指数评价结果表明,春季和夏季E1站位比例分别为65%、20%;灰色聚类分析结果表明,春季Ⅱ级、Ⅲ级的站位比例分别为95%、5%,夏季Ⅱ、Ⅲ级的站位比例分别为70%、25%,Ⅱ级中的部分站位具有较大潜在富营养化风险。
|
| [32] |
The Pollution of Shallow Sea and the Occurrence of Red Tide, Mechanism of the Occurrence of Red Tide in Inner Bay[Z] .浅海的污染与赤潮的发生,内湾赤潮的发生机制[Z] . |
| [33] |
A preliminary discussion on eutrophication and red tide in Bohai Bay [J].渤海湾富营养化和赤潮问题的初步探讨 [J]. |
| [34] |
The role of eutrophication in the global proliferation of harmful algal blooms: New perspectives and new approaches [J].
Between 1995 and 1997, we performed Isshiki's original method of arytenoid adduction alone or as an adjunct to type I thyroplasty for the treatment of unilateral vocal fold paralysis. From 1997 onward, we performed arytenoid adduction by traction of the lateral cricoarytenoid muscle (Iwamura's method), because it reduces discomfort to the patient and avoids rotation of the thyroid cartilage. Preliminary experiments and surgical procedures involving traction of the lateral cricoarytenoid muscle are described. Of 21 patients with a maximum phonation time of less than 9 seconds, 14 underwent type I thyroplasty as an adjunct to our method of arytenoid adduction and 7 underwent arytenoid adduction alone. Sixteen patients (76%) were able after surgery to extend their maximum phonation time beyond 10 seconds; this result compares favorably with the results of Isshiki's original adduction technique. We describe useful anatomic landmarks for approaching the lateral cricoarytenoid muscle in the hope that more voice surgeons will adopt this approach in the treatment of unilateral vocal fold paralysis.
|
| [35] |
Effect of water residence time on annual export and denitrification of nitrogen in estuaries: A model analysis [J].
A simple model of annual average response of an estuary to mean nitrogen loading rate and freshwater residence time was developed and tested. It uses nitrogen inputs from land, deposition from the atmosphere, and first-order calculations of internal loss rate and net export to perform a steady-state analysis over a yearly cycle. The model calculates the fraction of total nitrogen input from land and the atmosphere that is exported and the fraction that is denitrified or lost to other processes within the estuary. The model was tested against data from the literature for 11 North American and European estuaries having a wide range of physical characteristics, nitrogen loading rates, and geographical and climatic settings. The model shows that the fraction of nitrogen entering an estuary that is exported or denitrified can be predicted from the freshwater residence time. The first-order rate constant for nitrogen loss within an estuary, as a fraction of total nitrogen in the water column, is 0.30 mo 鈭1 . Denitrification typically accounts for 69鈥75% of the total annual net nitrogen removal from the water column by processes within the estuary. The model makes explicit the dependence of nitrogen concentration in the water column on the loading rate of nitrogen, water residence time, estuary volume, and the rate constant for loss within the estuary.
|
| [36] |
Our evolving conceptual model of the coastal eutrophication problem [J]. |
| [37] |
Evaluation of the potential eutrophication of China’s offshore waters [J].中国近岸海域潜在性富营养化程度的评价 [J]. |
| [38] |
Meizhou bay marine nutrition status evaluation [J].湄洲湾海域营养状态评价 [J]. |
| [39] |
Analysis of the trend of water quality and eutrophication in the deep waters bay of Yangshan [J].洋山深水港海域水质变化趋势分析及富营养化评价 [J].
为阐明港口建设及外来船舶增加对洋山深水港海域水环境特征的影响,系统分析了2010年洋山 深水港大洋山、小洋山海域两个监测点水环境因子的周年变化,采用单因子标准指数评价法、多参数水质综合评价法、营养状态质量指数法、富营养指数法和有机污 染评价指数法分别对其水质现状进行了评价,同时分析了各站点Si∶N∶P比和潜在性富营养化程度。富营养化状态质量指数(NQ)I值在1.95~3.72 范围内,平均值为2.67,属中营养型;营养指数(E)I值在8.63~72.05之间,平均值为34.01,属富营养型;有机污染指数(A)值在 1.89~4.10之间,平均值为2.91,属轻度污染;潜在性富营养化评价结果显示,洋山深水港海域全年无机氮(DIN)、活性磷酸盐 (PO43--P)及活性硅酸盐(SiO32--S)i的平均浓度分别为40.71μmol/L、1.94μmol/L、37.86μmol /L,Si∶N、Si∶P和N∶P的比值分别为0.94、21.76和23.30,其中PO43--P含量相对不足,为潜在限制性因子。因此,综合考虑海 水评价要素,采用多种方法对调查海域进行评价,将更为科学。
|
| [40] |
et al. A preliminary study on the degree of eutrophication of coastal Zhejiang [J].浙江沿海富营养化程度的初步探讨 [J]. |
| [41] |
A possible method for evaluating oligotrophy and eutrophication based on nutrient concentration scales [J].
A statistical analysis of inorganic nutrient data (P-PO 4 , N-NO 3 , N-NO 2 , N-NH 3 ) has been made for scaling aquatic systems into oligotrophic, mesotrophic and eutrophic water types. The data derived from: (a) inshore and offshore waters of Saronicos Gulf and (b) from nearshore and offshore waters of the Island of Rhodes, Aegean Sea. The procedure followed was the application of the frequency distribution analysis to transformed data and development of nutrient concentration scales on the basis of probabilistic parameters. This procedure might be used to make predictions related to forecasting and evaluation of water quality standards.
|
| [42] |
Simple oxygen index for trophic state description [J].
Abstract The trophic state of a coastal marine ecosystem can be easily described by a simple oxygen index: Euclidean distance between the oxygen surplus at the surface and the oxygen deficit at the bottom. Basically, the oxygen index measures the oxygen inbalance within the water column which is a consequence of the growth and decay of organic matter; it increases with the increasing primary production at the surface and increasing benthic respiration while decreases with the decreasing stability of the water column. An analysis of the oxygen data collected in the northern Adriatic Sea between 1911 and 1982 shows that the increasing oxygen index fairly describes the occurrence of eutrophic conditions in time and space.
|
| [43] |
Evaluation of eutrophication level in the Yangtze Estuary and its adjacent waters [J].长江口及其邻近海域富营养化水平评价 [J].
根据2004年4个季度2、5、8、11月的调查资料,选择化学耗氧量、溶解氧、活性磷酸盐、溶解无机氮和叶绿素a作为评价因子,利用人工神经网络模型对长江口及其邻近海域的营养水平进行评价。结果表明,富营养化区域主要集中在口门附近,富营养化程度由口门向东和东北方向递减。富营养化范围几乎均分布在盐度小于20的一侧,并随着长江冲淡水的变化而发生季节性的变化。5月和8月的富营养化比较严重,且都有转向东北的趋势,可能与5月进入丰水期长江冲淡水转向有关。断面分布表明,各个季度月由河口向东,富营养化评价等级由高到低,垂直方向则呈现复杂的变化。分析表明影响富营养化的主要评价指标是溶解无机氮。
|
| [44] |
et al. Evaluating the eutrophication of the Yangtze Estuary in fuzzy comprehensive method [J].利用模糊综合方法评价长江口海水富营养化水平 [J].
根据2004年4个季度的调查数据,以化学需氧量(COD)、溶解无机氮(DIN)、磷酸盐(PO4-P)、叶绿素a(Chl-a)和溶解氧(DO)作为评价指标,运用模糊综合评价模型对长江口海域海水富营养化水平进行评价。结果表明,约有一半的调查站点呈现富营养化,长江口门及冲淡水区(122.5°E以西)富营养化程度较高,外海(122.5°E以东)富营养化程度较低,富营养程度从外海向近岸增加。富营养化区域全年大部分都分布于盐度小于20的一侧,呈明显的季节分布和区域分布,表明长江口海域的富营养化水平主要受到长江冲淡水的控制。
|
| [45] |
The entropy weight of fuzzy evaluation factor and its application in water quality evaluation [J].模糊评价因子的熵权法赋权及其在水质评价中的应用 [J].
针对模糊综合评价方法中对多因子赋权时计算繁琐、工作量大、未考虑多个评价对象间联系等缺陷,提出利用熵权法对多评价目标因子赋权的新思路.利用三峡库区城市江段13个监测断面的水质监测数据,比较了利用熵权法与传统的评价因子赋权的差异.结果表明,当涉及多个评价对象时,采用熵权法对各因子赋权,只需1次计算即可,无需对每个监测点进行权重计算,从而使模糊评价过程大大简化,评价的结果客观、合理.
|
| [46] |
The application of nutrient index method in the evaluation of eutrophication in the cold lake [J].营养度指数法在寒地湖泊富营养化评价中的应用 [J]. |
| [47] |
Evaluate the eutrophication of the sea use phytoplankton community structure index [J].应用浮游植物群落结构指数评价海域富营养化 [J].
探讨了浮游植物对海水富营养化程度的指示作用,并用浮游植物群落结构指数对天津近岸海域的富营养化水平进行了现状评价,结果表明,天津近岸海域水质基本属中营养水平,但某些站位在有些季节呈严重的富营养水平,并呈现枯水期和丰水期高,平水期低的特征,与化学指标的评价结果相比,结果基本一致,说明该方法是可行的,特别是当浮游植物大量繁殖,消耗了大量的营养盐,生物学指标更能正确合理地进行水质评价
|
| [48] |
The Application of the Second Generation Seawater Eutrophication Evaluation Method in the Coastal Waters of Guangxi[D] .第二代海水富营养化评价方法在广西近岸海域的应用[D] . |
| [49] |
Effects of nutrient enrichment in the nation’s estuaries: A decade of change [J].
An updated assessment of nutrient related impacts in US estuaries was completed in 2007. This assessment evaluates three components for each estuary: the influencing factors (e.g. land use, nutrient loads), the overall eutrophic condition (e.g. chlorophyll a, presence of nuisance/toxic algae and macroalgae, extent of dissolved oxygen problems, loss of submerged aquatic vegetation), and future outlook. Eutrophication is a widespread problem with 65% of assessed systems showing moderate to high level problems. The most impacted region was the mid-Atlantic. The majority of estuaries assessed, with the exception of North Atlantic systems (Cape Cod north to Maine), are highly influenced by human related activities that contribute to land-based nutrient loads. Conditions were predicted to worsen in 65% and to improve in 19% of the assessed estuaries in the future. Analysis of the extent of change from the early 1990s to the early 2000s, for those systems for which sufficient data were available, shows that conditions mostly remained the same (32 of 58 systems) though changes were observed in several smaller systems; 13 systems improved and 13 systems worsened. Chlorophyll a and HAB impacts have increased in the mid-Atlantic region, the only region with data adequate for comparison. These symptoms are more prevalent in systems with longer residence times, such as coastal lagoons. The successful restoration of seagrass in Tampa Bay is encouraging though future management to sustain the recovery will be difficult given expected population increases. This national assessment illustrates the need for coordinated and integrated action that balances management action, efficient monitoring to assess the effectiveness of the management, focused research, and a communication campaign aimed at engaging the broader community.
|
| [50] |
Eutrophication Status of the OSPAR Maritime Area.Eutrophication Status of the OSPAR Maritime Area Electronic file [Z/OL]. |
| [51] |
et al. Pollution condition of petroleum hydrocarbon pollutant and estimation of its environmental capacities in summer in the Bohai Sea [J].URL 摘要
The pollution condition of petroleum hydrocarbon (PH) was summarized in the Bohai Sea in this paper. The results showed that the mean concentration of PH was (25.713.6)mg/m3, varying from 4.4 to 64.8 mg/m3 in the survey sea area. Laizhou Bay and Bohai Bay have been contaminated badly inshore. The dynamic model for distribution of marine PH among multiphase environments in the Bohai Sea has been established. The environmental capacities (ECo) and surplus environmental capacities (SECo) of PH have been estimated in the Bohai Sea according to the dynamic model. The results showed that the ECo separately were about 29 169 t/a, 177 306 t/a and 298 446 t/a under the first, second and third, fourth class seawater quality standards requirement. And the ECo of Bohai Bay, Liaodong Bay, Laizhou Bay and Central Bohai Sea were about 5 255 t/a, 8 869 t/a, 4889 /a and 10 156 t/a respectively under the first and second class seawater quality standards requirement.
|
| [52] |
The Change Trend of Eutrophication in the Recent 30 Years in Changjiang Estuary and Adjacent Waters and Its Relationship with Red Tide and the Control Strategy[D] .
长江口及邻近海域富营养化近30年变化趋势及其与赤潮发生的关系和控制策略[D] .
|
| [53] |
National Estuarine Eutrophication Assessment[R] . |
| [54] |
An integrated methodology for assessment of estuarine trophic status [J].
The present approach has been intercalibrated with the original NEEA work, for five widely different U.S. estuaries (Long Island Sound, Neuse River, Savannah River, Florida Bay and West Mississippi Sound) with good results. ASSETS additionally aims to contribute to the EU Water Framework Directive classification system, as regards a subset of water quality and ecological parameters in transitional and coastal waters.
|
| [55] |
Eutrophication in the Baltic Sea: An integrated thematic assessment of eutrophication in the Baltic Sea region [C]// |
| [56] |
Eutrophication status of the Baltic Sea 2007-2011—A concise thematic assessment [C]∥ |
| [57] |
Recent developments in assessment methodology reveal that the Baltic Sea eutrophication problem is expanding [C]// |
| [58] |
Assessment of marine benthic quality change in gradients of disturbance: Comparison of different Scandinavian multi-metric indices [J].
Three multi-metric benthic macrofauna indices were used to assess marine benthic ecological quality status (EcoQS) according to the European Water Framework Directive, in seven pollution gradients mainly, western Scandinavia. The impacts included organic load, hypoxia, metals, urban effluents and physical disturbance. The indices responded in a similar threshold fashion, irrespective of impact factor identity. Usually, the border between and and EcoQS, and the 5th percentile of these data, was defined as the G/M border. Estimated G/M borders compared well with previous studies.
|
| [59] |
Confidence rating of eutrophication status classification [J].
We report the development of a methodology for assessing confidence in ecological status classifications. The method presented here can be considered as a secondary assessment, supporting the primary assessment of eutrophication or ecological status. The confidence assessment is based on scoring the quality of the indicators on which the primary assessment is made. This represents a first step towards linking status classification with information regarding their accuracy and precision. Applied to an existing data set used for assessment of eutrophication status of the Baltic Sea (including the Kattegat and Danish Straits) we demonstrate that confidence in the assessment is Good or High in 149 out of 189 areas assessed (79%). Contrary to our expectations, assessments of the open parts of the Baltic Sea have a higher confidence than assessments of coastal waters. We also find that in open waters of the Baltic Sea, some biological indicators have a higher confidence than indicators representing physical鈥揷hemical conditions. In coastal waters, phytoplankton, submerged aquatic vegetation and indicators of physical鈥揷hemical conditions have a higher confidence than indicators of the quality of benthic invertebrate communities. Our analyses also show that the perceived weaknesses of eutrophication assessments are due more to Low confidence in reference conditions and acceptable deviations, rather than in the monitoring data.
|
| [60] |
Commission Decision of 1 September 2010 on Criteria and Methodological Standards on Good Environmental Status of Marine Waters [M]. |
| [61] |
Approaches and methods for eutrophication target setting in the Baltic Sea region [C]// |
| [62] |
Evaluation and analysis of the current situation of eutrophication and change in Changjiang Estuary and adjacent waters [J].长江口及邻近水域富营养化现状及变化趋势的评价与分析 [J]. |
| [63] |
Comparison of five methods for assessing impacts of nutrient enrichment using estuarine case studies [J].
There are several approaches for assessing nutrient enrichment impacts in marine waters including the OSPAR* Comprehensive Procedure, the TRIX* ranking process, the WFD, ASSETS* and EPA NCA*. They differ in definitions and application, but all use key indicators for evaluating eutrophication status. Data from two estuaries in the United Kingdom (UK) were used to test the hypothesis that these five methods would result in the same outcome. The intent is to provide managers with information for selecting an appropriate method, insight about how each method works, how results from different methods compare and a basis for improvement of methods. Results from all approaches indicate that both estuaries required management intervention, but detailed results differed. Methods using more than one biological indicator show that secondary biological impacts were minimal, with the exception of moderate macroalgal problems in the Medway. Comparison of final results was difficult due to differences in: timeframes of data analysis (seasonal versus annual), characteristics included in indicator metrics (concentration, spatial coverage, frequency of occurrence), and methods for combining indicators to determine eutrophication status. This comparison suggests that use of annual data, inclusion frequency of occurrence, spatial coverage and, secondary biological indicators in the index, and a multi-category rating scale results in a more representative assessment.
|
| [64] |
Study on the Comprehensive Evaluation Method of Eutrophication in Estuarine and Inshore Waters Based on PSR Framework[D] .基于PSR框架的河口及近岸海域富营养化综合评价方法研究[D] . |
| [65] |
The Characteristics of Eutrophication, Evaluation Method and Its Application in Typical Waters of China[D] .我国典型海域富营养化特征、评价方法及其应用[D] . |
| [66] |
Integration of ecosystem-based models into an existing interactive web-based tool for improved Aquaculture decision-making [J].
The integration of the Farm Aquaculture Resource Management (FARM) model ( http://www.farmscale.org ) into the U.S. state of Connecticut's Aquaculture Mapping Atlas ( http://seagrant.uconn.edu/whatwedo/aquaculture/shellmap.php ) was tested in three geographically distinct waterbodies within Connecticut (CT) waters of Long Island Sound. Nearshore waters within the towns of Mystic, Milford, and Westport were selected as pilot locations to determine usability and capability of the combined tools. Data from two long-term offshore sampling stations adjacent to existing shellfish leases were used to test spatial and temporal sampling variability impacts on model results. Partnerships with local monitoring programs and growers were important for acquisition of water quality data, oyster measurement data, and information about local culture practices. All sites were deemed suitable for oyster aquaculture based on model results that predicted Moderate to High growth based on estimated time to reach harvest size from one in (2.54聽cm) seed oysters ( Crassostrea virginica ). Time to harvest varied from 282聽days (High growth) to 645聽days (Moderate growth) among the 22 stations in the three nearshore sites, and 724鈥956聽days (Moderate growth) at the two offshore sites. Results from the two long-term offshore stations indicate that data from the same year must be used when comparing production-based suitability of sites. Addition of potential production estimates improved the ability to select between suitable mapping-based sites. This mapping and modeling combination should be encouraged to provide a strong basis for successful siting and expansion of aquaculture while minimizing user conflict and adverse environmental interactions. This approach may be particularly useful in waterbodies where shellfish aquaculture is possible but is not well established.
|
| [67] |
et al. The development and application of the global operational oceanographic forecasting system in China [J].中国全球业务化海洋学预报系统的发展和应用 [J].
中国全球业务化海洋学预报系统是国家海洋环境预报中心在国内首次构建的全球—大洋—近海3级嵌套的全球业务化海洋学预报系统体系,系统稳定高效业务运行,通过多种方式实时提供和发布全球多尺度多要素的海流、海浪、海温、海冰、海面风场等预报产品,实现了全球海域范围内从百公里级到公里级空间分辨率的一体化预报业务全覆盖。全球业务化海洋学预报系统从全球尺度、大洋尺度到中国周边海域包括8个子系统:全球海面风场数值预报子系统、全球海洋环流数值预报子系统、全球海浪数值预报子系统、全球潮汐潮流数值预报子系统、印度洋海域海洋环境数值预报子系统、极地海冰数值预报子系统、中国周边海域精细化海洋环境数值预报子系统、全球海洋环境预报业务化集成支撑子系统。该系统紧密结合我国经济社会发展和军事保障需求,在“雪龙号”极地遇险脱困预报保障、马航MH370失联飞机搜救预报保障、“蛟龙号”多次深潜海试预报保障、日本福岛“3.11”地震海啸核泄影响评估等重大事件的预报保障任务中发挥了至关重要的作用,为我国实施海洋强国战略,维护国家海洋权益、保障涉海安全生产、应对海上突发事件等提供有力的科技支撑。
|

/
| 〈 |
|
〉 |
