


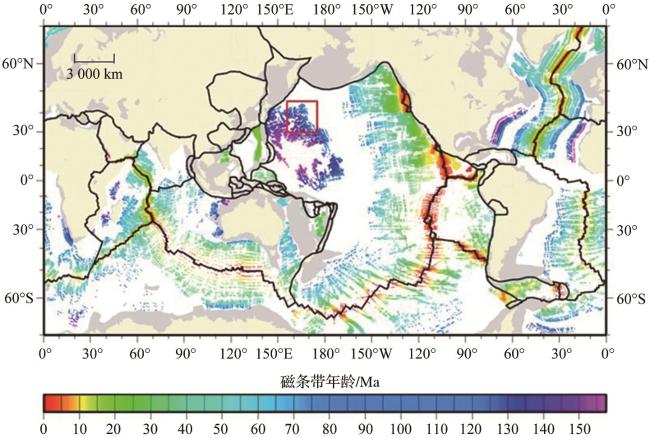
1 海底磁异常条带背景介绍
2 磁条带识别方法发展动态
3 沙茨基海隆地质概况
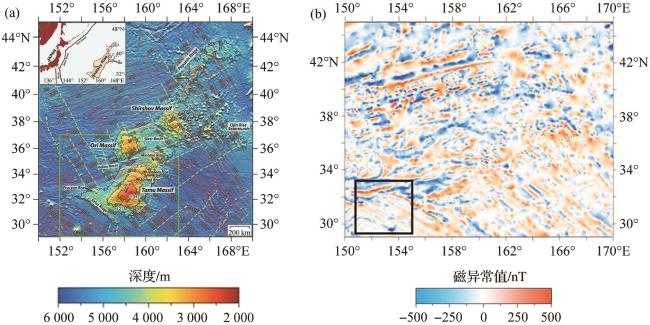
图2 沙茨基海隆区域[24-27](a)位置图:红线是磁条带,黄色虚线是断裂带,绿色框为沙茨海隆上最大的高地大塔穆火山的分布区域;(b)地磁异常图:黑色框指示图4切割的局部区域所在位置(29°4′~33°20′N,150°40′~154°56′E)。 (a) Location map: the red lines represent magnetic stripes, the yellow dashed lines denote fracture zones, the green box marks the distribution area of the Tamu Massif, the largest edifice within Shatsky Rise; (b) Magnetic anomaly map: the black box indicates the location of Figure 4 (29°4′~33°20′N,150°40′~154°56′E). |
4 数据与方法
4.1 数据与预处理
4.2 U-Net卷积神经网络架构
5 模型训练与预测结果
5.1 磁条带完全已知的预测模型
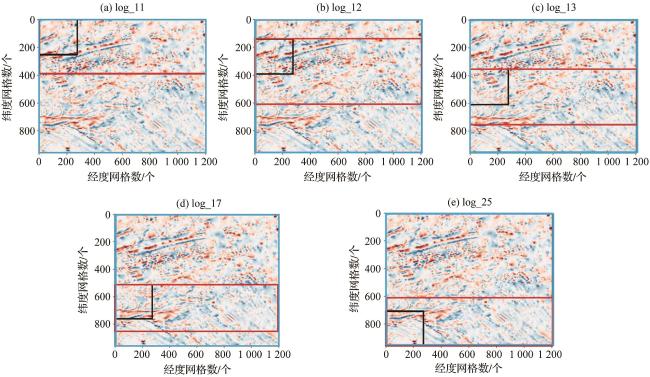
图3 磁条带完全已知的数据集分布图(a)子区域一模型log_11;(b)子区域二模型log_12;(c)子区域三模型log_13;(d)子区域四模型log_17;(e)子区域五模型log_25。蓝框为训练集区域,5个模型的训练集均为沙茨基海隆整体区域,红框为预测集区域,随着子区域的变化,预测集区域在逐渐向下平移,黑框为分割窗口大小,选取不同子区域黑框所在行的模型预测结果整合成最终磁条带预测图,横纵坐标网格单位长度为经纬度的1'。 Fig. 3 Distribution map of the dataset with fully known magnetic stripes (a) Subregion 1 model log_11; (b) Subregion 2 model log_12; (c) Subregion 3 model log_13; (d) Subregion 4 model log_17; (e) Subregion 5 model log_25. The blue boxes indicate the training set areas—the training set for all five models covers the entire Shatsky Rise region. The red boxes denote the prediction set areas, which shift gradually downward across the subregions. The black boxes represent the segmentation window size. Predictive results from models corresponding to the row in which the black box is located in each subregion are integrated to generate the final magnetic stripe prediction map. The grid units along the horizontal and vertical axes represent 1 arc-minute of latitude and longitude. |
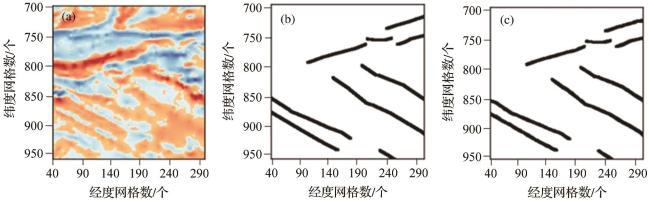
图4 沙茨基海隆局部区域(a)地磁异常网格图;(b)人工识别磁条带标签;(c)模型log_25预测结果。图(a)具体位置为29°4′~33°20′N,150°40′~154°56′E,与图2(b)中的黑色方框所在区域相对应,横纵坐标的单位长度为经纬度的1'。 Fig. 4 Local area of Shatsky Rise (a) Gridded magnetic anomaly map; (b) Manually identified magnetic stripe labels; (c) Prediction results from model log_25. The area shown in (a) corresponds to 29°4′~33°20′N,150°40′~154°56′E, marked by the black box in Figure 2(b). The grid units along both axes represent 1 arc-minute in latitude and longitude. |
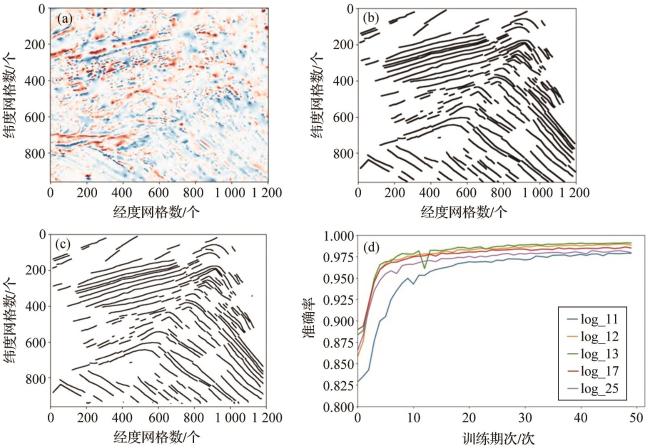
图5 沙茨基海隆磁条带完全已知对比图(a)地磁异常网格图;(b)人工识别磁条带标签;(c) 模型预测结果;(d)不同模型预测准确率。 Fig. 5 Comparative chart of the fully known magnetic stripes in Shatsky Rise (a) Gridded magnetic anomaly map; (b) Manually interpreted magnetic stripe labels; (c) Model prediction results; (d) Prediction accuracy of different models. |
5.2 磁条带部分已知的预测模型
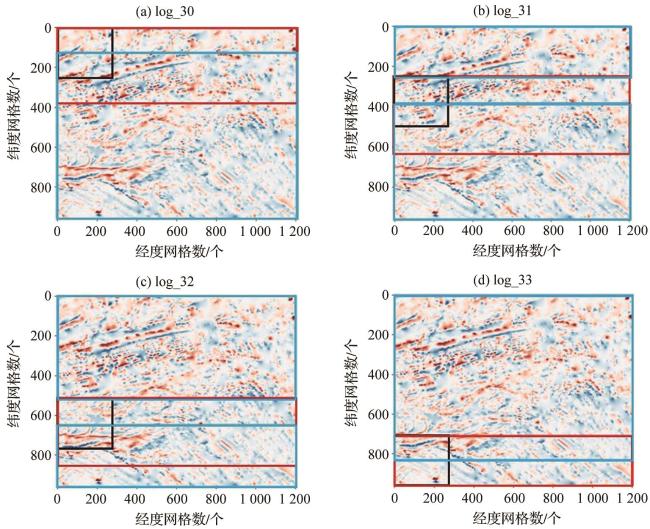
图6 磁条带部分已知的数据集分布图(a)子区域一模型log_30;(b)子区域二模型log_31;(c)子区域三模型log_32;(d)子区域四模型log_33; 蓝框为训练集区域,红框为预测集区域,黑框为分割窗口大小,选取不同子区域黑框所在行的模型预测结果整合成最终磁条带预测图,横纵坐标网格单位长度为经纬度的1'。 Fig. 6 Distribution map of the dataset with partially known magnetic stripes (a)Subregion 1 model log_30; (b)Subregion 2 model log_31; (c) Subregion 3 model log_32; (d) Subregion 4 model log_33. The blue boxes indicate the training set areas, the red boxes represent the prediction set areas, and the black boxes denote the segmentation window size. The model prediction results from the row where the black box is located in different subregions are integrated to form the final magnetic stripe prediction map. The grid units along the horizontal and vertical axes represent 1 arc-minute of latitude and longitude. |
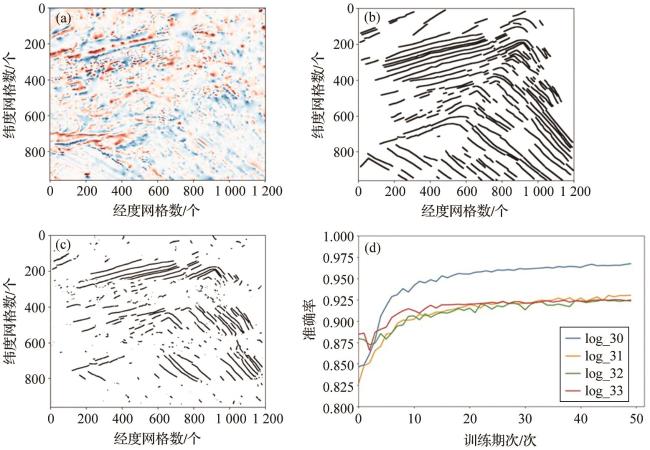
图7 沙茨基海隆磁条带部分已知对比图(a)地磁异常网格图;(b)人工识别磁条带标签;(c) 模型预测结果;(d)不同模型预测准确率。 Fig. 7 Comparative chart of the partially known magnetic stripes in Shatsky Rise (a) Gridded magnetic anomaly map; (b) Manually interpreted magnetic stripe labels; (c) Model prediction results; (d) Prediction accuracy of different models. |
5.3 磁条带完全未知的预测模型
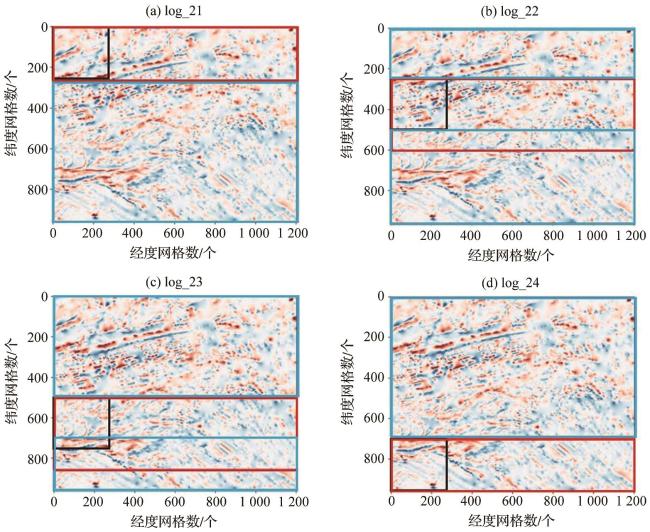
图8 磁条带完全未知的数据集分布图(a)子区域一模型log_21;(b)子区域二模型log_22;(c)子区域三模型log_23;(d)子区域四模型log_24; 蓝框为训练集区域,红框为预测集区域,黑框为分割窗口大小,选取不同子区域黑框所在行的模型预测结果整合成最终磁条带预测图,横纵坐标网格单位长度为经纬度的1'。 Fig. 8 Distribution map of the dataset with completely unknown magnetic stripes (a) Subregion 1 model log_21; (b) Subregion 2 model log_22; (c) Subregion 3 model log_23; (d) Subregion 4 model log_24. The blue boxes indicate the training set areas, the red boxes represent the prediction set areas, and the black boxes denote the segmentation window size. The model prediction results from the row where the black box is located in different subregions are integrated to form the final magnetic stripe prediction map. The grid units along the horizontal and vertical axes represent 1 arc-minute of latitude and longitude. |
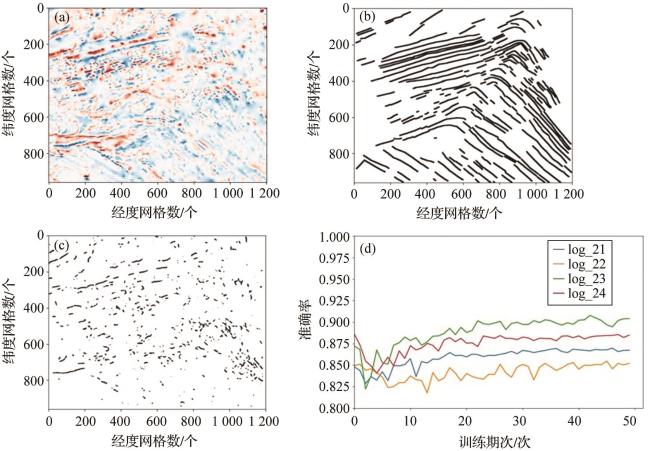
图9 沙茨基海隆磁条带完全未知对比图(a)地磁异常网格图;(b)人工识别磁条带标签;(c)模型预测结果;(d)不同模型预测准确率。 Fig. 9 Comparative chart of the completely unknown magnetic stripes in Shatsky Rise (a) Gridded magnetic anomaly map; (b) Manually interpreted magnetic stripe labels; (c) Model prediction results; (d) Prediction accuracy of different models. |