


1 引 言

2 海洋酸化对氮吸收和硝化作用的影响
2.1 酸化对氮吸收的影响
2.1.1 影响程度
2.1.2 作用机制
2.2 酸化对硝化作用的影响
2.2.1 影响程度
2.2.2 作用机制
3 海洋暖化对氮吸收和硝化作用的影响
3.1 暖化对氮吸收的影响
3.1.1 影响程度
3.1.2 作用机制
3.2 暖化对硝化作用的影响
3.2.1 影响程度
3.2.2 作用机制
4 总结与展望
表1 不同天然水体中氮吸收和硝化作用对海洋酸化和暖化的响应Table 1 Responses of nitrogen uptake and nitrification to ocean warming and acidification in natural waters |
| 调控因子 | 研究内容 | 研究区域 | 控制条件 | 效应 | 参考文献 |
|---|---|---|---|---|---|
| 暖化 | 尿素吸收 | 美国加利福尼亚近海 | 原位温度+4 °C | 促进 | [39] |
| 尿素吸收 | 美国切萨皮克湾 | 原位温度±9 °C | 促进 | [63] | |
| 尿素吸收 | 美国特拉华湾 | 原位温度±9 °C | 促进 | [63] | |
| NH 吸收 | 美国切萨皮克湾 | 原位温度±9 °C | 促进 | [63] | |
| NH 吸收 | 美国特拉华湾 | 原位温度±9 °C | 促进 | [63] | |
| NH 吸收 | 楚科奇海 | 温度范围-1.5~20 °C | 由促进转为抑制 | [59] | |
| NO 吸收 | 楚科奇海 | 原位温度±9 °C | 抑制 | [63] | |
| 氨氧化 | 楚科奇海 | 温度范围-1.5~20 °C | 无响应 | [59] | |
| 氨氧化 | 美国东北部海湾 | 温度范围8~20 °C | 无响应 | [77] | |
| 氨氧化 | 中国东南部海湾 | 温度范围9~34 °C | 由促进转为抑制 | [78] | |
| 氨氧化 | 中国东南部河口 | 温度范围14~34 °C | 促进 | [79] | |
| 氨氧化 | 中国南海 | 温度范围14~34 °C | 抑制 | [79] | |
| 氨氧化 | 中国长江口上游 | 温度范围10~35 °C | 促进 | [83] | |
| 氨氧化 | 中国长江口下游 | 温度范围10~35 °C | 由促进转为抑制 | [83] | |
| 酸化 | NO 吸收 | 美国Terminal Island | CO2分压约81 Pa | 促进 | [39] |
| 氨氧化 | 美国ALOHA站 | pH7.42~8.00 | 抑制 | [43] | |
| 氨氧化 | 加利福尼亚近海 | pH7.91~8.07 | 抑制 | [43] | |
| 氨氧化 | 北大西洋BATS站 | pH7.93~8.06 | 抑制 | [43] | |
| 氨氧化 | 马尾藻海 | pH7.99~8.09 | 抑制 | [43] | |
| 氨氧化 | 美国Sequim Bay | pH6.0~8.0 | 抑制 | [45] | |
| 氨氧化 | 中国长江口 | pH降低0~1.2 | 抑制 | [48] | |
| 氨氧化 | 英国英吉利海峡 | pH6.1~8.1 | 抑制 | [49] | |
| 氨氧化 | 西北太平洋 | pH降低0.06~0.4 | 抑制 | [51] | |
| 氨氧化 | 北大西洋 | pH降低0~0.46 | 抑制 | [52] | |
| 氨氧化 | 南大洋 | pH降低0~0.46 | 抑制 | [52] | |
| 氨氧化 | 中国长江口 | pH7.8/CO2分压约81 Pa | 抑制 | [53] |
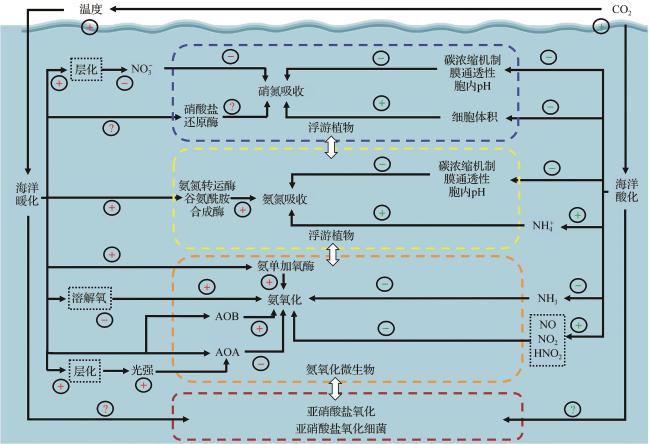
图2 海洋酸化和暖化对上层海洋氮吸收和硝化过程的影响模式示意图加号和减号分别表示正(促进)和负(减少)效应;虚线框内表示酸化和暖化引起的环境因素变化对氮吸收和硝化过程产生的间接影响;AOA:氨氧化古菌;AOB:氨氧化细菌。 Fig. 2 Schematic diagram illustrating the effects of ocean acidification and warming on nitrogen uptake and nitrification in the upper water column The plus and minus signs indicate positive (increase) and negative (decrease) effects, respectively. The changes in environmental factors induced by acidification and warming that indirectly influence nitrogen uptake and nitrification are marked with dashed-line boxes; AOA: Ammonia-Oxidizing Archaea;AOB: Ammonia-Oxidizing Bacteria. |
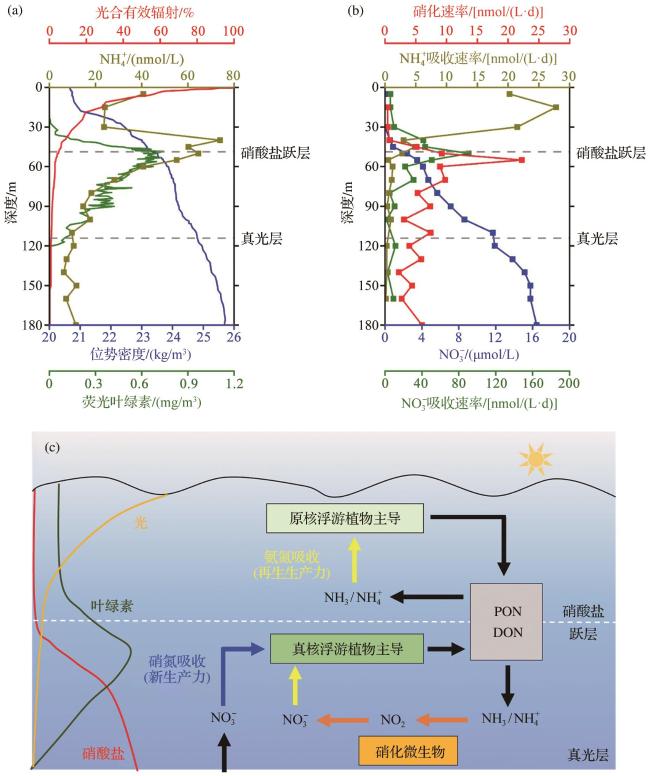
图3 寡营养海上层水体理化参数(a)、氮吸收和硝化过程速率(b)的典型分布,上述过程及其相关浮游微生物在垂直精细结构上的差异(c)(据参考文献[16]修改)Fig. 3 Distribution of physical and chemical parameters (a), and rates of nitrogen uptake and nitrification (b), as well as vertical distribution of these processes and their associated microorganisms, in the upper water column of the oligotrophic ocean (c) (modified after reference [16]) |