


1 引 言
2 涡旋罗斯贝波
2.1 涡旋罗斯贝波与眼墙的关系
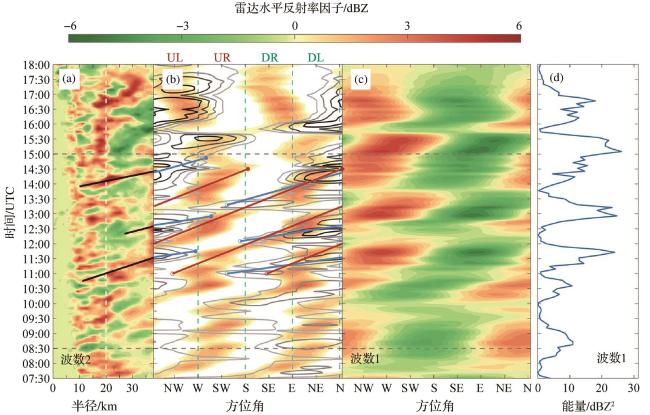
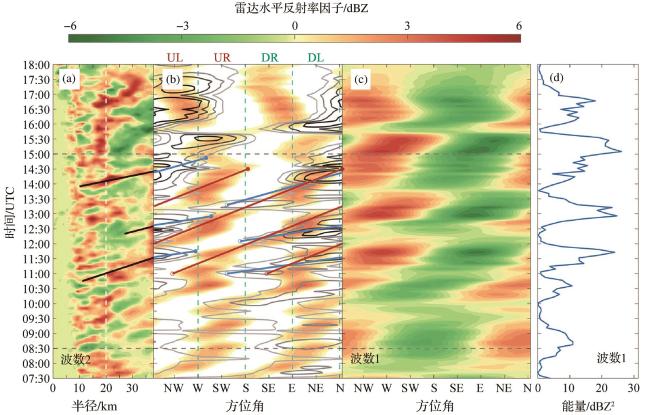
图1 基于温州S波段业务雷达水平反射率因子波数分解的台风“利奇马”外眼墙受涡旋罗斯贝波影响过程分析[62](a)、(c)分别为波数2、波数1径向变化随时间演变(填色),白色虚线指示内眼墙外边缘,黑色实线指示多次外传过程;(b)外眼墙外侧波数2正位相的时间演变(填色)、外眼墙内侧波数1正位相的时间演变(等值线),红(蓝)色实线指示涡旋罗斯贝波传播过程,空(实)心表示波动外传起(止),UL、UR、DR、DL分别表示逆风切左侧、逆风切右侧、顺风切右侧、顺风切左侧;(d)外眼墙波数1能量时间演变。 Fig. 1 The process of the outer eyewall of typhoon Lekima being affected by Vortex Rossby Waves: spectral analysis of horizontal reflectivity using S-band operational radar data in Wenzhou[62] The radius-time Hovmöller diagram of (a) wavenumber-2 and (c) wavenumber-1 (shading), the white dashed line indicates the outer edge of the inner eyewal, the thick black solid lines track the outward propagation of the wavenumber-2 asymmetries. (b) The azimuth-time Hovmöller diagram of wavenumber-1 reflectivity (contour) outside the outer eyewall and wavenumber-2 reflectivity inside the outer eyewall (shading). The thick blue and red solid lines track the rotation of the wavenumber-1 and -2 asymmetries, respectively. Hollow circles and solid dots indicate the start and end of the azimuthal propagation of the VRWs, respectively. UL, UR, DR, and DL respectively denote the upper shear left side, upper shear right side, lower shear right side, and lower shear left side. (d) The time series of wavenumber-1 reflectivity power radially averaged in the outer eyewall. |
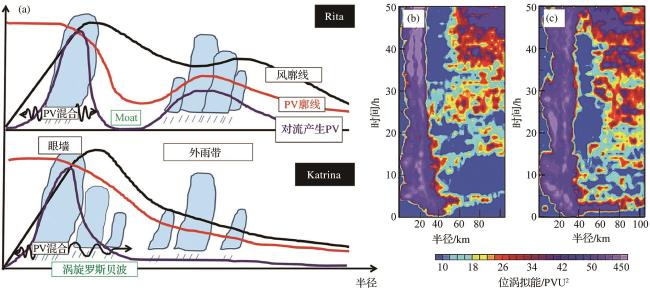
图2 涡旋罗斯贝波用于解释双眼墙形成(a)飓风“Rita”和“Katrina”中对流产生位涡(PV)的径向分布示意图,在“Rita”的内眼墙和外眼墙之间的区域没有涡旋罗斯贝波传播,这表明波不是双眼墙形成的贡献因素[68];飓风(b)“Katrina”和(c)“Rita”的850 hPa位涡拟能[69]。 Fig. 2 The role of vortex Rossby waves in double eyewall formation (a) Schematics of radial distributions of convection, vortex Rossby waves, azimuthally averaged tangential wind speed, Potential Vorticity (PV), and PV generation by convection in Hurricane “Rita” and “Katrina”[68]. The absence of vortex Rossby wave propagation in the moat region between the primary and secondary eyewalls in Rita, which indicates that the waves are not a contributing factor; PV enstrophy at 850 hPa for Hurricane (b) “Rita” and (c) “Katrina”[69]. |
2.2 涡旋罗斯贝波与螺旋雨带的关系
2.3 涡旋罗斯贝波与台风强度变化的关系
3 台风重力波
3.1 台风重力波与眼墙的关系
3.2 台风重力波与螺旋雨带的关系
3.3 台风重力波与台风强度变化的关系
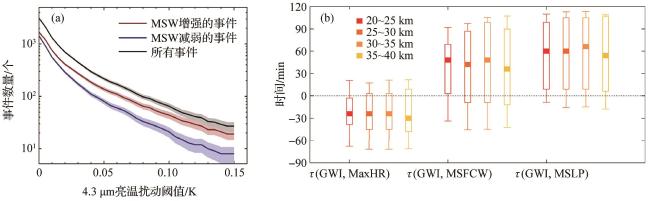
图4 台风强度与重力波特征的相关关系(a)热带气旋减弱或增强阶段的平流层台风重力波事件数量[44],其中MSW表示10分钟最大持续风速;(b)重力波强度(GWI)与最大加热率(MaxHR)、最大地面风速(MSFCW)、最低海平面气压(MSLP)的滞后相关系数 [128]。 Fig. 4 The correlation between typhoon intensity and the characteristics of gravity waves (a) Number of Gravity Waves (GW) events associated with increasing or decreasing MSW (10 min maximum sustained wind)[44]; (b) The “best” time lag between GW Intensity (GWI) and the Maximum Heating Rate (MaxHR), the Maximum Surface Wind speed (MSFCW), and Minimum Sea Level Pressure (MSLP), respectively[128]. |

 甘公网安备62010202000687


