A Preliminary Study of Classification Method on Lunar Topography and Landforms
Cheng Weiming1, 2, , Liu Qiangyi1, 2, Wang Jiao3, Gao Wenxin1, 4, Liu Jianzhong5
1.State Key Laboratory of Resources and Environmental Information System, Institute of Geographic Sciences and Natural Resources Research, Chinese Academy of Sciences, Beijing 100101, China2.University of Chinese Academy of Sciences, Beijing 100049, China3.School of Information Engineering, China University of Geosciences, Beijing 100083, China4.School of Civil Engineering, Lanzhou University of Technology,Lanzhou 730050, China5.Institute of Geochemistry, Chinese Academy of Sciences, Guiyang 550081, China
First author:Cheng Weiming(1973-), male, Tianshui City, Gansu Province, Professor. Research areas include digital geomorphology and lunar topography and landforms. E-mail: chengwm@lreis.ac.cn
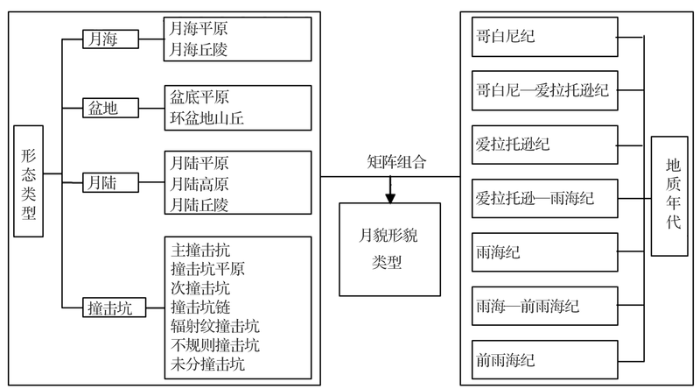
Lunar topography and landform, resulting from endogenous and exogenous geophysical processes of various spatial and temporal scales, carry information of these processes and target properties. Geoscientists use morphometric analysis at different scales to study lunar topography, which is one of the four scientific objectives of China's lunar exploration project. This article first reviewed the lunar topographic types from different researchers, analyzed classifying method and progress, discussed geological mapping method of 1∶ 5 000 000 complied by United States Geological Survey in the 1970s. In consideration of the present situation of the lunar surface morphological characteristics, the pattern of macroscopic forcing, morphologic variation and combination characteristics and function way, etc., a matrix combining multi-stage classification method was put forward based on the characteristics of the topography and geologic age, which included 7 geologic ages and 14 morphologic classes. Geological ages can be divided into Copernican System (C), Copernican-Eartosthenian System (CE), Eartosthenian System (E), Eartosthenian-Imbrian System (EI), Imbrian System (I), Imbrian-PreImbrian System (IpI) and Pre-Imbrian System (pI). As to topographic types, the first class can be divided into lunar mare, lunar basin, lunar terra and lunar crater. As to their second class according to morphological differences, the lunar basin can be divided into basin plain and circum-basin, and lunar mare can be divided into mare plain and mare dome; lunar terra can be divided into terra plain, plateau and hill, and craters can be divided into main sequence crater, crater plain, secondary crater, crater chains and clusters, rayed craters, irregular crater and undivided crater. Thus, 46 subclasses including geologic and morphologic features were obtained in this classification system. The test mapping method was addressed in Sheet H010, which shows the combination classification method is reasonable.
ChengWeiming, LiuQiangyi, WangJiao, GaoWenxin, LiuJianzhong. A Preliminary Study of Classification Method on Lunar Topography and Landforms[J]. Advances in Earth Science, 2018, 33(9): 885-897 https://doi.org/10.11867/j.issn.1001-8166.2018.09.0885
基于DEM的撞击坑自动分类主要是利用地形信息对撞击坑识别、分类,Wan等[64]采用DEM填洼、面向对象分类、DEM填洼的面向对象分类3种自动提取方法在DEM上进行撞击坑提取试验,表明填洼—面向对象的方法具有更高的提取精度;Salamuni car 等[65,66]利用DEM数据,运用霍夫变换、特征匹配面向对象等方法对火星和月球上的撞击坑进行了自动提取,得到了一系列撞击坑数据目录;Luo等[67]也利用嫦娥一号的DEM数据获得的地形指标,获得了全月球直径大于10 km的撞击坑边界;Di等[68]基于地形数据,利用机器学习方法提取撞击坑。Bue等[69]不仅考虑到了坡度信息,还加入了纹理和剖面曲率信息,以提高撞击坑识别的精度;Hawke等[70]采用形态和纹理特征对亚公里级别的撞击坑进行识别。
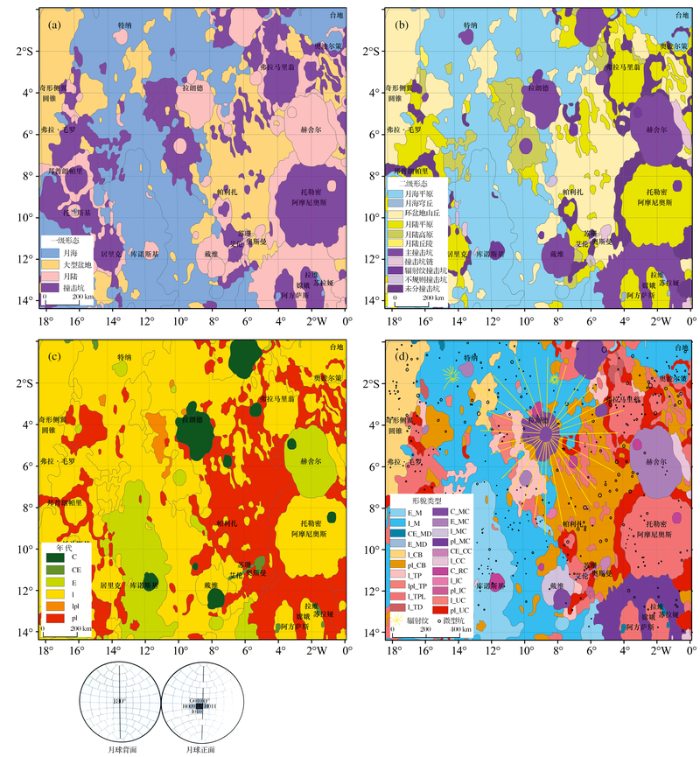
Fig.2 Maps of morphologic feature, geologic age and landforms of Sheet H010(a)First class morphologic types;(b)Second class morphologic types; (c)Geologic Age; (d) Combined landform types
Radio interferometry is a new technique for the measurement of the surface topography of the Moon. Elevation data may be obtained directly without regard for unambiguously-identified features, for any lunar surface element that yields a recognizable radar echo. A program has been undertaken at the Haystack Observatory for the topographic mapping of the major part of the lunar Earthside hemisphere. Some results are presented for the Alphonsus-Arzachel region, showing evidence for a late lava flow of a viscosity and, hence, presumably a chemical composition, differing from that of near-by mare surfaces.
[8]
Smith DE, Zuber MT, Neumann GA, et al.
Topography of the Moon from theclementine lidar
[J]. Journal of Geophysical Research, 1997, 102(1): 1 591-1 611.
Range measurements from the lidar instrument carried aboard the Clementine spacecraft have been used to produce an accurate global topographic model of the Moon. This paper discusses the function of the lidar; the acquisition, processing, and filtering of observations to produce a global topographic model; and the determination of parameters that define the fundamental shape of the Moon. Our topographic model; a 72nd degree and order spherical harmonic expansion of lunar radii, is designated Goddard Lunar Topography Model 2 (GLTM 2). This topographic field has an absolute vertical accuracy of approximately 100 m and a spatial resolution of 2.500°. The field shows that the Moon can be described as a sphere with maximum positive and negative deviations of 0908048 km, both occurring on the farside, in the areas of the Korolev and South Pole-Aitken (S.P.-Aitken) basins. The amplitude spectrum of the topography shows more power at longer wavelengths as compared to previous models, owing to more complete sampling of the surface, particularly the farside. A comparison of elevations derived from the Clementine lidar to control point elevations from the Apollo laser altimeters indicates that measured relative topographic heights generally agree to within 090804200 m over the maria. While the major axis of the lunar gravity field is aligned in the Earth-Moon direction, the major axis of topography is displaced from this line by approximately 1000° to the east and intersects the farside 2400° north of the equator. The magnitude of impact basin topography is greater than the lunar flattening (0908042 km) and equatorial ellipticity (090804800 m), which imposes a significant challenge to interpreting the lunar figure. The floors of mare basins are shown to lie close to an equipotential surface, while the floors of unflooded large basins, except for S.P.-Aitken, lie above this equipotential. The radii of basin floors are thus consistent with a hydrostatic mechanism for the absence of significant farside maria except for S.P.-Aitken, whose depth and lack of mare require significant internal compositional and/or thermal heterogeneity. A macroscale surface roughness map shows that roughness at length scales of 101090009102 km correlates with elevation and surface age.
[9]
Cook AC, Spudis PD, Robinson MS, et al.
Lunar topography and basins mapped using a Clementine stereo digital elevation model
One of the primary objectives of the Lunar Reconnaissance Orbiter Camera (LROC) is to acquire stereo observations with the Narrow Angle Camera (NAC) to enable production of high resolution digital elevation models (DEMs). This work describes the processes and techniques used in reducing the NAC stereo observations to DEMs through a combination of USGS integrated Software for Imagers and Spectrometers (ISIS) and SOCET SET03 from BAE Systems by a team at Arizona State University (ASU). LROC Science Operations Center personnel have thus far reduced 130 stereo observations to DEMs of more than 130 stereo pairs for 11 Constellation Program (CxP) sites and 53 other regions of scientific interest. The NAC DEM spatial sampling is typically 2 meters, and the vertical precision is 1–2 meters. Such high resolution provides the three-dimensional view of the lunar surface required for site selection, hazard avoidance and planning traverses that minimize resource consumption. In addition to exploration analysis, geologists can measure parameters such as elevation, slope, and volume to place constraints on composition and geologic history. The NAC DEMs are released and archived through NASA’s Planetary Data System.
[11]
ArakiH, TazawaS, NodaH, et al.
Lunar global shape and polar topography derived from Kaguya-LALT laser altimetry
A global lunar topographic map with a spatial resolution of finer than 0.5 degree has been derived using data from the laser altimeter (LALT) on board the Japanese lunar explorer Selenological and Engineering Explorer (SELENE or Kaguya). In comparison with the previous Unified Lunar Control Network (ULCN 2005) model, the new map reveals unbiased lunar topography for scales finer than a few hundred kilometers. Spherical harmonic analysis of global topographic data for the Moon, Earth, Mars, and Venus suggests that isostatic compensation is the prevailing lithospheric support mechanism at large scales. However, simple rigid support is suggested to dominate for the Moon, Venus, and Mars for smaller scales, which may indicate a drier lithosphere than on Earth, especially for the Moon and Venus.
[12]
LiChunlai, LiuJianjun, RenXin, et al.
The global image of the Moon obtained by the Chang'E-1: Data processing and lunar cartography
[J]. Science in China (Series D), 2010, 53(8): 1 091-1 102.
The Laser AltiMeter (LAM), as one of the main payloads of Chang’E-1 probe, is used to measure the topography of the lunar surface. It performed the first measurement at 02:22 on November 28th, 2007. Up to December 4th 2008, the total number of measurements was approximately 9.12 million, covering the whole surface of the Moon. Using the LAM data, we constructed a global lunar Digtal Elevation Model (DEM) with 3 km spatial resolution. The model shows pronounced morphological characteristics, legible and vivid details of the lunar surface. The plane positioning accuracy of the DEM is 445 m (1 σ ), and the vertical accuracy is 60 m (1 σ ). From this DEM model, we measured the full range of the altitude difference on the lunar surface, which is about 19.807 km. The highest point is 10.629 km high, on a peak between crater Korolev and crater Dirichlet-Jackson at (158.656°W, 5.441°N) and the lowest point is 619.178 km in height, inside crater Antoniadi (172.413°W, 70.368°S) in the South Pole-Aitken Basin. By comparison, the DEM model of Chang’E-1 is better than the USA ULCN2005 in accuracy and resolution and is probably identical to the DEM of Japan SELENE, but the DEM of Chang’E-1 reveals a new lowest point, clearly lower than that of SELENE.
[14]
Fok HS, Shum CK, YiYuchan, et al.
Accuracy assessment of lunar topography models
[J]. Earth, Planets and Space, 2011, 63(1): 15-23.
Both the Chang’E-1 and SEL enological and EN gineering Explorer (SELENE) lunar missions, launched in 2007, provide an opportunity for significant advances in lunar science. In particular, both orbiters provide refined lunar topography models with unprecedented finer resolution and improved accuracy, especially for the far side and the polar areas of the Moon where fewer valid measurements have been available to date. An evaluation of the derived topography models is essential for the improved interpretation of selenophysics, including a knowledge of the interior of the Moon. This study provides both external and internal accuracy assessments for the derived topographic models (note that different data sets are used, albeit independent). The external comparison, which consists of comparing the topographic models with landmarks established with lunar laser ranging and radio tracking, yields an accuracy estimate of 157 m for the Change’E-1 model and 58 m for the SELENE model (150 m and 55 m if the newly recovered Lunakhod-1 site is included). The internal comparison, consisting of crossover analysis of the altimeter data after the removal of once-per-orbital-revolution errors, yields an accuracy estimate of 206 m and 68 m, respectively. These comparisons allow the establishment of conservative estimates of accuracy of 200 m and 70 m for the Chang’E-1 and SELENE models, respectively. Given the conservative estimates on the accuracy, both models yield significant improvement by factors of 2.5 and 8, respectively, when compared with a contemporary lunar topography model, i.e., the Unified Lunar Control Network 2005 (ULCN2005).
[15]
PingJinsong, HuangQian, YanJianguo, et al.
Lunar topographic model CLTM-s01 from Chang'E-1 laser altimeter
[J]. Science in China (Series G), 2009, 52(7): 1 105-1 114.
More than 3 million range measurements from the Chang’E-1 Laser Altimeter have been used to produce a global topographic model of the Moon with improved accuracy. Our topographic model, a 360th degree and order spherical harmonic expansion of the lunar radii, is designated as Chang’E-1 Lunar Topography Model s01 (CLTM-s01). This topographic field, referenced to a mean radius of 1738 km, has an absolute vertical accuracy of approximately 31 m and a spatial resolution of 0.25° (657.5 km). This new lunar topographic model has greatly improved previous models in spatial coverage, accuracy and spatial resolution, and also shows the polar regions with the altimeter results for the first time. From CLTM-s01, the mean, equatorial, and polar radii of the Moon are 1737103, 1737646, and 1735843 m, respectively. In the lunar-fixed coordinate system, this model shows a COM/COF offset to be (611.777, 610.730, 0.237) km along the x, y , and z directions, respectively. All the basic lunar shape parameters derived from CLTM-s01 are in agreement with the results of Clementine GLTM2, but CLTM-s01 offers higher accuracy and reliability due to its better global samplings.
[16]
WuBo, GuoJian, ZhangYunsheng, et al.
Integration of Chang'E-1 imagery and laser altimeter data for precision lunar topographic modeling
[J].IEEE Transactions on Geoscience and Remote Sensing, 2011, 49(12): 4 889-4 903.
Our previous algorithm (Sawabe, Y., Matsunaga, T., Rokugawa, S. Automatic crater detection algorithm for the lunar surface using multiple approaches. J. Remote Sens. Soc. Jpn. 25 (2), 157–168, 2005.) was improved to enhance detection of craters in lunar images and automate crater classification. This algorithm was tested using various images for wide range of applicability. Four approaches were used with the crater detecting algorithm to find (1) “shady and sunny” patters in images with low sun angle, (2) circular features in edge images, (3) curves and circles in thinned and connected edge lines, and (4) discrete or broken circular edge lines using fuzzy Hough transform. The algorithm was applied to mare and highland images of the moon captured by Clementine and Apollo under different solar angles and spatial resolution. The new algorithm was able to detect 80% more without parameter tuning. In addition, the detected craters were classified by spectral characteristics derived from Clementine UV–Vis multi-spectral images. Finally, the lunar surface GIS was formulated which has the geological and spectral attributes automatically generated by our algorithm. It could be helpful system to analyze and recognize about the geological settings.
[18]
Baldwin RB.The Face of the Moon[M]. Chicago: University of Chicago Press, 1949.
The planetary surface roughness is the record of erosion, deposition, uplift and other geological processes on the planetary surface, and hence serves as a prediction for the geological age of the planetary surface. In this paper, twelve profiles were selected in the horizontal direction of the Sinus Iridum in the moon, and several parameters of roughness of those profiles were studied. Some results have been obtained: 1The average of RMS height along the profile 1 km in length is about 3m. In addition, within the research scale selected in this paper (0.2~3 km), the slope of Sinus Iridum area does not exceed 2?. This means that the surface of Sinus Iridum is relatively smooth. 2Hurst exponent of Sinus Iridum is mainly concentrated from 0.5 to 0.78, which means that the surface morphology is rather homogeneous. 3Low latitude areas(lower than 44.3)have relatively high Hurst exponent (from 0.6 to 0.8), and high latitude areas(higher than 44.3)usually have lower Hurst exponent (from 0.5 to 0.8). 4The roughness may be used as a means to determine the relative geological age.
[40]
WangChenzhi, TangGuoan, YuanSai, et al.
A method for identifying the lunar morphology based on texture from DEMs
[J].Journal of Geo-information Science, 2015, 17(1): 45-53 .
We propose a numerical method for classification and characterization of landforms on Mars. The method provides an alternative to manual geomorphic mapping of the Martian surface. Digital elevation data is used to calculate several topographic attributes for each pixel in a landscape. Unsupervised classification, based on the self-organizing map technique, divides all pixels into mutually exclusive and exhaustive landform classes on the basis of similarity between attribute vectors. The results are displayed as a thematic map of landforms and statistics of attributes are used to assign semantic meaning to the classes. This method is used to produce a geomorphic map of the Terra Cimmeria region on Mars. We assess the quality of the automated classification and discuss differences between results of automated and manual mappings. Potential applications of our method, including crater counting, landscape feature search, and large scale quantitative comparisons of Martian surface morphology, are identified and evaluated.
[42]
LiJing, ChenJianping, WangNan, et al.
A new automated approach to detecting and extracting the linear structures on the lunar surface: A case study on the lunar mare ridge of Mare Serenitatis
Previous mapping of linear structures on the lunar near side shows that lineaments are not equally oriented in all directions but rather have preferred orientations. The preferred orientations of near-side lunar lineaments are roughly consistent with the tectonic pattern predicted by relaxation of a formerly larger tidal bulge on the Moon due to the Moon's continuing recession from the Earth. We have mapped lineaments on the lunar far side and both the polar regions as well as re-examined lineaments mapped in the sub-Earth and anti-Earth regions to determine if the lineament patterns observed in these regions are also consistent with being produced by the collapse of a once larger tidal bulge on the Moon. The lunar far side is found to have a lineament pattern similar to that previously observed on the near side, which is consistent with being produced by the collapse of a once larger tidal bulge. However, the sub-Earth and anti-Earth regions show a lineament pattern indistinguishable from that observed on the rest of the lunar near and far sides, even though relaxation of a formerly larger tidal bulge would produce a significantly different pattern in these regions. Collapse of a once larger tidal bulge also predicts a near to far side lineament trend in the lunar polar regions, but mapped lineaments in the polar regions show no evidence for such a trend. Overall, the observed lunar lineament patterns do not support the predictions of a global tectonic pattern due to the collapse of a once larger tidal bulge on the Moon and therefore require an alternate explanation.
Discrepancies in published crater frequency data prompted this study of lunar crater distributions. Effects modifying production size distributions of impact craters such as surface lava flows, blanketing by ejecta, superposition, infilling, and abrasion of craters, mass wasting, and the contribution of secondary and volcanic craters are discussed. The resulting criteria have been applied in the determination of the size distributions of unmodified impact crater populations in selected lunar regions of different ages. The measured cumulative crater frequencies are used to obtain a general calibration size distribution curve by a normalization procedure. It is found that the lunar impact crater size distribution is largely constant in the size range 0.3 km 81 D 81 20 km for regions with formation ages between ≈ 3 × 10 9 yr and 68 4 × 10 9 yr. A polynomial of 4th degree, valid in the size range 0.8 km 81 D 81 20 km, and a polynomial of 7th degree, valid in the size range 0.3 km 81 D 81 81 20 km, have been approximated to the logarithm of the cumulative crater frequency N as a function of the logarithm of crater diameter D. The resulting relationship can be expressed as N 65 D α ( D ) where α is a function depending on D. This relationship allows the comparison of crater frequencies in different size ranges. Exponential relationships with constant α, commonly used in the literature, are shown to inadequately approximate the lunar impact crater size distribution. Deviations of measured size distributions from the calibration distribution are strongly suggestive of the existence of processes having modified the primary impact crater population.
[47]
YueZongyu, LiuJianzhong, WuGanguo.
Automated detection of lunar craters based on object-oriented approach
[J]. Chinese Science Bulletin, 2008, 53(23): 3 699-3 704.
The object-oriented approach is a powerful method in making classification. With the segmentation of images to objects, many features can be calculated based on the objects so that the targets can be distinguished. However, this method has not been applied to lunar study. In this paper we attempt to apply this method to detecting lunar craters with promising results. Craters are the most obvious features on the moon and they are important for lunar geologic study. One of the important questions in lunar research is to estimate lunar surface ages by examination of crater density per unit area. Hence, proper detection of lunar craters is necessary. Manual crater identification is inefficient, and a more efficient and effective method is needed. This paper describes an object-oriented method to detect lunar craters using lunar reflectance images. In the method, many objects were first segmented from the image based on size, shape, color, and the weights to every layer. Then the feature of “contrast to neighbor objects” was selected to identify craters from the lunar image. In the next step, by merging the adjacent objects belonging to the same class, almost every crater can be taken as an independent object except several very big craters in the study area. To remove the crater rays diagnosed as craters, the feature of “length/width” was further used with suitable parameters to finish recognizing craters. Finally, the result was exported to ArcGIS for manual modification to those big craters and the number of craters was acquired.
[48]
MoutsoulasM, PrekaP.
Morphological characteristics of lunar craters with small depth/diameter ratio I
[J].Earth, Moon and Planets, 1979, 21(3): 299-305.
As the development of China's Lunar Exploration,Vision-Based technology of lunar probe autonomous landing is researching.Craters are commonly found on the surface of moon.The crater detection from surface images,as a key technology of Autonomous Hazard Avoidance,has been researched by many scientists from different countries.In this paper,a new algorithm based on feature point is demonstrated.The algorithm is divided into three parts,feature points extraction,candidate area of crater decision and crater detection.Firstly,candidate areas of crater are decided by feature point extraction.Secondly,the light and shaded parts of crater are extracted by region growing.Finally,the craters are detected by ellipse detection.Experiment result shows this algorithm is effective for some craters detection.Those craters have strong intensity variations and their radiuses are longer than 5 pixels and shorter than 15 pixels.In the conclusion,authors offer four improvement directions of this algorithm in the future.
[51]
DuJun, MiaoFang, LuYuhang, et al.
Research on appraisal of edge definition of impact craters
[J]. Computer Engineering and Applications, 2013,49(15): 179-183 .
A new algorithm based on an analytical expression of the density has been developed for edge determination in lunar studies. Use was made of a digital microdensitometer and a two-dimensional sliding mean filter. Attention is given to the use of the Laplacian and to maximum gradient lines. The proposed algorithm has been tested with about sixty craters, and good crater measurements have been obtained.
[53]
CannyJ.
A computational approach to edge detection
[J]. IEEE Transactions on Pattern Analysis and Machine Intelligence, 1986, 8(6): 679-698.
Abstract-This paper describes a computational approach to edge detection. The success of the approach depends on the definition of a comprehensive set of goals for the computation of edge points. These goals must be precise enough to delimit the desired behavior of the detector while making minimal assumptions about the form of the so- lution. We define detection and localization criteria for a class of edges, and present mathematical forms for these criteria as functionals on the operator impulse response. A third criterion is then added to ensure that the detector has only one response to- a single edge. We use the criteria in numerical optimization to derive detectors for several com- mon image features, including step edges. On specializing the analysis to step edges, we find that there is a natural uncertainty principle be- tween detection and localization performance, which are the two main goals. With this principle we derive a single operator shape which is optimal at any scale. The optimal detector has a simple approximate implementation in which edges are marked at maxima in gradient mag- nitude of a Gaussian-smoothed image. We extend this simple detector using operators of several widths to cope with different signal-to-noise ratios in the image. We present a general method, called feature syn- thesis, for the fine-to-coarse integration of information from operators at different scales. Finally we show that step edge detector perfor- mance improves considerably as the operator point spread function is extended along the edge. This detection scheme uses several elongated operators at each point, and the directional operator outputs are in- tegrated with the gradient maximum detector.
[54]
SalamunićcarG, LončarićS, MazaricoE.
LU60645GT and MA132843GT catalogues of Lunar and Martian impact craters developed using a Crater Shape—Based interpolation crater detection algorithm for topography data
[J]. Planetary and Space Science, 2012, 60(1): 236-247.
An algorithm for the automatic recognition of impact craters is presented, based on Hough transforms and accounting for both the circularity of the crater rim and the presence of the internal depression. The algorithm is applied to adjust a catalogue of crater coordinates originally measured in the context of the USGS 1:2M controlled photomosaic to the more precise geodetic grid derived from the Mars Orbiter Laser Altimeter experiment of the Mars Global Surveyor mission. The transformed coordinates are used to generate a global displacement field which may be used as a general transformation between the two coordinate systems. The feasibility of using the new coordinates to extract topographic profiles passing through the crater centres is demonstrated. The potential application of the algorithm for surface dating using the HRSC stereoscopic images and for searching for unknown impact structures on the Earth is discussed.
[57]
Kim JR, Muller JP,
Mor ley J G. Quantitative assessment of automated crater detection on Mars
We describe a visual positioning system for use by a spacecraft to choose a landing site, while orbiting an asteroid. The spacecraft pose is refined using landmarks, such as craters, observed by a visual sensor. The craters, which have an elliptical shape, are detected using a multi-scale method based on voting, and tensors as a representation. We propose a new robust method to infer curvature estimation from noisy sparse data. This method is applied on edge images in order to obtain the oriented normals of the edge curves. Using this information, a dense saliency map corresponding to the position and shape of the craters is computed. The detected craters in the image are matched with the craters projected from a 3D model, and the best transformation between these two sets is obtained. This system has been tested with both real images of Phobos and a synthetic model.
[59]
HeJiang.
Research on Crater Matching Based Navigation Method for Lunar Precise Landing[D]
. Haerbing: Harbin Institute of Technology, 2010 .
Our previous algorithm (Sawabe, Y., Matsunaga, T., Rokugawa, S. Automatic crater detection algorithm for the lunar surface using multiple approaches. J. Remote Sens. Soc. Jpn. 25 (2), 157–168, 2005.) was improved to enhance detection of craters in lunar images and automate crater classification. This algorithm was tested using various images for wide range of applicability. Four approaches were used with the crater detecting algorithm to find (1) “shady and sunny” patters in images with low sun angle, (2) circular features in edge images, (3) curves and circles in thinned and connected edge lines, and (4) discrete or broken circular edge lines using fuzzy Hough transform. The algorithm was applied to mare and highland images of the moon captured by Clementine and Apollo under different solar angles and spatial resolution. The new algorithm was able to detect 80% more without parameter tuning. In addition, the detected craters were classified by spectral characteristics derived from Clementine UV–Vis multi-spectral images. Finally, the lunar surface GIS was formulated which has the geological and spectral attributes automatically generated by our algorithm. It could be helpful system to analyze and recognize about the geological settings.
[63]
Burl MC, StoughT, ColwellW, et al.
Automated detection of craters and other geological features
[C]//6th International Symposium on Artificial Intelligence, Robotics and Automation in Space. United States: NASA Technical Reports Server, 2001.
Method for crater detection from Martian digital topography data using gradient value orientation, morphometry, votes-analysis, slip-tuning and calibration
[J]. IEEE Transaction on Geoscience and Remote Sensing, 2010, 48(5): 2 317-2 329.
Test-field for evaluation of laboratory craters using a Crater Shape—Based interpolation crater detection algorithm and comparison with Martian and Lunar impact craters
[J]. Planetary and Space Science, 2012, 71(1): 106-118.
Craters are distinctive features on the surfaces of most terrestrial planets. Craters reveal the relative ages of surface units and provide information on surface geology. Extracting craters is one of the fundamental tasks in planetary research. Although many automated crater detection algorithms have been developed to exact craters from image or topographic data, most of them are applicable only in particular regions, and only a few can be widely used, especially in complex surface settings. In this study, we present a machine learning approach to crater detection from topographic data. This approach includes two steps: detecting square regions which contain one crater with the use of a boosting algorithm and delineating the rims of the crater in each square region by local terrain analysis and circular Hough transform. A new variant of Haar-like features (scaled Haar-like features) is proposed and combined with traditional Haar-like features and local binary pattern features to enhance the performance of the classifier. Experimental results with the use of Mars topographic data demonstrate that the developed approach can significantly decrease the false positive detection rate while maintaining a relatively high true positive detection rate even in challenging sites.
[69]
Bue BD, Stepinski TF.
Machine detection of martian impact craters from digital topography Data
[J]. IEEE Transactions on Geoscience and Remote Sensing, 2007, 45: 265-274.
Research on automatic identification of impact craters on Mars and other planetary bodies has concentrated on detecting them from imagery data. We present a novel approach to crater detection that utilizes digital topography data instead of images. Craters are delineated by topographic curvature. Thresholding maps of curvature transforms topographic data into a binary image, from which craters are identified using a combination of segmentation and detection algorithms. We apply our method to a large and technically demanding test site and compare the results to the existing catalog of manually identified craters. Our algorithm finds many small craters not listed in the manual catalog, but it fails to detect heavily degraded craters. A detailed quality assessment of the algorithm is presented. The topography-based crater-detection algorithm offers a relatively simple and ready-to-use tool for identification and characterization of fresh impact craters with an adequate performance for the immediate application to Martian geomorphology
Lunar rays are filamentous, high-albedo deposits occurring radial or subradial to impact craters. The nature and origin of lunar rays have long been the subjects of major controversies. We have determined the origin of selected lunar ray segments utilizing Earth-based spectral and radar data as well as FeO, TiO 2 , and optical maturity maps produced from Clementine UVVIS images. These include rays associated with Tycho, OlbersA, Lichtenberg, and the Messier crater complex. It was found that lunar rays are bright because of compositional contrast with the surrounding terrain, the presence of immature material, or some combination of the two. Mature “compositional” rays such as those exhibited by Lichtenberg crater, are due entirely to the contrast in albedo between ray material containing highlands-rich primary ejecta and the adjacent dark mare surfaces. “Immaturity” rays are bright due to the presence of fresh, high-albedo material. This fresh debris was produced by one or more of the following: (1)the emplacement of immature primary ejecta, (2)the deposition of immature local material from secondary craters, (3)the action of debris surges downrange of secondary clusters, and (4)the presence of immature interior walls of secondary impact craters. Both composition and state-of-maturity play a role in producing a third (“combination”) class of lunar rays. The working distinction between the Eratosthenian and Copernican Systems is that Copernican craters still have visible rays whereas Eratosthenian-aged craters do not. Compositional rays can persist far longer than 1.1Ga, the currently accepted age of the Copernican–Eratosthenian boundary. Hence, the mere presence of rays is not a reliable indication of crater age. The optical maturity parameter should be used to define the Copernican–Eratosthenian boundary. The time required for an immature surface to reach the optical maturity index saturation point could be defined as the Copernican Period.
[71]
SalamunićcarG, LončarićS, GrumpeA, et al.
Hybrid method for crater detection based on topography reconstruction from optical images and the new LU78287GT catalogue of lunar impact craters
[J]. Advances in Space Research, 2014, 53(12): 1 783-1 797.
61Detected lunar impact craters with diameters more than 500m using Chang'E-1 data in a hybrid method.61Compiled a global catalog of 106016 impact craters with comprehensive morphometric parameters.61Inspected the asymmetric spatial distribution of impact craters.
[73]
LuoZhongfei, KangZhizhong, LiuXinyi.
The automatic extraction and recognition of lunar impact craters fusing CCD images and DEM data of Chang'E-1
[J]. Acta Geodaetica et Cartographica Sinica, 2014, 43(9): 924-930 .
Morphometric relations have been determined for 2598 fresh craters on the lunar nearside using data given in the catalog of Wood and Andersson (1978). For each of five principal morphological types, typified by Albategnius C, Biot, Sosigenes, Triesnecker, and Tycho, statistical relations are documented for the following: crater diameter and depth; floor diameter and crater diameter; central peak height and crater diameter; average wall slope and crater depth; central peak occurrence and crater diameter; occurrence of scallops or terraces and crater diameter. The first four relations generally confirm the conclusions of Pike (1977), but the last two differ from results reported by Smith and Sanchez (1973). Small (diameter less than 20 km) flat-floored craters formed in mare terrains are as much as 10% deeper than those formed in the highlands, and the depths of small bowl-shaped craters reflect even greater dependence on terrain. Larger, scalloped-walled craters are deeper in highland terrain than on the maria. Although wall failure does not occur until the crater diameter reaches 13 km, central peaks are found in flat floor craters as small as 2 km.
[75]
MorotaT, FurumotoM.
Asymmetrical distribution of rayed craters on the Moon
[J]. Earth and Planetary Science Letters, 2003, 206(3): 315-323.
The synchronous rotation of the satellite ought to cause a spatial variation in the cratering rate over its surface. The crater density is expected to be maximum at the apex of the orbital motion and decrease with the increase of the angular distance from the apex. The ratio of the density at the apex (maximum) to that of the antapex (minimum) depends on the average encounter velocity of impactors to the satellite. Although the Moon is also in a state of the synchronous rotation, it has been supposed that the asymmetry in the crater density on the Moon can be hardly observed. We report here a spatial variation in the density of rayed craters on the Moon, which may be associated with the synchronous rotation. Since the lifetime of a ray is relatively short (<0.8 billion years), the results provide information on recent impacts. Rayed craters are identified on Clementine 750-nm mosaic images. We investigate craters in a lower latitude zone from 42 N to 42 S. To avoid an effect of material difference on the ray preservation, we analyze craters on the highland from 70 to 290 E in east longitude. A total of 222 rayed craters larger than 5 km in diameter are identified in the study area of about 1.4 10 7 km 2 . The average density of rayed craters on the leading side is substantially higher than that on the trailing side. The crater density decreases as a sinusoidal function of the angular distance from the apex. The observed ratio of the density at the apex to that at the antapex is about 1.5. The ratio suggests that recent craters on the Moon are formed mainly by near-Earth asteroids rather than comets with higher encounter velocities.
[76]
Oberbeck VR, GreeleyR, Morgan RB, et al.
Lunar Rilles: A Catalog and Method of Classification[R]
Lunar Orbiter data make it possible to examine the distribution and relations of maria and large circular basins over the entire Moon. The restricted distribution and age of the maria are in marked contrast to the apparently random distribution in time and place of the circular basins, some of which contain mare fillings. The circular basins are believed to be impact scars, and the maria to be volcanic fills which in each case are younger than the structures they fill. Twenty-nine circular basins 300 km wide or wider are recognized. They are placed in an age sequence because successive stages of degradation can be recognized from the fresh Orientale basin to the almost obliterated basin containing Mare Australe. The maria were emplaced during a short span of lunar history, although some light plains of the highlands may be older maria lightened through age. The present maria are topographically low, tend to be associated with large circular basins, and lie in a crude global belt of regional concentrations; 94% are on the hemisphere facing the Earth. Possible explanations offered for these patterns of mare distribution include impact-induced volcanism, volcanic extrusion to a hydrostatic level, isostatic compensation, lateral heterogeneity in the lunar interior, subcrustal convection, and volcanism due to disruption by Earth's gravity.
[81]
Lucey PG.
Mineral maps of the Moon
[J].Geophysical Research Letters, 2004, 31(8):1-4.
Global maps of the distribution of plagioclase, orthopyroxene, clinopyroxene and olivine on the Moon were derived from radiative transfer analysis of 400,000 Clementine UVVIS spectra. Plagioclase inversely correlates with iron while clinopyroxene positively correlates with iron showing these are the major carriers of aluminum and iron respectively. The distribution of olivine in the maria agrees with previous studies; in the highlands the abundance of olivine is low but ubiquitous at a few percent, except within the South Pole-Aitken basin where it is only present in very small exposures. In the very anorthositic farside highlands, olivine is often the sole mafic mineral. The abundance of orthopyroxene is generally low, excepting elevated abundances in the nearside highlands and in areas near and within South Pole-Aitken basin. Mare units with elevated abundances of orthopyroxene are found in some mare and cryptomare deposits distant from the sample return sites.
[82]
Andersson LA, Whitaker EA.
NASA Catalogue of Lunar Nomenclature
[M]. United States: NASA Reference Publication, 1982.
LU60645GT and MA132843GT catalogues of Lunar and Martian impact craters developed using a Crater Shape—Based interpolation crater detection algorithm for topography data
Automatic extraction of lunar impact craters from Chang'E-1 satellite photographs
1
2012
... 基于DEM的撞击坑自动分类主要是利用地形信息对撞击坑识别、分类,Wan等[64]采用DEM填洼、面向对象分类、DEM填洼的面向对象分类3种自动提取方法在DEM上进行撞击坑提取试验,表明填洼—面向对象的方法具有更高的提取精度;Salamuni car 等[65,66]利用DEM数据,运用霍夫变换、特征匹配面向对象等方法对火星和月球上的撞击坑进行了自动提取,得到了一系列撞击坑数据目录;Luo等[67]也利用嫦娥一号的DEM数据获得的地形指标,获得了全月球直径大于10 km的撞击坑边界;Di等[68]基于地形数据,利用机器学习方法提取撞击坑.Bue等[69]不仅考虑到了坡度信息,还加入了纹理和剖面曲率信息,以提高撞击坑识别的精度;Hawke等[70]采用形态和纹理特征对亚公里级别的撞击坑进行识别. ...
Method for crater detection from Martian digital topography data using gradient value orientation, morphometry, votes-analysis, slip-tuning and calibration
1
2010
... 基于DEM的撞击坑自动分类主要是利用地形信息对撞击坑识别、分类,Wan等[64]采用DEM填洼、面向对象分类、DEM填洼的面向对象分类3种自动提取方法在DEM上进行撞击坑提取试验,表明填洼—面向对象的方法具有更高的提取精度;Salamuni car 等[65,66]利用DEM数据,运用霍夫变换、特征匹配面向对象等方法对火星和月球上的撞击坑进行了自动提取,得到了一系列撞击坑数据目录;Luo等[67]也利用嫦娥一号的DEM数据获得的地形指标,获得了全月球直径大于10 km的撞击坑边界;Di等[68]基于地形数据,利用机器学习方法提取撞击坑.Bue等[69]不仅考虑到了坡度信息,还加入了纹理和剖面曲率信息,以提高撞击坑识别的精度;Hawke等[70]采用形态和纹理特征对亚公里级别的撞击坑进行识别. ...
Test-field for evaluation of laboratory craters using a Crater Shape—Based interpolation crater detection algorithm and comparison with Martian and Lunar impact craters
1
2012
... 基于DEM的撞击坑自动分类主要是利用地形信息对撞击坑识别、分类,Wan等[64]采用DEM填洼、面向对象分类、DEM填洼的面向对象分类3种自动提取方法在DEM上进行撞击坑提取试验,表明填洼—面向对象的方法具有更高的提取精度;Salamuni car 等[65,66]利用DEM数据,运用霍夫变换、特征匹配面向对象等方法对火星和月球上的撞击坑进行了自动提取,得到了一系列撞击坑数据目录;Luo等[67]也利用嫦娥一号的DEM数据获得的地形指标,获得了全月球直径大于10 km的撞击坑边界;Di等[68]基于地形数据,利用机器学习方法提取撞击坑.Bue等[69]不仅考虑到了坡度信息,还加入了纹理和剖面曲率信息,以提高撞击坑识别的精度;Hawke等[70]采用形态和纹理特征对亚公里级别的撞击坑进行识别. ...
Global detection of large lunar craters based on the CE-1 digital elevation model
1
2013
... 基于DEM的撞击坑自动分类主要是利用地形信息对撞击坑识别、分类,Wan等[64]采用DEM填洼、面向对象分类、DEM填洼的面向对象分类3种自动提取方法在DEM上进行撞击坑提取试验,表明填洼—面向对象的方法具有更高的提取精度;Salamuni car 等[65,66]利用DEM数据,运用霍夫变换、特征匹配面向对象等方法对火星和月球上的撞击坑进行了自动提取,得到了一系列撞击坑数据目录;Luo等[67]也利用嫦娥一号的DEM数据获得的地形指标,获得了全月球直径大于10 km的撞击坑边界;Di等[68]基于地形数据,利用机器学习方法提取撞击坑.Bue等[69]不仅考虑到了坡度信息,还加入了纹理和剖面曲率信息,以提高撞击坑识别的精度;Hawke等[70]采用形态和纹理特征对亚公里级别的撞击坑进行识别. ...
A machine learning approach to crater detection from topographic data
1
2014
... 基于DEM的撞击坑自动分类主要是利用地形信息对撞击坑识别、分类,Wan等[64]采用DEM填洼、面向对象分类、DEM填洼的面向对象分类3种自动提取方法在DEM上进行撞击坑提取试验,表明填洼—面向对象的方法具有更高的提取精度;Salamuni car 等[65,66]利用DEM数据,运用霍夫变换、特征匹配面向对象等方法对火星和月球上的撞击坑进行了自动提取,得到了一系列撞击坑数据目录;Luo等[67]也利用嫦娥一号的DEM数据获得的地形指标,获得了全月球直径大于10 km的撞击坑边界;Di等[68]基于地形数据,利用机器学习方法提取撞击坑.Bue等[69]不仅考虑到了坡度信息,还加入了纹理和剖面曲率信息,以提高撞击坑识别的精度;Hawke等[70]采用形态和纹理特征对亚公里级别的撞击坑进行识别. ...
Machine detection of martian impact craters from digital topography Data
1
2007
... 基于DEM的撞击坑自动分类主要是利用地形信息对撞击坑识别、分类,Wan等[64]采用DEM填洼、面向对象分类、DEM填洼的面向对象分类3种自动提取方法在DEM上进行撞击坑提取试验,表明填洼—面向对象的方法具有更高的提取精度;Salamuni car 等[65,66]利用DEM数据,运用霍夫变换、特征匹配面向对象等方法对火星和月球上的撞击坑进行了自动提取,得到了一系列撞击坑数据目录;Luo等[67]也利用嫦娥一号的DEM数据获得的地形指标,获得了全月球直径大于10 km的撞击坑边界;Di等[68]基于地形数据,利用机器学习方法提取撞击坑.Bue等[69]不仅考虑到了坡度信息,还加入了纹理和剖面曲率信息,以提高撞击坑识别的精度;Hawke等[70]采用形态和纹理特征对亚公里级别的撞击坑进行识别. ...
The origin of lunar crater rays
1
2004
... 基于DEM的撞击坑自动分类主要是利用地形信息对撞击坑识别、分类,Wan等[64]采用DEM填洼、面向对象分类、DEM填洼的面向对象分类3种自动提取方法在DEM上进行撞击坑提取试验,表明填洼—面向对象的方法具有更高的提取精度;Salamuni car 等[65,66]利用DEM数据,运用霍夫变换、特征匹配面向对象等方法对火星和月球上的撞击坑进行了自动提取,得到了一系列撞击坑数据目录;Luo等[67]也利用嫦娥一号的DEM数据获得的地形指标,获得了全月球直径大于10 km的撞击坑边界;Di等[68]基于地形数据,利用机器学习方法提取撞击坑.Bue等[69]不仅考虑到了坡度信息,还加入了纹理和剖面曲率信息,以提高撞击坑识别的精度;Hawke等[70]采用形态和纹理特征对亚公里级别的撞击坑进行识别. ...
Hybrid method for crater detection based on topography reconstruction from optical images and the new LU78287GT catalogue of lunar impact craters

 , 刘樯漪
, 刘樯漪
