Research Progress of Relative Humidity and Its Changing Annual Cycle
Nian Da, Deng Qimin, Fu Zuntao*,
Laboratory for Climate and Ocean-Atmosphere Studies, Department of Atmospheric and Oceanic Sciences, School of Physics, Peking University, Beijing 100871, China
Studies on the characteristics of relative humidity annual cycle change include the frequency, phase, and amplitude of the time series and their changes. The effective diagnosis of the relative humidity annual cycle can provide important help in the monitoring and regulation of seasonal haze, the spatial distribution of epidemic outbreaks and their prevention and control, and the real-time forecasting and decision-making of monsoon precipitation. Different from studies on the trend of the relative humidity, the diagnosis in the annual cycle is scarce. This paper summarized the research status of relative humidity and its annual cycle, introduced several current methods for extracting common signals, and evaluated the feasibility of these methods for extracting annual cycle signals. Due to the time-varying characteristics of the annual cycle of relative humidity and complex structures such as asymmetric triangular waves, square-like waves, and state transients, harmonic-based extraction methods are difficult to succeed. The nonlinear signal extraction method with high noise immunity will solve this problem. At present, the relative humidity annual cycle studies urgently need to be improved and improve the quality of relative humidity observation data, accurately extract and quantify the time-varying characteristics and complex structure of the annual cycle. Moreover, combining the dynamic process and statistical analysis, we also need to study the physical mechanism of the change of relative humidity annual cycle (frequency, phase, amplitude, etc.) in China.
Keywords:Relative humidity
;
Annual cycle
;
Time series decomposition.
NMD方法主要分为4个步骤:①基于时频分析技术(Time Frequency Representition,TFR)提取信号中的基础谐波成分;②基于基础谐波性质,找出其可能存在的所有候选谐波;③通过代用数据检验法从候选谐波中取出真的谐波,组成一组NM;④从信号中减去该组NM,重复前面3个步骤,直到达到停止条件。由于采用代用数据检验方法,可以更有效地去除噪声和没有物理意义的分解结果。
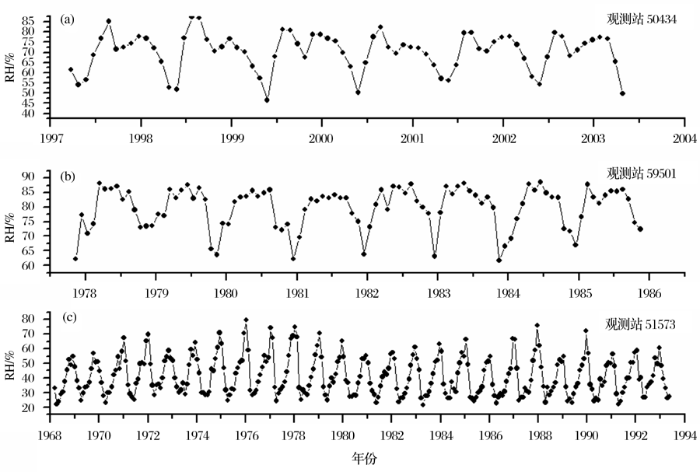
Fig.1 Segments of monthly averaged relative humidity records of three stations in China(a) Records from 1997/3 to 2003/3 at station 50434; (b) Records from 1977/10 to 1985/10 at station 59501;(c) Records from 1968/2 to 1993/5 at station 51573
Observations: Surface and atmospheric climate change
[M]//Solomon S, Qin D, Manning M, et al, eds. Climate Change 2007: The Physical Science Basis: Contribution of Working Group I to the Fourth Assessment Report of the Intergovernmental Panel on Climate Change, 2007: 235-336.
An approach to climate change feedback analysis is described in which tropospheric relative humidity replaces specific humidity as the state variable that, along with the temperature structure, surface albedos, and clouds, controls the magnitude of the response of global mean surface temperature to a radiative forcing. Despite being simply a regrouping of terms in the feedback analysis, this alternative perspective has the benefit of removing most of the pervasive cancellation between water and lapse-rate feedbacks seen in models. As a consequence, the individual feedbacks have less scatter than in the traditional formulation. The role of cloud feedbacks in controlling climate sensitivity is also reflected more clearly in the new formulation.
[3]
Sherwood SC, IngramW, TsushimaY, et al.
Relative humidity changes in a warmer climate
[J]. Journal of Geophysical Research, 2010, 115(D9): 1 063.
[1] Key climate feedback due to water vapor and clouds rest largely on how relative humidity 090407 changes in a warmer climate, yet this has not been extensively analyzed in models. General circulation models (GCMs) from the CMIP3 archive and several higher-resolution atmospheric GCMs examined here generally predict a characteristic pattern of 090407 trend with global temperature that has been reported previously in individual models, including increase around the tropopause, decrease in the tropical upper troposphere, and decrease in midlatitudes. This pattern is very similar to that previously reported for cloud cover in the same GCMs, confirming the role of 090407 in controlling changes in simulated cloud. Comparing different models, the trend in each part of the troposphere is approximately proportional to the upward and/or poleward gradient of 090407 in the present climate. While this suggests that the changes simply reflect a shift of the 090407 pattern upward with the tropopause and poleward with the zonal jets, the drying trend in the subtropics is roughly 3 times too large to be attributable to shifts of subtropical features, and the subtropical 090407 minima deepen in most models. 090407 trends are correlated with horizontal model resolution, especially outside the tropics, where they show signs of convergence and latitudinal gradients become close to available observations for GCM resolutions near T85 and higher. We argue that much of the systematic change in 090407 can be explained by the local specific humidity having been set (by condensation) in remote regions with different temperature changes, hence the gradients and trends each depend on a model's ability to resolve moisture transport. Finally, subtropical drying trends predicted from the warming alone fall well short of those observed in recent decades. While this discrepancy supports previous reports of GCMs underestimating Hadley cell expansion, our results imply that shifts alone are not a sufficient interpretation of changes.
[4]
XieB, ZhangQ, YingY.
Trends in precipitable water and relative humidity in China: 1979-2005
[J]. Journal of Applied Meteorology and Climatology, 2011, 50(10): 1 985-1 994.
ABSTRACT Annual and seasonal trends of precipitable water (PW) and relative humidity (RH) at 850, 700, and 500 hPa are studied using the data from 106 radiosonde stations over China during the period 1979-2005. Analysis shows evidence of an increase in PW associated with the slight warming observed in the lower to midtroposphere over China. The northern part of China shows a significant upward trend of PW in summer, and drying of the atmosphere in winter is found in most regions over China. Annual and seasonal trends in RH at the 850-, 700-, and 500-hPa levels show no significant trends in most regions in China except for Xinjiang, which shows an upward trend, and central China, where there was a downward trend in RH at 500 hPa. It is found that changes in PW are coincident with the warming of the surface and the lower to midtroposphere. The RH in the lower to midtroposphere in most regions over China has remained steady during the most recent 30 years, as might be expected given the increasing of PW and the warming above the surface. The long-term trend of precipitation over China may be linked to the trends of PW and RH at the lower level and midlevel.
[5]
Schmidt GA, Ruedy RA, Miller RL, et al.
Attribution of the present-day total greenhouse effect
[J]. Journal of Geophysical Research, 2010, 115(D20): 20 106
[M]//Houghton J T, Ding Y, Griggs D J, et al, eds. Climate Change 2001: The Scientific Basis: Contribution of Working Group I to the Third Assessment Report of the Intergovernmental Panel, 2001: 526-582.
Abstract Present and past weather reports from 651565000 stations around the globe and from the Comprehensive Ocean–Atmosphere Data Set from 1975 to 1997 were analyzed for the frequency of occurrence for and the percentage of the days with various types of precipitation (drizzle, nondrizzle, showery, nonshowery, and snow) and thunderstorms. In this paper, the mean geographical, seasonal, and interannual variations in the frequencies are documented. Drizzles occur most frequently (655%–15% of the time) over mid- and high-latitude oceans. Nonshowery precipitation is the preferred form of precipitation over the storm-track regions at northern mid- and high latitudes in boreal winter and over the Antarctic Circumpolar Current in all seasons. Showery precipitation occurs 655%–20% of the time over the oceans, as compared with < 10% over land areas except in boreal summer over Northern Hemisphere land areas, where showery precipitation and thunderstorms occur in over 20% of the days. Inferred mean precipitation inte...
[8]
DaiA.Global precipitation and thunderstorm frequencies.
Part II: Diurnal variations
[J]. Journal of Climate, 2001, 14(6): 1 112-1 128.
Three-hourly present weather reports from 15 000 stations around the globe and from the Comprehensive Ocean tmosphere Data Set from 1975 to 1997 were analyzed for diurnal variations in the frequency of occurrence for various types of precipitation (drizzle, nondrizzle, showery, nonshowery, and snow) and thunderstorms. Significant diurnal variations with amplitudes exceeding 20% of the daily mean are found over much of the globe, especially over land areas and during summer. Drizzle and nonshowery precipitation occur most frequently in the morning around 0600 local solar time (LST) over most land areas and from midnight to 0400 LST over many oceanic areas. Showery precipitation and thunderstorms occur much more frequently in the late afternoon than other times over most land areas in all seasons, with a diurnal amplitude exceeding 50% of the daily mean frequencies. Over the North Pacific, the North Atlantic, and many other oceanic areas adjacent to continents, showery precipitation is most frequent in the morning around 0600 LST, which is out of phase with land areas. Over the tropical and southern oceans, showery precipitation tends to peak from midnight to 0400 LST. Maritime thunderstorms occur most frequently around midnight. It is suggested that the diurnal variations in atmospheric relative humidity contribute to the morning maximum in the frequency of occurrence for drizzle and nonshowery precipitation, especially over land areas. Solar heating on the ground produces a late-afternoon maximum of convective available potential energy in the atmosphere that favors late-afternoon moist convection and showery precipitation over land areas during summer. This strong continental diurnal cycle induces a diurnal cycle of opposite phase in low-level convergence over large nearby oceanic areas that favors a morning maximum of maritime showery precipitation. Larger low-level convergence induced by pressure tides and higher relative humidity at night than at other times may contribute to the nighttime maximum of maritime showery and nonshowery precipitation over remote oceans far away from continents.
[9]
ZhaoT, WangJ, DaiA.
Evaluation of atmospheric precipitable water from reanalysis products using homogenized radiosonde observations over China
Surface solar radiation has undergone decadal variations since the middle of the twentieth century, producing global `dimming' and `brightening' effects. These variations presumably result from changes in aerosol burden and clouds, but the detailed processes involved have yet to be determined. Over Europe, the marked solar radiation increase since the 1980s is thought to have contributed to the observed large continental warming, but this contribution has not been quantified. Here we analyse multidecadal data of horizontal visibility, and find that the frequency of low-visibility conditions such as fog, mist and haze has declined in Europe over the past 30 years, for all seasons and all visibility ranges between distances of 0 and 8km. This decline is spatially and temporally correlated with trends in sulphur dioxide emissions, suggesting a significant contribution of air-quality improvements. Statistically linking local visibility changes with temperature variations, we estimate that the reduction in low-visibility conditions could have contributed on average to about 10-20% of Europe's recent daytime warming and to about 50% of eastern European warming. Large improvements in air quality and visibility already achieved in Europe over the past decades may mean that future reductions in the frequency of low-visibility events will be limited, possibly leading to less rapid regional warming.
[11]
Virmani JI, Weisberg RH.
Relative humidity over the West Florida continental shelf
Observed relative humidity variations on the coastal ocean of the West Florida Continental Shelf (WFS) are examined over the 5-yr period 199809“2003. Despite considerable daily variability within seasons, the monthly mean values are nearly constant at about 75%. Summertime specific humidity is twice that during winter, so high air temperatures are responsible for the low summer monthly mean relative humidities. Winter has the greatest relative humidity variability; values range from less than 50% to over 100% as extratropical fronts move over the WFS. Saturation (and fog) occurs as warm moist air passes over colder water. Two different sensors, mounted on multiple moorings, were used to make these observations. Monthly mean values from the Rotronics MP-100F are higher than the Hygrometrix 1020SHT. In addition to sensor differences, a contributing cause to this offset appears to be the locations chosen for sensor deployment. NCEP reanalysis climatology over the WFS and land-based coastal data both show an annual cycle in monthly mean relative humidity, with higher values in summer, suggesting that the reanalysis field is influenced by land. Air09“sea fluxes over the WFS are sensitive to small spatial variability in the coastal ocean and atmosphere. The large grid spacing of the NCEP reanalysis does not capture this variability. The lack of coastal ocean data for assimilation biases the NCEP reanalysis fields toward land-based measurements. Increased spatial coverage via evolving Coastal Ocean Observing Systems should remedy this problem by providing required information for describing and understanding the complicated ocean09“atmosphere interactions that occur on continental shelves.
[12]
GultepeI.
Fog and boundary Layer Clouds: Fog Visibility and Forecasting
We present a calibrated atmospheric humidity series for Armagh Observatory, Northern Ireland. Beginning in 1838 and continuing to the present day, this series is believed to be the longest presented so far. Daily wet-bulb and dry-bulb temperature readings are corrected for the time of reading and for known instrumental errors to determine mean monthly, seasonal and annual relative humidity (RH) at 09:00 GMT from 1838 to 2008 and at 21:00 GMT from 1844 to 1964.The mean seasonal and annual time series of RH at this site show only marginal evidence for a trend in RH since the 1880s, however, there is significant decadal and multi-decadal variability, some of which appears to be cyclic. Wavelet analysis indicates the presence of two quasi-periodic components in RH, one ranging from 23.4 to 25.5 years and the other from 36 to 51 years. We discuss potential physical origins of these cycles such as changes in the atmospheric and thermohaline circulation and the solar magnetic cycle. There is a small but significant anti-correlation between RH and northerly winds.Two conspicuous peaks in RH during the 19th century coincide with major infestations of potato blight in Ireland. Copyright 2011 Royal Meteorological Society
[15]
Lowen AC, MubarekaS, SteelJ, et al.
Influenza virus transmission is dependent on relative humidity and temperature
Using the guinea pig as a model host, we show that aerosol spread of influenza virus is dependent upon both ambient relative humidity and temperature. Twenty experiments performed at relative humidities from 20% to 80% and 5 °C, 20 °C, or 30 °C indicated that both cold and dry conditions favor transmission. The relationship between transmission via aerosols and relative humidity at 20 °C is similar to that previously reported for the stability of influenza viruses (except at high relative humidity, 80%), implying that the effects of humidity act largely at the level of the virus particle. For infected guinea pigs housed at 5 °C, the duration of peak shedding was approximately 40 h longer than that of animals housed at 20 °C; this increased shedding likely accounts for the enhanced transmission seen at 5 °C. To investigate the mechanism permitting prolonged viral growth, expression levels in the upper respiratory tract of several innate immune mediators were determined. Innate responses proved to be comparable between animals housed at 5 °C and 20 °C, suggesting that cold temperature (5 °C) does not impair the innate immune response in this system. Although the seasonal epidemiology of influenza is well characterized, the underlying reasons for predominant wintertime spread are not clear. We provide direct, experimental evidence to support the role of weather conditions in the dynamics of influenza and thereby address a long-standing question fundamental to the understanding of influenza epidemiology and evolution. In temperate regions influenza epidemics recur with marked seasonality: in the northern hemisphere the influenza season spans November to March, while in the southern hemisphere epidemics last from May until September. Although seasonality is one of the most familiar features of influenza, it is also one of the least understood. Indoor crowding during cold weather, seasonal fluctuations in host immune responses, and environmental factors, including relative humidity, temperature, and UV radiation have all been suggested to account for this phenomenon, but none of these hypotheses has been tested directly. Using the guinea pig model, we have evaluated the effects of temperature and relative humidity on influenza virus spread. By housing infected and na07ve guinea pigs together in an environmental chamber, we carried out transmission experiments under conditions of controlled temperature and humidity. We found that low relative humidities of 20%–35% were most favorable, while transmission was completely blocked at a high relative humidity of 80%. Furthermore, when guinea pigs were kept at 5 °C, transmission occurred with greater frequency than at 20 °C, while at 30 °C, no transmission was detected. Our data implicate low relative humidities produced by indoor heating and cold temperatures as features of winter that favor influenza virus spread.
[16]
Peixoto JP, Oort AH.
The climatology of relative humidity in the atmosphere
[J]. Journal of Climate, 1996, 9(12): 3 443-3 463.
Abstract The present paper deals with the analysis of the time-average relative humidity fields in the atmosphere. Twice-daily estimates of relative humidity are used. After some theoretical considerations on the relations between relative humidity, other moisture parameters, and temperature, a critical analysis of the various sources of data is made considering their possible limitations. Various methods of computing relative humidity are formulated and discussed. The global distribution of relative humidity at various levels shows that it is not zonally uniform with centers of various intensities at all latitudes. The global maps show maxima in the equatorial zone and minima in the dry subtropical belts around 30°N and 30°S. The land–sea contrast and variations related to the orographic relief are also apparent. The general pattern of relative humidity is similar at all levels but its magnitude decreases with altitude. The seasonal analyses show a similar pattern as the annual analyses but are slightly ...
[17]
Gaffen DJ, Ross RJ.
Climatology and trends of US surface humidity and temperature
Climatological surface temperature and humidity variables for China are presented based on 6-hourly data from 196 stations for the period of 1961-90. Seasonal and annual means for daytime, nighttime, and the full day are shown. The seasonal cycle of moisture is primarily controlled by the east Asia monsoon system, with dominant factors of temperature change in northern and western China and of moisture advection associated with monsoon circulations in the southeast.Trends during 1951-94 are estimated for each station and for four regions of the country, with attention paid to the effects of changes in instrumentation, observing time, and station locations. The data show evidence of increases in both temperature and atmospheric moisture content. Temperature and specific humidity trends are larger at nighttime than daytime and larger in winter than summer. Moisture increases are observed over most of China. The increases are several percent per decade for specific humidity, and several tenths of a degree per decade for temperature and dewpoint. Increasing trends in summertime temperature and humidity contribute to upward trends in apparent temperature, a measure of human comfort.
[20]
Worley SJ, Woodruff SD, Reynolds RW, et al.
ICOADS release 2.1 data and products
[J]. International Journal of Climatology, 2005, 25(7): 823-842.
The International Comprehensive Ocean–Atmosphere Data Set (ICOADS), release 2.1 (1784–2002), is the largest available set of in situ marine observations. Observations from ships include instrument measurements and visual estimates, and data from moored and drifting buoys are exclusively instrumental. The ICOADS collection is constructed from many diverse data sources, and made inhomogeneous by the changes in observing systems and recording practices used throughout the period of record, which is over two centuries. Nevertheless, it is a key reference data set that documents the long-term environmental state, provides input to a variety of critical climate and other research applications, and serves as a basis for many associated products and analyses. The observational database is augmented with higher level ICOADS data products. The observed data are synthesized to products by computing statistical summaries, on a monthly basis, for samples within 2° latitude × 2° longitude and 1° × 1° boxes beginning in 1800 and 1960 respectively. For each resolution the summaries are computed using two different data mixtures and quality control criteria. This partially controls and contrasts the effects of changing observing systems and accounts for periods with greater climate variability. The ICOADS observations and products are freely distributed worldwide. The standard ICOADS release is supplemented in several ways; additional summaries are produced using experimental quality control, additional observations are made available in advance of their formal blending into a release, and metadata that define recent ships' physical characteristics and instruments are available. Copyright 08 2005 Royal Meteorological Society
[21]
Van Wijngaarden WA, Vincent LA.
Examination of discontinuities in hourly surface relative humidity in Canada during 1953-2003
[J].Journal of Geophysical Research, 2005, 110(D22): 3 093-3 109.
[1] Hourly values of relative humidity recorded at 75 stations across Canada were examined. Data were checked for possible discontinuities arising because of changes in procedures and instruments. It was found that the replacement of the psychrometer by the dewcel has produced a decreasing step in relative humidity at a number of stations. The historical records were closely examined to retrieve the dewcel installation date, and a procedure based on regression models was applied to determine if it corresponds to a significant step. Results show that there are more stations experiencing a dewcel step in the winter than in the summer. Examination of the trends also reveals that the step often accentuates the decreasing trends originally observed during winter and spring. However, significant steps taken into account, it appears that the relative humidity still decreased by several percent in the spring during 1953 2003 in western Canada. It seems that the southern and coastal stations are not as much affected by this change of instruments.
[22]
Vincent LA, van Wijngaarden WA, HopkinsonR.
Surface temperature and humidity trends in Canada for 1953-2005
[J]. Journal of Climate, 2007, 20(20): 5 100-5 113.
Annual and seasonal trends in temperature, dewpoint, relative humidity, and specific humidity are presented for the period 195309“2005. The analysis uses hourly observations from 75 climatological stations across Canada. Data were examined for discontinuities due to changes in instruments and observing practice. It was found that the main discontinuity corresponds to the replacement of the psychrometer by the dewcel in the early 1970s, which created an artificial negative step in relative humidity and dewpoint at many locations. After accounting for these discontinuities, the results of trend analysis show evidence of an increase in air moisture content associated with the warming observed in the country. During winter and spring, the significant warming in the western and southern regions is accompanied by an increase in dewpoint and specific humidity and by a decrease in relative humidity; in summer, warming is observed in the southeast and it is associated with significant positive trends in dewpoint and specific humidity. Although there is no strong evidence of a greater nighttime warming in Canada over 195309“2005, the nighttime dewpoint and specific humidity trends are slightly larger than the daytime trends, especially during the spring and summer.
[23]
Willett KM, Jones PD, Gillett NP, et al.
Recent changes in surface humidity: Development of the HadCRUH dataset
[J]. Journal of Climate, 2008, 21(20): 5 364-5 383.
Water vapor constitutes the most significant greenhouse gas, is a key driver of many atmospheric processes, and hence, is fundamental to understanding the climate system. It is a major factor in human “heat stress,” whereby increasing humidity reduces the ability to stay cool. Until now no truly global homogenized surface humidity dataset has existed with which to assess recent changes. The Met Office Hadley Centre and Climatic Research Unit Global Surface Humidity dataset (HadCRUH), described herein, provides a homogenized quality controlled near-global 5° by 5° gridded monthly mean anomaly dataset in surface specific and relative humidity from 1973 to 2003. It consists of land and marine data, and is geographically quasi-complete over the region 60°N–40°S. Between 1973 and 2003 surface specific humidity has increased significantly over the globe, tropics, and Northern Hemisphere. Global trends are 0.11 and 0.07 g kg611 (10 yr)611 for land and marine components, respectively. Trends are consistently larger in the tropics and in the Northern Hemisphere during summer, as expected: warmer regions exhibit larger increases in specific humidity for a given temperature change under conditions of constant relative humidity, based on the Clausius–Clapeyron equation. Relative humidity trends are not significant when averaged over the landmass of the globe, tropics, and Northern Hemisphere, although some seasonal changes are significant. A strong positive bias is apparent in marine humidity data prior to 1982, likely owing to a known change in reporting practice for dewpoint temperature at this time. Consequently, trends in both specific and relative humidity are likely underestimated over the oceans.
[24]
Willett KM, Jones PD, Thorne PW, et al.
A comparison of large scale changes in surface humidity over land in observations and CMIP3 general circulation models
[J]. Environmental Research Letters, 2010, 5(2): 025210.
Low-frequency variations in surface atmospheric humidity, temperature, and precipitation: Inferences from reanalyses and monthly gridded observational data sets
[J]. Journal of Geophysical Research, 2010, 115(D1): 1-21.
Randall DA, Wood RA, BonyS, et al.Climate models and their evaluation[M]//Climate Change 2007: The Physical Science basis. Contribution of Working Group I to the Fourth Assessment Report of the IPCC (FAR). Cambridge: Cambridge University Press, 2007: 589-662.
Radiative convective equilibrium of the atmosphere with a given distribution of relative humidity is computed as the asymptotic state of an initial value problem.The results show that it takes almost twice as long to reach the state of radiative convective equilibrium for the atmosphere with a given distribution of relative humidity than for the atmosphere with a given distribution of absolute humidity.Also, the surface equilibrium temperature of the former is almost twice as sensitive to change of various factors such as solar constant, COcontent, Ocontent, and cloudiness, than that of the latter, due to the adjustment of water vapor content to the temperature variation of the atmosphere.According to our estimate, a doubling of the COcontent in the atmosphere has the effect of raising the temperature of the atmosphere (whose relative humidity is fixed) by about 2C. Our model does not have the extreme sensitivity of atmospheric temperature to changes of COcontent which was adduced by M ller.
[28]
ManabeS, Wetherald RT.
The effects of doubling the CO2 concentration on the climate of a general circulation model
[J]. Journal of the Atmospheric Sciences, 1975, 32(1): 3-15.
[1] Atmospheric water vapor plays a key role in the climate. Numerical model calculations suggest that global mean relative humidity (RH) stays approximately constant in global warming scenarios. Here, we analyze the September 2002 to April 2011 daily mean free tropospheric relative humidity (RH) data from the Atmospheric Infrared Sounder (AIRS), version 5 level 3 data at a spatial resolution of 100°/100° longitude/latitude. We perform a multiple linear regression analysis with annual harmonics, trend and an El-Ni01±o090009Southern Oscillation (ENSO) index. For the mean annual cycle, we find strong compensation of local variability upon global averaging, leaving an amplitude for the global mean of about 4% RH (peak to peak) at 300 hPa, with the minimum in February. The amplitude decreases to about 2.5%RH at 500 hPa (with minimum shifted to boreal summer/early fall) and less than 2%RH further below. For ENSO, the local changes compensate strongly upon global averaging. Computational limitations restrict detailed analysis of the residual to the zonal mean residual, which we interpret with a stochastic model that takes the latitudinal covariance into account. We find that the relation between zonal mean residual RH variations (understood as the consequence of 090004weather090005 and subseasonal variability) and their global mean is equivalent to that of about 9 independent random time series with appropriate variances. The residual contributes more to the variance of the global mean than the harmonics and ENSO on all free tropospheric levels except 400 hPa. Our results apply to the AIRS version 5 data as reported, and possible problems in that data are discussed.
[33]
Willett KM, Williams Jr C N, Dunn R J H, et al.
HadISDH: An updateable land surface specific humidity product for climate monitoring
HadISDH is a near-global land surface specific humidity monitoring product providing monthly means from 1973 onwards over large-scale grids. Presented herein to 2012, annual updates are anticipated. HadISDH is an update to the land component of HadCRUH, utilising the global high-resolution land surface station product HadISD as a basis. HadISD, in turn, uses an updated version of NOAA's Integrated Surface Database. Intensive automated quality control has been undertaken at the individual observation level, as part of HadISD processing. The data have been subsequently run through the pairwise homogenisation algorithm developed for NCDC's US Historical Climatology Network monthly temperature product. For the first time, uncertainty estimates are provided at the grid-box spatial scale and monthly timescale. <br><br> HadISDH is in good agreement with existing land surface humidity products in periods of overlap, and with both land air and sea surface temperature estimates. Widespread moistening is shown over the 1973???2012 period. The largest moistening signals are over the tropics with drying over the subtropics, supporting other evidence of an intensified hydrological cycle over recent years. Moistening is detectable with high (95%) confidence over large-scale averages for the globe, Northern Hemisphere and tropics, with trends of 0.089 (0.080 to 0.098) g kg???1 per decade, 0.086 (0.075 to 0.097) g kg???1 per decade and 0.133 (0.119 to 0.148) g kg???1 per decade, respectively. These changes are outside the uncertainty range for the large-scale average which is dominated by the spatial coverage component; station and grid-box sampling uncertainty is essentially negligible on large scales. A very small moistening (0.013 (???0.005 to 0.031) g kg???1 per decade) is found in the Southern Hemisphere, but it is not significantly different from zero and uncertainty is large. When globally averaged, 1998 is the moistest year since monitoring began in 1973, closely followed by 2010, two strong El Ni??o years. The period in between is relatively flat, concurring with previous findings of decreasing relative humidity over land.
[34]
FatichiS, MolnarP, MastrotheodorosT, et al.
Diurnal and seasonal changes in near-surface humidity in a complex orography
[J]. Journal of Geophysical Research, 2015, 120(6): 2 358-2 374.
Abstract Changes in near-surface humidity are evaluated in relation to changes in other meteorological variables such as air temperature, precipitation, and sunshine duration for a 31 ear period (1981 2011) using hourly time series recorded in Switzerland. Trends in meteorological variables are analyzed at the seasonal and subdaily scale, and changes in water vapor are tested for Clausius-Clapeyron scaling. Results show a marked seasonality of climatic changes with a trend toward warmer, clearer, and drier near-surface atmosphere strengthening from January to June. During this period considerable negative trends in relative humidity are detected. An abrupt shift in climatic trends occurs during the month of July, after which warming trends are considerably smaller and relative humidity remains constant or increases. An evaluation of reanalysis products demonstrates strong consistency with station observations and when combined with teleconnection indices supports the hypothesis that shifts in the general circulation patterns rather than local feedbacks are the principal drivers of observed seasonality of climate change. However, local feedbacks can play a role in enhancing summer humidity and convective activity (lightning and evening precipitation). Subdaily changes are significant with more pronounced daytime trends of temperature and humidity during spring and the opposite during summer. The strong seasonality and diurnal variability of changes in near-surface meteorology over the last three decades in Switzerland warns against climate change impact assessments at local scale that consider uniform changes in air temperature and assume Clausius-Clapeyron scaling for near-surface humidity.
[35]
WypychA.
Twentieth century variability of surface humidity as the climate change indicator in Kraków (Southern Poland)
[J]. Theoretical and Applied Climatology, 2010, 101(3/4): 475-482.
We analyzed the evolution of surface relative humidity (RH) and specific humidity (q) in Spain, based on complete records available from the State Meteorological Agency of Spain. The surface RH records used span the period 1920 2011, but because of spatial and temporal constraints in the dataset we used a subset of the data, covering the period 1961 2011. The subset contained 50 monthly series of RH, which were created through a process of quality control, reconstruction and homogenization. The data shows that there was a large decrease in RH over mainland Spain from 1961 to 2011, which was greatest in spring and summer. In contrast, there was no overall change in the specific humidity in this period, except in spring, when an increase was observed. The decrease in RH affected the entire country, but the changes in specific humidity were less homogeneous. For specific humidity there was a general increase in the northern and eastern parts of Spain, whereas negative trends dominated in the central and southern areas, mainly during the summer months. The results suggest that an increase in the water holding capacity of the atmosphere as a consequence of warming during recent decades has not been accompanied by an increase in the surface water vapor content, probably because the supply of water vapor from the main terrestrial and oceanic areas has been constrained. We discuss the implications of these findings for evapotranspiration processes, precipitation and water management in Spain.
[37]
Shiu CJ, Liu SC, Chen JP.
Diurnally asymmetric trends of temperature, humidity, and precipitation in Taiwan
[J]. Journal of Climate, 2009, 22(21): 5 635-5 649.
In this work, 45 years (1961 2005) of hourly meteorological data in Taiwan, including temperature, humidity, and precipitation, have been analyzed with emphasis on their diurnal asymmetries. A long-term decreasing trend for relative humidity (RH) is found, and the trend is significantly greater in the nighttime than in the daytime, apparently resulting from a greater warming at night. The warming at night in three large urban centers is large enough to impact the average temperature trend in Taiwan significantly between 1910 and 2005. There is a decrease in the diurnal temperature range (DTR) that is largest in major urban areas, and it becomes smaller but does not disappear in smaller cities and offshore islands. The nighttime reduction in RH is likely the main cause of a significant reduction of fog events over Taiwan. The smaller but consistent reductions in DTR and RH in the three off-coast islands suggests that, in addition to local land use changes, a regional-scale process such as the indirect effect of anthropogenic aerosols may also contribute to these trends. A reduction in light precipitation (10 mm h-1) are found over Taiwan and the offshore islands. The changes in precipitation are similar to the changes of other areas in Asia, but they are different from those of the United States, Europe, and the tropical oceans. The latter do not show any reduction in light precipitation.
[38]
Hartmann DL, Klein Tank A M G, Rusticucci M, et al. Climate Change 2013: the Physical Science Basis: Working Group I Contribution to the Fifth Assessment Report of the Intergovernmental Panel on Climate Change[M]. Cambridge: Cambridge University Press, 2013.
Abstract) time series at ten coastal weather stations in Iran during 1966–2005. The serial structure of the data was considered, and the significant serial correlations were eliminated using the trend-free pre-whitening method. The results showed that annual RH increased by 1.03 and 0.2865%/decade at the northern and southern coastal regions of the country, respectively, while annual increased by 0.29 and 0.15°C per decade at the northern and southern regions, respectively. The significant trends were frequent in the series, but they were observed only at 2 out of the 50 RH series. The results showed that the difference between the results of the parametric and nonparametric tests was small, although the parametric test detected larger significant trends in the RH and time series. Furthermore, the differences between the results of the trend tests were not related to the normality of the statistical distribution.
[41]
PfahlS, NiedermannN.
Daily covariations in near-surface relative humidity and temperature over the ocean
[J]. Journal of Geophysical Research, 2011, 116(D19): 1 441-1 458.
[1] Changes in atmospheric relative humidity in concert with temperature changes in a future climate may have large consequences for the water vapor feedback, the hydrological cycle, and its interaction with weather systems. This study contributes to the basic understanding of the relationship between temperature and humidity by investigating the processes leading to synoptic-scale covariations of the two variables close to the ocean surface. Daily data from in situ observations between 1000°S and 5000°N and global ERA-Interim reanalyses are used. Correlations between temperature and both specific and relative humidity are calculated. The results from the two data sets appear to be greatly consistent. They show strong anticorrelation between temperature and relative humidity (RH) in the inner tropics with minimum correlation coefficients below 0908080.8. In midlatitudes, there are large areas where the correlation coefficient of temperature and RH is positive and greater than 0.6. The anticorrelation in the tropics is found to be related to convective precipitation, which, on the one hand, leads to local temperature decrease due to vertical mixing and reduction of solar radiation by clouds. On the other hand, rainfall is associated with an increase in boundary layer RH. Over the midlatitude ocean, daily temperature variations are mainly controlled by meridional transport, as shown with the help of backward trajectories. Moreover, advection of cold air typically goes along with vertical moisture transport, either due to large-scale subsidence or turbulent mixing, causing a reduction of near-surface RH. All together, this dynamical effect induces the positive temperature-RH correlation.
[42]
SongY, LiuY, DingY.
A study of surface humidity changes in China during the recent 50 years
Abstract) shows basically an exponential growth, according to the Clausius-Clapeyron equation. The nationwide average moistening rate in winter is obviously less than the annual average rate and the summer rate. There are some regional differences in trends in different regions of China. For example, in central and eastern parts of China exhibits a reducing trend in summer, consistent with the weakening trend of temperature in these areas; (2) except parts of South China and Jianghuai Region in eastern China, unanimously increasing trends of annual and winter specific humidity () are found in most of China, especially in western China. In summer, except parts of Northeast China, Northwest China, and some areas over the Qinghai-Tibetan Plateau, the decreasing and drying trends are significant in most of China, which is not consistent with the global mean situation; (3) the surface relative humidity (RH) in most of China shows a reducing trend. One of the major reasons for the reduction of RH is that the increasing rates of are smaller than those of . Nonetheless, upward trends of RH in central and eastern China mainly due to the cooling temperature and rising in these regions are observed in summer, leading to more precipitation. From about 2003 or so, has remarkably increased while has sharply decreased in most parts of China; therefore, RH has reduced to a great extent. This may be closely related to the persistent growth of drought areas in China in the recent 10 years.
[43]
MaoR, Gong DY, ZhaoT, et al.
Trends in the frequency of high relative humidity over China: 1979-2012
[J]. Journal of Climate, 2015, 28(24): 9 816-9 837.
High relative humidity (HRH) is defined as a relative humidity of at least 80%, which is often associated with the occurrence of cloud layers. Thus, the frequency of HRH and its changes in the troposphere may be related to the occurrence frequency of cloud layers and their changes. In this study, trends in the frequency of HRH (defined as days with relative humidity 09‰0680%) over China from the surface to the midtroposphere (09‰06400 hPa) from 1979 to 2012 were analyzed using a homogenized humidity dataset for spring (March-May), summer (June-August), autumn (September-November), and winter (December-February). The results for the ground level indicate decreasing trends at most stations in southeastern China in spring and in northern China in summer. In the lower troposphere (850 and 700 hPa), most stations over China exhibit positive trends in summer, autumn, and winter. For the midtroposphere (500-400 hPa), increasing trends dominate over China in spring, summer, and autumn. Finally, six reanalysis datasets, the NCEP-NCAR, NCEP-DOE, CFSR, ERA-Interim, MERRA, and JRA-55 datasets, were compared with the observed increasing trends in HRH frequency in the low-to-middle troposphere. Similar increasing trends in HRH frequency in the reanalysis datasets and the homogenized humidity data are observed in certain seasons and for certain regions. These results are consistent with the increasing low-to-middle cloud amounts in recent decades.
[44]
McCarthy MP, ToumiR.
Observed interannual variability of tropical troposphere relative humidity
[J]. Journal of Climate, 2004, 17(16): 3 181-3 191.
Relative humidity fields from the High-Resolution Infrared Radiation Sounder (HIRS) flown on NOAA series satellites since 1979 have been used to study the seasonal aspects of the interannual variability of relative humidity in the tropical troposphere. The El Ni o Southern Oscillation (ENSO) is the only statistically identifiable physical mechanism of such variability. Boreal winter (December February) relative humidity variations during an ENSO event follow patterns of anomalous convection and large-scale upper-level circulation. During El Ni o (La Ni a) regions of large negative (positive) relative humidity anomalies exist at subtropical latitudes over the Pacific Ocean. These are not always balanced by increases (decreases) in humidity near the equator. NCEP NCAR reanalysis temperatures are used to separate observed changes in relative humidity into contributions from tropospheric temperature versus the contribution from changes in water vapor content. The authors find that at subtropical latitudes variations in temperature contribute between 50% and 70% of the observed change in relative humidity. It is also shown that large relative humidity anomalies exist over the equatorial Indian, Atlantic, and far east Pacific Oceans during the summer season (June August) following an ENSO event. Ocean atmosphere dynamics coupled with the seasonal cycle of relative humidity explain the existence of the long-lasting effects of ENSO in the atmosphere. The authors argue that observed linear trends in regional and tropical mean relative humidity are unlikely to be due solely to ENSO or a simple intensification of the hydrological cycle.<HR ALIGN="center" WIDTH="30%">
[45]
BromanD, RajagopalanB, HopsonT.
Spatiotemporal variability and predictability of relative humidity over West African Monsoon region
[J]. Journal of Climate, 2014, 27(14): 5 346-5 363.
Abstract Monthly surface relative humidity (RH) data for 71 stations in the Tibetan Plateau (TP) provided by the National Meteorological Information Center/China Meteorological Administration are compared with corresponding grid points from the National Center for Environmental Prediction/National Center for Atmospheric Research (NCEP/NCAR hereafter) reanalysis. Mean climatologies, interannual variabilities, and trends calculated by the Mann-Kendal method are analyzed during 1961–2013. The annual regional long-term mean surface RH is 55.3%, with a clear maximum in summer (66.4%) and minimum in winter (44.9%). Compared with observations, NCEP/NCAR overestimates RH in all seasons, especially in spring (18.2%) and winter (17.8%). Mean annual regional surface RH has decreased by 610.23%65decade611 and even more rapidly in summer (610.60%65decade611) and autumn (610.39%65decade611). The reduction of surface RH is also captured by the NCEP/NCAR reanalysis at the surface, 400, 500, and 60065hPa. A particularly sharp reduction of RH since the mid-1990s is evident in both data sets, in line with rapid warming over the plateau. This suggests that moisture supply to the plateau from the Arabian Sea and the Bay of Bengal is limited and that variability and trends of surface RH over the TP are not uniquely driven by the Clausius-Clapeyron relationship.
[47]
GettelmanA, Walden VP, Miloshevich LM, et al.
Relative humidity over Antarctica from radiosondes, satellites, and a general circulation model
[J]. Journal of Geophysical Research, 2006, 111(D9): 1 435-1 453.
[1] Radiosonde measurements are used to validate measurements of relative humidity (RH) over Antarctica from the Atmospheric Infrared Sounder (AIRS) satellite instrument. Radiosonde observations are corrected for most known biases but still have a solar heating dry bias of up to 8% relative to other instruments. AIRS reproduces the observations of temperature and relative humidity with good fidelity. There is a 20% moist bias to the data in the upper troposphere relative to radiosonde measurements, but it is within the standard deviation of the measurements. Probability distribution functions of RH from radiosondes and AIRS are similar, suggesting that variability over Antarctica is well reproduced by the satellite. AIRS data are also compared to simulations from the Community Atmosphere Model version 3 (CAM3) and are found to be significantly moister than the model, although the model does not allow supersaturation with respect to ice or liquid water. A climatology from AIRS indicates that it has a repeatable annual cycle over Antarctica. Supersaturation with respect to ice is very common over the continent, particularly in winter, where it might occur almost half the time in the troposphere. This may affect the quantity and isotopic composition of ice over Antarctica.
Analysis of instrumental temperature records beginning in 1659 shows that in much of the world the dominant frequency of the seasons is one cycle per anomalistic year (the time from perihelion to perihelion, 365.25964 days), not one cycle per tropical year (the time from equinox to equinox, 365.24220 days), and that the timing of the annual temperature cycle is controlled by perihelion. The assumption that the seasons were timed by the equinoxes has caused many statistical analyses of climate data to be badly biased. Coherence between changes in the amplitude of the annual cycle and those in the average temperature show that between 1854 and 1922 there were small temperature variations, probably of solar origin. Since 1922, the phase of the Northern Hemisphere coherence between these quantities switched from 0 to 180 and implies that solar variability cannot be the sole cause of the increasing temperature over the last century. About 1940, the phase patterns of the previous 300 years began to change and now appear to be changing at an unprecedented rate. The average change in phase is now coherent with the logarithm of atmospheric CO$_2$ concentration.
[49]
Thomson DJ.
Dependence of global temperatures on atmospheric CO2 and solar irradiance
[J]. Proceedings of the National Academy of Sciences, 1997, 94(16): 8 370-8 377.
Changes in global average temperatures and of the seasonal cycle are strongly coupled to the concentration of atmospheric CO2. I estimate transfer functions from changes in atmospheric CO2and from changes in solar irradiance to hemispheric temperatures that have been corrected for the effects of precession. They show that changes from CO2over the last century are about three times larger than those from changes in solar irradiance. The increase in global average temperature during the last century is at least 20 times the SD of the residual temperature series left when the effects of CO2and changes in solar irradiance are subtracted.
[50]
Barbosa SM.
Changing seasonality in Europe’s air temperature
[J]. The European Physical Journal-Special Topics, 2009, 174(1): 81-89.
Climate change is expected to involve not only changes in the mean of climate parameters, but also in the characteristics of the corresponding seasonal cycle. However, the discrimination from an observational record of long-term changes in the mean and low-frequency variations in the seasonal pattern is a challenging task, requiring the application of specific statistical methods. In this work, a time series decomposition method based on autoregression is applied in order to obtain a flexible description of seasonal variability from European temperature records. The method is based on the dynamic linear model representation for an autoregressive process and is particularly useful for isolating time-varying cycles in climate time series, allowing to retrieve fluctuations in the amplitude and phase of the periodic components and to assess their statistical significance. This approach is utilised in the analysis of long time series of daily mean temperature from the ECA (European Climate Assessment) project. Seasonality in Europe’s air temperature is characterised by an annual cycle with a stable phase but considerable inter-annual and inter-decadal variability. In particular, the annual amplitude was highest in the 1940’s and exhibits a distinct minimum around 1975, coincident with the climatic regime shift of the mid-1970’s.
[51]
Stine AR, HuybersP, Fung IY.
Changes in the phase of the annual cycle of surface temperature
Abstract The annual cycle in the Earth's surface temperature is extremely large-comparable in magnitude to the glacial-interglacial cycles over most of the planet. Trends in the phase and the amplitude of the annual cycle have been observed, but the causes and significance of these changes remain poorly understood-in part because we lack an understanding of the natural variability. Here we show that the phase of the annual cycle of surface temperature over extratropical land shifted towards earlier seasons by 1.7 days between 1954 and 2007; this change is highly anomalous with respect to earlier variations, which we interpret as being indicative of the natural range. Significant changes in the amplitude of the annual cycle are also observed between 1954 and 2007. These shifts in the annual cycles appear to be related, in part, to changes in the northern annular mode of climate variability, although the land phase shift is significantly larger than that predicted by trends in the northern annular mode alone. Few of the climate models presented by the Intergovernmental Panel on Climate Change reproduce the observed decrease in amplitude and none reproduce the shift towards earlier seasons.
[52]
QianC, FuC, WuZ.
Changes in the amplitude of the temperature annual cycle in China and their implication for climate change research
[J]. Journal of Climate, 2011, 24(20): 5 292-5 302.
ABSTRACT The annual cycle is the largest variability for many climate variables outside the tropics. Whether human activities have affected the annual cycle at the regional scale is unclear. In this study, long-term changes in the amplitude of surface air temperature annual cycle in the observations are compared with those simulated by the climate models participating in phase 5 of the Coupled Model Intercomparison Project (CMIP5). Different spatial domains ranging from hemispheric to subcontinental scales in mid- to high-latitude land areas for the period 1950–2005 are considered. Both the optimal fingerprinting and a nonoptimal detection and attribution technique are used. The results show that the space–time pattern of model-simulated responses to the combined effect of anthropogenic and natural forcings is consistent with the observed changes. In particular, models capture not only the decrease in the temperature seasonality in the northern high latitudes and East Asia, but also the increase in the Mediterranean region. A human influence on the weakening in the temperature seasonality in the Northern Hemisphere is detected, particularly in the high latitudes (50–70N) where the influence of the anthropogenic forcing can be separated from that of the natural forcing.
[54]
Eliseev AV, Mokhov II.
Amplitude-phase characteristics of the annual cycle of surface air temperature in the Northern Hemisphere
[J]. Advances in Atmospheric Sciences, 2003, 20(1): 1-16.
When forced with increasing greenhouse gases, global climate models project a delay in the phase and a reduction in the amplitude of the seasonal cycle of surface temperature, expressed as later minimum and maximum annual temperatures and greater warming in winter than in summer. Most of the global mean changes come from the high latitudes, especially over the ocean. All 24 Coupled Model Intercomparison Project phase 3 models agree on these changes and, over the twenty-first century, average a phase delay of 5 days and an amplitude decrease of 5% for the global mean ocean surface temperature. Evidence is provided that the changes are mainly driven by sea ice loss: as sea ice melts during the twenty-first century, the previously unexposed open ocean increases the effective heat capacity of the surface layer, slowing and damping the temperature response. From the tropics to the midlatitudes, changes in phase and amplitude are smaller and less spatially uniform than near the poles but are still prevalent in the models. These regions experience a small phase delay but an amplitude increase of the surface temperature cycle, a combination that is inconsistent with changes to the effective heat capacity of the system. The authors propose that changes in this region are controlled by changes in surface heat fluxes.
[56]
Mann ME, ParkJ.
Greenhouse warming and changes in the seasonal cycle of temperature: Model versus observations
[J]. Geophysical Research Letters, 1996, 23(10): 1 111-1 114.
Thomson [1995] argues that an enhanced green-house effect may be altering the seasonal cycle in temperature. We compare trends in the amplitude and phase of the seasonal cycle in observational temperature data in the northern hemisphere with the response of two general circulation models to increased COconcentrations. Sizeable amplitude decreases are observed in both models and observations. Significant phase delays (ie, later seasonal transitions) are found in the simulations, opposite to the phase advances isolated in the observations. The retreat of winter sea ice in high-latitude regions appears to explain the models' response to COincrease. Much of the variability in the observational data is not predicted by the models.
[57]
TesouroM, GimenoL, NietoR, et al.
Interannual variability of the annual cycle of temperature over Northern Africa
[J]. Studia Geophysica et Geodaetica, 2005, 49(1): 141-151.
In this study, the imprints of two major atmospheric variability modes - ENSO and NAO - on the annual cycle of temperature over Northern Africa, a region sensitive to both modes, are investigated. Results from adjusting the annual cycle from daily data on a high resolution grid, indicate that both NAO and ENSO are able to influence significantly the amplitude and phase of the seasonal cycle and, consequently, that interannual trends found in amplitude and phase can be not exclusively due to greenhouse gases effects.
It's cold in winter and hot in summer. But the latest analysis illustrates the need to put observational data at the forefront of attempts to achieve a more detailed understanding of the annual temperature cycle.
[59]
Stine AR, HuybersP.
Changes in the seasonal cycle of temperature and atmospheric circulation
[J]. Journal of Climate, 2012, 25(21): 7 362-7 380.
ABSTRACT The vast majority of variability in the instrumental surface temperature record is at annual frequencies. Systematic changes in the yearly Fourier component of surface temperature have been observed since the midtwentieth century, including a shift toward earlier seasonal transitions over land. Here it is shown that the variability in the amplitude and phase of the annual cycle of surface temperature in the northern extratropics is related to Northern Hemisphere atmospheric circulation as represented by the northern annular mode (NAM) and the Pacific orth America mode (PNA). The phase of the seasonal cycle is most strongly influenced by changes in spring atmospheric circulation, whereas amplitude is most strongly influenced by winter circulation. A statistical model is developed based on the NAM and PNA values in these seasons and it successfully predicts the interdecadal trends in the seasonal cycle using parameters diagnosed only at in-terannual time scales. In particular, 70% of the observed amplitude trends and 68% of the observed phase trends are predicted over land, and the residual trends are consistent with internal variability. The strong relationship between atmospheric circulation and the structure of the seasonal cycle indicates that physical explanations for changes in atmospheric circulation also extend to explaining changes in the structure of the seasonal cycle.
[60]
McKinnon KA, Stine AR, HuybersP.
The spatial structure of the annual cycle in surface temperature: Amplitude, phase, and Lagrangian history
[J]. Journal of Climate, 2013, 26(20): 7 852-7 862.
Climatic changes in the onset of spring in northern China associated with changes in the annual cycle and with a recent warming trend were quantified using a recently developed adaptive data analysis tool, the Ensemble Empirical Mode Decomposition. The study was based on a homogenized daily surface air temperature (SAT) dataset for the period 1955–2003. The annual cycle here is referred to as a refined modulated annual cycle (MAC). The results show that spring at Beijing has arrived significantly earlier by about 2.98 d (10 yr) 611 , of which about 1.85 d (10 yr) 611 is due to changes in the annual cycle and 1.13 d (10 yr) 611 due to the long-term warming trend. Variations in the MAC component explain about 92.5% of the total variance in the Beijing daily SAT series and could cause as much as a 20-day shift in the onset of spring from one year to another. The onset of spring has been advancing all over northern China, but more significant in the east than in the west part of the region. These differences are somehow unexplainable by the zonal pattern of the warming trend over the whole region, but can be explained by opposite changes in the spring phase of the MAC, i.e. advancing in the east while delaying in the west. In the east of northern China, the change in the spring phase of MAC explains 40%–60% of the spring onset trend and is attributable to a weakening Asian winter monsoon. The average sea level pressure in Siberia (55°–80°N, 50°–110°E), an index of the strength of the winter monsoon, could serve as a potential short-term predictor for the onset of spring in the east of northern China.
[63]
WuZ, Schneider EK, Kirtman BP, et al.
The modulated annual cycle: An alternative reference frame for climate anomalies
In climate science, an anomaly is the deviation of a quantity from its annual cycle. There are many ways to define annual cycle. Traditionally, this annual cycle is taken to be an exact repeat of itself year after year. This stationary annual cycle may not reflect well the intrinsic nonlinearity of the climate system, especially under external forcing. In this paper, we re-examine the reference frame for anomalies by re-examining the annual cycle. We propose an alternative reference frame for climate anomalies, the modulated annual cycle (MAC) that allows the annual cycle to change from year to year, for defining anomalies. In order for this alternative reference frame to be useful, we need to be able to define the instantaneous annual cycle: we therefore also introduce a new method to extract the MAC from climatic data. In the presence of a MAC, modulated in both amplitude and frequency, we can then define an alternative version of an anomaly, this time with respect to the instantaneous MAC rather than a permanent and unchanging AC. Based on this alternative definition of anomalies, we re-examine some familiar physical processes: in particular SST re-emergence and ENSO phase locking to the annual cycle. We find that the re-emergence mechanism may be alternatively interpreted as an explanation of the change of the annual cycle instead of an explanation of the interannual to interdecadal persistence of SST anomalies. We also find that the ENSO phase locking can largely be attributed to the residual annual cycle (the difference of the MAC and the corresponding traditional annual cycle) contained in the traditional anomaly, and, therefore, can be alternatively interpreted as a part of the annual cycle phase locked to the annual cycle itself. In addition to the examples of reinterpretation of physics of well known climate phenomena, we also present an example of the implications of using a MAC against which to define anomalies. We show that using MAC as a reference framework for anomaly can bypass the difficulty brought by concepts such as ecadal variability of summer (or winter) climate for understanding the low-frequency variability of the climate system. The concept of an amplitude and frequency modulated annual cycle, a method to extract it, and its implications for the interpretation of physical processes, all may contribute potentially to a more consistent and fruitful way of examining past and future climate variability and change.
[64]
QianC, WuZ, FuC, et al.
On multi-timescale variability of temperature in China in modulated annual cycle reference frame
[J]. Advances in Atmospheric Sciences, 2010, 27(5): 1 169-1 182.
Six long records of European mean monthly temperature have been analysed for changes in continentality of climate using the time series technique of complex demodulation. Variations in amplitude and phase of the annual temperature cycle as estimated by the complex demodulation, in combination with low-pass filtering, are found to be coherent across much of Europe, from distinctly maritime to distinctly continental locations. The most significant departure of continentality found during the last 460 years is the maritime period of the 1920s when cool summers accompanied mild winters along with a retardation of the seasons throughout Europe.
[68]
VecchioA, CarboneV.
Amplitude-frequency fluctuations of the seasonal cycle, temperature anomalies, and long-range persistence of climate records
Abstract The naming game (NG) describes the agreement dynamics of a population of agents that interact locally in a pairwise fashion, and in recent years statistical physics tools and techniques have greatly contributed to shed light on its rich phenomenology. Here we investigate in details the role played by the way in which the two agents update their states after an interaction. We show that slightly modifying the NG rules in terms of which agent performs the update in given circumstances (i.e., after a success) can either alter dramatically the overall dynamics or leave it qualitatively unchanged. We understand analytically the first case by casting the model in the broader framework of a generalized NG. As for the second case, on the other hand, we note that the modified rule reproducing the main features of the usual NG corresponds in fact to a simplification of it consisting in the elimination of feedback between the agents. This allows us to introduce and study a very natural broadcasting scheme on networks that can be potentially relevant for different applications, such as the design and implementation of autonomous sensor networks, as pointed out in the recent literature.
[70]
GrieserJ, TrömelS, Schönwiese CD.
Statistical time series decomposition into significant components and application to European temperature
[J]. Theoretical and Applied Climatology, 2002, 71(3): 171-183.
are the complex Fourier coefficients). Also discussed are raw and modified Fourier periodograms, bandwidth versus stability aspects, and aims and computational approaches to complex demodulation. Appendixes include a glossary, a review of complex demodulation without fast Fourier transform, and a short explanation of the fast Fourier transform.
[76]
Huang NE, ShenZ, Long SR, et al.
The empirical mode decomposition and the Hilbert spectrum for nonlinear and non-stationary time series analysis
[C]//Proceedings of the Royal Society of London A: Mathematical, Physical and Engineering Sciences. The Royal Society, 1998, 454(1 971): 903-995.
We survey the newly developed Hilbert spectral analysis method and its applications to Stokes waves, nonlinear wave evolution processes, the spectral form of the random wave field, and turbulence. Our emphasis is on the inadequacy of presently available methods in nonlinear and nonstationary data analysis. Hilbert spectral analysis is here proposed as an alternative. This new method provides not only a more precise definition of particular events in time-frequency space than wavelet analysis, but also more physically meaningful interpretations of the underlying dynamic processes.
[78]
WuZ, Huang NE.
Statistical significance test of intrinsic mode functions
[M]//Huang N E, Shen S S P, eds. Hilbert-Huang Transform and Its Applications Edited. Singapore: World Scientific, 2005: 149-169.
The signals emanating from complex systems are usually composed of a mixture of different oscillations which, for a reliable analysis, should be separated from each other and from the inevitable background of noise. Here we introduce an adaptive decomposition tool—nonlinear mode decomposition (NMD)—which decomposesa given signal into a set of physically meaningful oscillations for any wave form, simultaneously removing the noise. NMD is based on the powerful combination of time-frequency analysis techniques—which, together with the adaptive choice of their parameters, make it extremely noise robust—and surrogate data tests used to identify interdependent oscillations and to distinguish deterministic from random activity. We illustrate the application of NMD to both simulated and real signals and demonstrate its qualitative and quantitative superiority over otherapproaches, such as (ensemble) empirical mode decomposition, Karhunen-Loeve expansion, and independent component analysis. We point out that NMD is likely to be applicable and useful in many different areas of research, such as geophysics, finance, and the life sciences. The necessary MATLAB codes for running NMD arefreely available for download.
[81]
Cleveland RB, Cleveland WS, TerpenningI.
STL: A seasonal-trend decomposition procedure based on loess
[J]. Journal of Official Statistics, 1990, 6(1): 3.
ABSTRACT Abstract: STL is a filtering procedure for decomposing a time series into trend , seasonal , and remainder components. STL has a simple design that consists of a sequence of applications of the loess smoother; the simplicity allows analysis of the properties of the procedure and ...
[82]
Cleveland WS, Devlin SJ.
Locally weighted regression: An approach to regression analysis by local fitting
[J]. Journal of the American Statistical Association, 1988, 83(403): 596-610.
Locally weighted regression, or loess, is a way of estimating a regression surface through a multivariate smoothing procedure, fitting a function of the independent variables locally and in a moving fashion analogous to how a moving average is computed for a time series. With local fitting we can estimate a much wider class of regression surfaces than with the usual classes of parametric functions, such as polynomials. The goal of this article is to show, through applications, how loess can be used for three purposes: data exploration, diagnostic checking of parametric models, and providing a nonparametric regression surface. Along the way, the following methodology is introduced: (a) a multivariate smoothing procedure that is an extension of univariate locally weighted regression; (b) statistical procedures that are analogous to those used in the least-squares fitting of parametric functions; (c) several graphical methods that are useful tools for understanding loess estimates and checking the assumptions on which the estimation procedure is based; and (d) the M plot, an adaptation of Mallows''s Cp procedure, which provides a graphical portrayal of the trade-off between variance and bias, and which can be used to choose the amount of smoothing.
[83]
KrzyszczakJ, BaranowskiP, ZubikM, et al.
Temporal scale influence on multifractal properties of agro-meteorological time series
[J]. Agricultural and Forest Meteorology, 2017, 239: 223-235.
Abstract Abstract Scale issues become very important when applying weather time series. We address problems associated with transferring meteorological data across time scales by comparing multifractal properties of hourly and daily meteorological time series. The multifractal detrended fluctuation approach revealed that temporal aggregation of agro-meteorological time series can impact on their multifractal properties. The most apparent evidence of changing the time scale on multifractal properties was found for precipitation. It was the least noticeable for the wind speed time series. The change from hourly to daily time scale had an effect on the long-range correlations and the broadness of the probability density function. The contribution of these two components to series multifractality was smaller than before data aggregation. Our results confirm the loss of unique multifractal features at daily time scale as compared to hourly time series.
[84]
EladawyA, NadaokaK, NegmA, et al.
Characterization of the northern Red Sea’s oceanic features with remote sensing data and outputs from a global circulation model
Analysis of Atmospheric Infrared Sounder (AIRS) measurements for five northern winters shows significant longitudinal variations in subtropical upper tropospheric relative humidity (RH), not only in the climatological mean values but also in the local distributions and temporal variability. The largest climatological mean values in the northern subtropics occur over the eastern Pacific and Atlantic oceans, where there is also large day-to-day variability. In contrast, there are smaller mean values, and smaller variability that occurs at lower frequency, over the Indian and western Pacific oceans. These differences in the distribution and variability of subtropical RH are related to differences in the key transport processes in the different sectors. The large variability and intermittent high and low RH over the Eastern Pacific and Atlantic oceans, and to a smaller extent over the Indian ocean, are due to intrusions of high potential vorticity air into the subtropics. Intrusions seldom occur over the eastern Indian and western Pacific oceans, and here the subtropical RH is more closely linked to the location and strength of subtropical anticyclones. In this region there are eastward propagating features in the subtropical RH that are out of phase with the tropical RH, and are caused by modulation of the subtropical anticyclones by the Madden-Julian Oscillation.
[88]
VattayG, HarnosA.
Scaling behavior in daily air humidity fluctuations
We show that the daily average air humidity fluctuations exhibit nontrivial 1/ f behavior which is different from the spectral properties of other meteorological quantities. This feature and the fractal spatial structure found in clouds make is plausible to regard air humidity fluctuations as a manifestation of self-organized criticality. We give arguments why the dynamics in air humidity can be similar to those in sandpile models of self-organized criticality.
[89]
Garcia JM, Gimenez LM, Pacheco AF.
On fluctuations of the mean daily relative humidity and self-organized critical phenomena
[J]. Journal of Geophysical Research, 1997, 102(D8): 9 487-9 491.
We analyze the spectral density of the fluctuations in the relative humidity of Zaragoza, Spain in the period 19510900091993. A similar study has already been carried out by Vattay and Harnos [1994] using data from Hungary. These authors claim that this spectrum shows a l/0408 behavior. Our results indicate a different trend, which seems to show that relative humidity at ground level is not a self-organized critical phenomenon.
[90]
ChenX, Lin GX, Fu ZT.
Long-range correlations in daily relative humidity fluctuations: A new index to characterize the climate regions over China
[J]. Geophysical Research Letters, 2007, 34(7): L07804.DOI:10.1029/2006GL027755.
Long-range correlations of daily relative humidity anomaly records from 191 weather stations over China during 1951鈥2000 are analyzed by means of fluctuation analysis (FA) and detrended fluctuation analysis (DFA). The information about trends in the relative humidity records can be obtained by comparing the FA curve with DFA curves. The daily relative humidity fluctuations are found to be power-law correlated and their average scaling exponent is higher than that of the temperature fluctuations, indicating that the relative humidity fluctuations take different statistical behavior from other meteorological quantities and there exists a stronger persistence in the relative humidity fluctuations. Furthermore, it is also found that these power-law scaling properties vary from station to station and show both spatial and temporal diversities, which may be explained by a proposed mechanism.
Observations: Surface and atmospheric climate change
Low-frequency variations in surface atmospheric humidity, temperature, and precipitation: Inferences from reanalyses and monthly gridded observational data sets

 , 邓琪敏, 付遵涛
