Application of Partial Least Squares Regression in Multimodal Integrated Forecasting of Water Vapor and Surface Air Temperature
Li Jiangfeng, Cai Xiaojun*, , Wang Wen, Li Qianwen, Lei Yansen
Key Laboratory of Meteorological Disaster, Ministry of Education, Nanjing University of Information Science and Technology/Joint Laboratory of International Cooperation on Climate and Environment Change/Center for Innovation and Coordination of Meteorological Disaster Prediction and Early Warning and Assessment, Nanjing 210044, China
First author:Li Jiangfeng(1993-),male,Tongshan County,Hubei Province,Master student. Research areas include multi-mode integration research.E-mail:18751978762@163.com
The use of a new multi model integration method of Partial Least Squares regression (PLS) can completely eliminate the multicollinearity features to improve multi model’s integrated forecasting results of the humidity and temperature. Based on the four centers’ ensemble forecast results, namely, the European Center for Medium-Range Weather Forecasts (ECMWF), Chinese Meteorological Administration (CMA), the Japan Meteorological Agency (JMA) and the UK Met Office (UKMO), we built a 2012 multi mode (25°~60°N, 60°~150°E) 24 ~168 hours forecast time (interval 24 hours) multi model for humidity and temperature and used the four methods, like ensemble average (BREM) for eliminating the deviation, a simple set of average (EMN), Super Ensemble (SUP) and Partial Least Squares regression (PLS) for ground temperature multi model integration. We used the Root-Mean-Square Error (RMSE) and anomaly correlation coefficient (cor) to determine the effect of more modes of integration and to predict a short course of cold. The two prediction results showed that the Partial Least Squares regression (PLS) was the best multi model integrated method, more superior than the other three single modes and compared with the other three methods, it showed better prediction performance, which has certain value and application prospect.
Keywords:Partial Least Squares regression (PLS)
;
Multi model ensemble forecast
;
Surface air temperature
;
Humidity.
LiJiangfeng, CaiXiaojun, WangWen, LiQianwen, LeiYansen. Application of Partial Least Squares Regression in Multimodal Integrated Forecasting of Water Vapor and Surface Air Temperature[J]. Advances in Earth Science, 2018, 33(4): 404-415 https://doi.org/10.11867/j.issn.1001-8166.2018.04.0404
早在20世纪70年代,Thompson[5]就发现了将2个相互独立的预测结果进行统计后处理,其预测的均方根误差可以明显小于单个预测结果的预报误差。Krishnamurti等[6]因此提出了超级集合预报方法,即将多个模式的预报结果通过适当的线性组合在一起,形成最终的预报结果,来降低系统误差对预报结果的影响。20世纪初,杨学胜[7]提出多模式集合预报是一种能够提高模式预测水平的统计后处理方法,从此,多模式集成预报广泛被应用。2003年,Vijaya Kumar等[8]使用超级集合预报方法对飓风的强度和路径进行超级集合预报检验,发现超级集合预报在对飓风的强度和路径效果优于单个模式和多模式集合平均。2005年,Ross等[9]应用超级集合预报分析6个模式中的全球逐日资料,分别对500 hPa高度场、平均海平面气压、200 hPa风场以及850 hPa风场进行多模式集成,效果良好。2009年,Krishnamurti等[10]基于5个中心研究多模式集成降水预测,将预报时效从13天延伸到10天进行讨论,发现延伸的410天多模式集成预报效果仍然优于单一模式预报效果。包红军[11]对多模式动态权重集成定量降水预报产品进行ts评分,成功地预报了第一个暴雨过程,但第二个效果较差,因此需要改进权重或选取更加有效的集成方法。陈超辉等[12]进行的江淮汛期多模式短期集合预报研究表明多模式集合总体效果比任一单一模式的集合预报效果好,并且指出不同的模式对降水集合预报的响应不同,当降水临界值比较低时,单一模式对多模式集合效果影响较小,但当降水临界值较大时,影响较大。张亚洲等[13]提出不同降水临界值对集合预报影响不同,临界值较小时集合预报效果好,但临界值较大时,效果较差。唐圣钧等[14]提出了ARPS-WRF多模式集合相比传统集合预报明显提高了中雨、大雨、暴雨的准确度,对特大暴雨因概率覆盖范围较大导致空报较多而改进有限,但仍优于单一模式集合。魏凤英[15]发现在有限样本情况下,回归系数可以保证在最小方差意义下得到最优集成集合,因此,回归方法被广泛运用于多模式集成预报中。智协飞等[16]利用5个集合中心集合预报结果,讨论多模式集成预报方法,发现多模式集成预报效果明显优于单一中心的预报,且滑动平均方法较为优秀,但对于降水的多模式集成效果仍然欠缺。于水燕等[17]使用消除偏差集合平均和超级集合预报的方法,对中国东部水汽做了多模式集成预报研究,发现超级集合预报方法最优,消除偏差集合平均的方法与集合平均的方法效果差不多,但仍然优于任意单一模式。李倩等[18]使用BP人工神经网络的方法对温度进行多模式集成预报,使用 t213、欧洲中心以及t106 3种模式,发现多模式集成温度在我国华北东北地区预报效果最好,BP神经网络集成后明显优于任意一种模式。林春泽等[19]基于TIGGE资料,采用均方根误差评估欧洲中期天气预报中心(European Centre for Medium-Range Weather Forecasts,ECMWF)、日本气象厅(Japan Meteorological Agency,JMA)、美国国家环境预报中心(National Centers for Environmental Prediction,NCEP)和英国气象局(Met Office,UKMO)4个中心的集合预报资料温度场,比较超级集合预报(Multi-madel Superensemble,SUP)与单一模式、多模式简单集合平均(Ensemble Mean,EMN)、消除偏差集合平均(Bias-Removed Ensemble Mean,BREM)的预报效果,发现超级集合预报、多模式集合平均以及消除偏差集合平均都明显好于任意单个中心的预报。
多模式集成预报大量应用于各种气候要素预测,但对于某些要素仍不能取得较好的效果,智协飞等[16]发现对于24 h累计降水预报,超级集合预报效果不理想,甚至超过单一模式结果,但各种集成方法对于不同要素预报改进效果各有千秋,因此有待于选择。目前,偏最小二乘(Partial Least Squares regression,PLS)回归被大量应用于医学、化学和工业等其他产业,技术已经十分成熟,但利用偏最小二乘回归的方法来做多模式集成预报方面仍然处于摸索阶段,本文试图将偏最小二乘回归应用于多模式集成预报,对比湿和地面气温进行24168 h(间隔24 h)的多模式集成预报回报,与目前最常用的消除偏差集合平均(BREM)、简单集合平均(EMN)、超级集合预报(SUP)以及偏最小二乘回归(PLS)方法4种单一模式效果对比,以均方根误差(Root-Mean-Square Error,RMSE)以及距平相关系数(cor)来判定预报效果的优劣。
2 资料与方法
2.1 资料
(1)TIGGE(The International Grand Global Ensemble)资料:所用资料来自TIGGE资料集下的中国气象局(China Meteorological Administration,CMA)、JMA、UKMO和ECMWF 4个中心全球集合预报模式逐日12时(世界时)起报的2 m温度和850 hPa比湿资料,资料分辨率为1°×1°经纬网格,预报时效为24168 h(间隔24 h),预报区域为25°60°N,60°150°E。其中温度资料时间为与“观测值”相对应的预测时间。
(2)FNL(Final Operational Global Analysis)资料:选取2012年1月8日至2月29日和2012年12月131日逐日12时(世界时)2 m温度资料,区域为25°60°N,60°150°E,分辨率为1°×1°的经纬网格,作为“观测值”来检验预报效果。
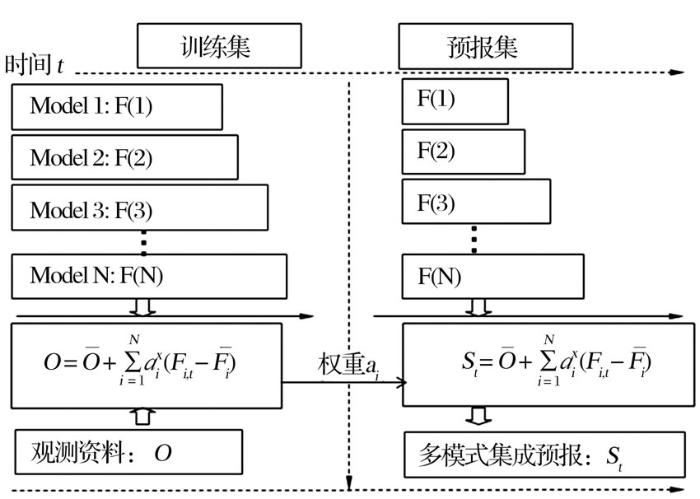
PLS是采用信息综合与筛选技术的新型多元回归建模方法,它能克服变量多重相关性在系统建模中的不良作用。在利用多个自变量X=(X1,X2,…,Xp)进行回归建模时,PLS将自变量系统中的信息重新组合,有效地提取对因变量Y解释性最强,又最能概括自变量系统X中信息的综合变量(即主成分)t0, t1, …, ti (i≤p)剔除多重相关信息和无解释意义信息的干扰,从而克服了自变量多重相关性在系统建模中的不良作用,得到一个更为可靠的分析结果。
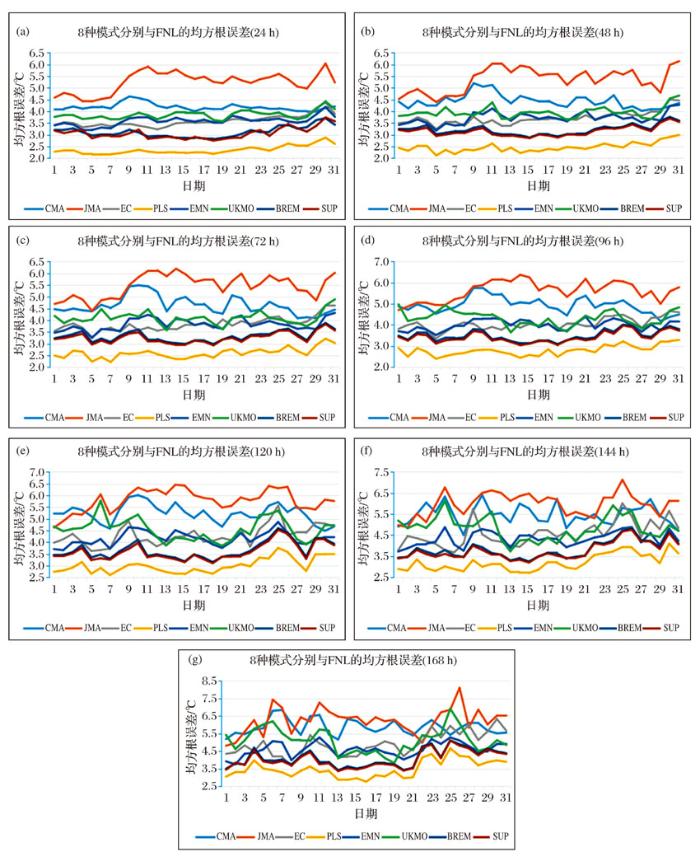
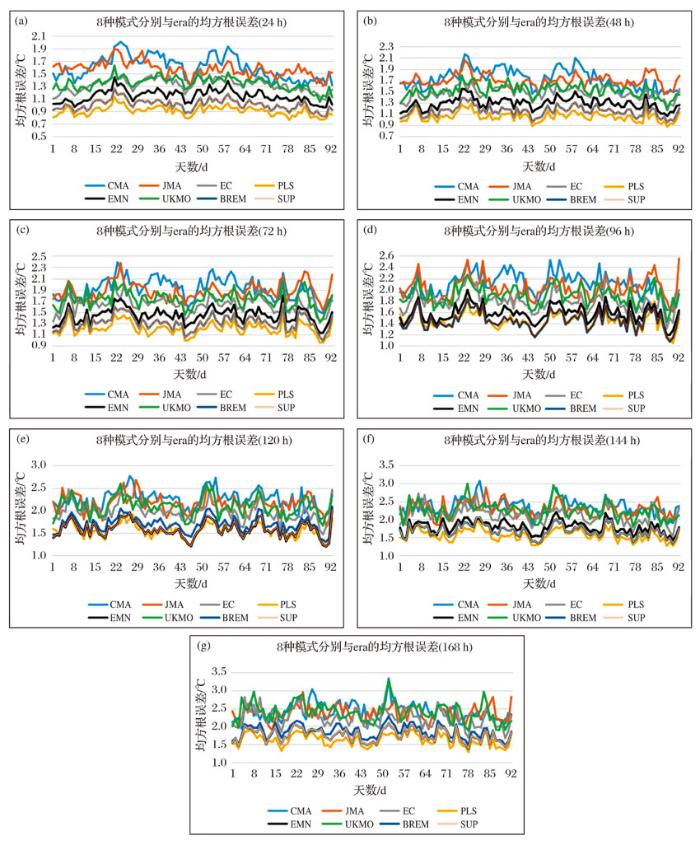
Fig.2 December 1,2012 to December 31,2012 daily 24 h(a),48 h(b),72 h(c),96 h(d),120 h(e),144 h(f),168 h(g) surface air temperature in 25°60°N,60°150°E area average Root-Mean-Square Error
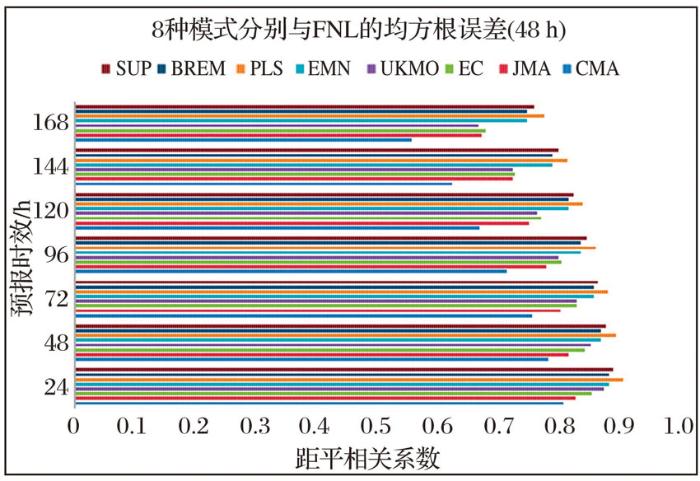
Fig.3 Daily average Anomaly correlation coefficient between FNL air temperature and eight modes air temperature from December 1, 2012 to December 31, 2012
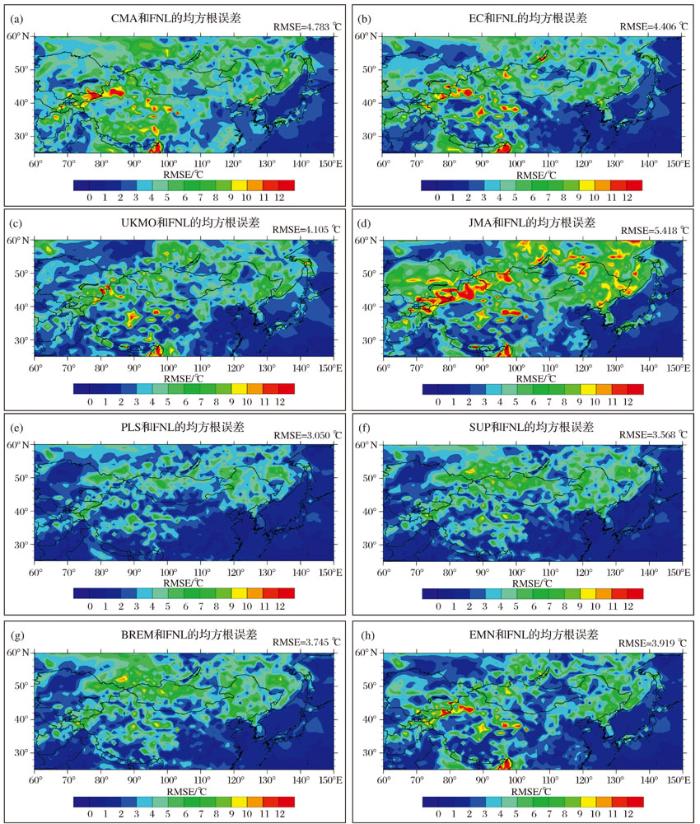
Fig.4 December 27, 2012 to December 29, 2012 cold-air outbreak surface air temperature “real ” and CMA(a), EC(b),UKMO(c),JMA(d),PLS(e),SUP(f),BREM(g),EMN(h)24168 h average Root-Mean-Square Error geographical distribution(unit:℃) In the upper right corner RMSE express the average Root-Mean-Square Error
Fig.5 June 1, 2012 to August 31, 2012 daily 24 h(a),48 h(b),72 h(c),96 h(d),120 h(e),144 h(f),168 h(g) specific humidity in 25°60°N,60°150°E area average Root-Mean-Square Error
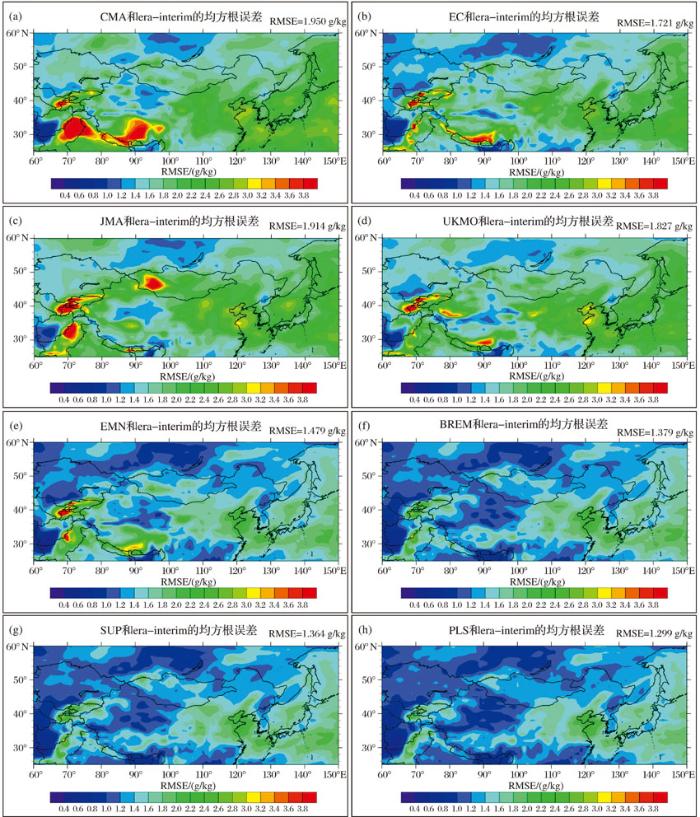
Fig.6 June 1, 2012 to August 31, 2012 specific humidity “real” and CMA(a),EC(b),JMA(c),UKMO(d),EMN(e), BREM(f),SUP(g),PLS(h) 24168 h average Root-Mean-Square Error geographical distribution(unit:g/kg) In the upper right corner RMSE express the average Root-Mean-Square Error
A 28-variable model of the atmosphere is constructed by expanding the equations of a two-level geostrophic model in truncated double-Fourier series. The model includes the nonlinear interactions among disturbances of three different wave lengths. Nonperiodic time-dependent solutions are determined by numerical integration. By comparing separate solutions with slightly different initial conditions, the growth rate of small initial errors is studied. The time required for errors comparable to observational errors in the atmosphere to grow to intolerable errors is strongly dependent upon the current circulation pattern, and varies from a few days to a few weeks. Some statistical predictability of certain quantities seems to be present even after errors in the complete circulation pattern are no longer small. The feasibility of performing similar studies with much larger atmospheric models is considered. DOI: 10.1111/j.2153-3490.1965.tb01424.x
[2]
DuJun.
The status and prospect of ensemble forecast
[J]. Journal of Applied Meteorology,2002,13(1):16-28.
Abstract The theoretical skill of Monte Carlo approximations to the stochastic dynamic forecasting technique proposed by Epstein is examined by means of an extension of earlier atmospheric predictability studies that used the test-field model of two-dimensional turbulence. The fundamental statistical hydrodynamical concept of an ensemble of phase paths evolving in a dynamical phase space is reviewed and used to define the statistical properties of a finite Monte Carlo sample. The application of a linear regression step to arrive at a final best estimate of the state of the atmosphere is also discussed. The resulting forecasts approach the climatological mean at forecast times so late that all skill has been lost. For an ideal case with an observing resolution, hopefully achievable in the 1980s with satellite-based sensors, it is found that the. Monte Carlo procedure leads to the greatest improvement in mean-square vector wind forecast skill in the 6- to 10-day range. For another case corresponding roughly...
[5]
Thompson PD.
How to improve accuracy by combining independent forecasts
It is shown that the ensemble mean-square error of forecasts constructed from a particular linear combination of independent and imperfectly correlated predictions is less than that of any of the individual predictions. The weights to be attached to each prediction are determined by the Gaussian method of least squares and depend on the covariances between independent predictions and between prediction and verification. At the present stage of development of numerical prediction methods, it appears possible to reduce the error variance by about 20%, simply by the optimum combination of two independent predictions.
[6]
Krishnamurti TN, Kishtawal CM,
LaRow T E,et al. Improved weather and seasonal climate forecasts from multimodel SUPerensemble
Abstract A method for improving weather and climate forecast skill has been developed. It is called a superensemble, and it arose from a study of the statistical properties of a low-order spectral model. Multiple regression was used to determine coefficients from multimodel forecasts and observations. The coefficients were then used in the superensemble technique. The superensemble was shown to outperform all model forecasts for multiseasonal, medium-range weather and hurricane forecasts. In addition, the superensemble was shown to have higher skill than forecasts based solely on ensemble averaging.
[7]
YangXuesheng.
The present situation and prospect of service ensemble forecasting system
Using currently available operational forecast datasets on the tracks and intensities of tropical cyclones over the Pacific Ocean for the years 1998, 1999, and 2000 a multimodel superensemble has been constructed following the earlier work of the authors on the Atlantic hurricanes. The models included here include forecasts from the European Centre for Medium-Range Weather Forecasts (ECMWF), the National Centers for Environmental Prediction/Environmental Modeling Center [NCEP/EMC, the Aviation (AVN) and Medium-Range Forecast (MRF) Models], the U.S. Navy [Naval Operational Global Atmospheric Prediction System, (NOGAPS)], the U.K. Met Office (UKMO), and the Japan Meteorological Agency (JMA). The superensemble methodology includes a collective bias estimation from a training phase in which a multiple-regression-based least squares minimization principle for the model forecasts with respect to the observed measures is employed. This is quite different from a simple bias correction, whereby a mean value is simply shifted. These bias estimates are described by separate weights at every 12 h during the forecasts for each of the member models. Superensemble forecasts for track and intensity are then constructed up to 144 h into the future using these weights. Some 100 past forecasts of tropical cyclone days are used to define the training phase for each basin. The findings presented herein show a marked improvement for the tracks and intensities of forecasts from the proposed multimodel superensemble as compared to the forecasts from member models and the ensemble mean. This note includes detailed statistics on the Pacific Ocean tropical cyclone forecasts for the years 1998, 1999, and 2000.
[9]
Ross RS, Krishnamurti TN.
Reduction of forecast error for global numerical weather prediction by the Florida State University (FSU) superensemble
[J].Meteorology and Atmospheric Physics, 2005, 88(3): 215-235.
The skill of the FSU Superensemble technique as applied to global numerical weather prediction is evaluated extensively in this paper. The global mass and motion fields for year 2000 and precipitation over the domain 5565S to 5565N for year 2001, as predicted by the Superensemble, the ensemble member models, and the mean of the ensemble members, are evaluated by standard statistical measures of skill to determine the performance of the Superensemble in relation to the other models. The member models are global forecast models from 5 of the world’s operational forecast centers in addition to the FSU global spectral model. For precipitation 5 additional versions of the FSU global model are utilized in the ensemble, as defined by different initial conditions provided by various physical initialization algorithms. Statistical parameters calculated for the mass and motion fields include root mean square (RMS) error, systematic error (or bias), and anomaly correlation. These are applied to the mean sea level pressure, 50065hPa heights, and the wind fields at 85065hPa and 20065hPa. Statistical parameters that were calculated for precipitation include RMS error, correlation, equitable threat score (ETS), and a special definition of bias appropriate for the precipitation field. For the mass and motion fields the performance of the Superensemble was considered for the annual global case, as well as for each hemisphere (north and south) and for each of the four seasons. For precipitation only the annual case was considered over the domain cited above.For the mass and motion fields the RMS calculations showed the Superensemble to be superior (to have the smallest total forecast error) in all comparisons to the ensemble member models, and to be superior to the ensemble mean in the vast majority of comparisons. Performance in comparison to the other models was generally better in the Southern Hemisphere than in the Northern Hemisphere, and better in the transition seasons of fall and spring than in the extreme seasons of winter and summer. The Superensemble had the best success with mean sea level pressure, followed in order by 50065hPa geopotential heights, 85065hPa winds, and 20065hPa winds.In the calculations of 50065hPa geopotential height anomaly correlation the Superensemble had higher scores in all comparisons to the ensemble member models, as well as higher scores in the majority of comparisons to the ensemble mean. As with the RMS error results, the Superensemble performed better in the Southern Hemisphere than in the Northern Hemisphere, and better in fall than in summer, in comparison to the other models. The superior anomaly correlation scores of the Superensemble attest to the ability of the model to forecast daily perturbations from the climatological means, perturbations that are associated with transient synoptic scale features, given the horizontal resolution in the forecast models.In terms of systematic error reduction the Superensemble produces its most impressive results. Annual global mean sea-level pressure systematic errors for day 5 forecasts are generally in the range of ±165hPa (compared to errors as high as 865hPa in other models), and day 2 forecasts of 50065hPa geopotential height produced systematic errors generally in the range of ±10 meters (compared to errors as high as 60 meters in other models). The Superensemble was able to reduce systematic errors in forecasts of a variety of important features in the global mass and motion fields: surface equatorial trough, wave amplitude in geopotential heights at 50065hPa, trade winds and Somali Jet at 85065hPa, mid-latitude westerlies, subtropical jet, and Tropical Easterly Jet (TEJ) at 20065hPa.In terms of forecasting precipitation the Superensemble outperforms all ensemble member models and the ensemble mean in terms of RMS error, correlation coefficient, equitable threat score, and bias. The superior correlation scores indicate that the Superensemble is more reliable than the other models in predicting perturbations in the area distribution of precipitation, perturbations that are essentially associated with migrant synoptic scale disturbances, considering the horizontal resolution of the forecast models.The Superensemble is a valuable tool for significantly improving upon the global model forecasts of the world’s operational forecast centers. These forecasts are used daily as important guidance in making weather forecasts in all regions of the world. This paper will demonstrate that the Superensemble improves upon the ensemble member model forecasts: (1) in a statistical sense considering broad areas of the globe, (2) in a synoptic climatology sense through focus on the improved forecasts of climatological features seen in the global mass and motion fields, (3) in a synoptic sense through use of anomaly correlation and correlation coefficient where improvement is demonstrated in the forecasts of perturbations from mean fields which are essentially associated with transient synoptic scale disturbances.
In this paper we present the current capabilities for numerical weather prediction of precipitation over China using a suite of ten multimodels and our superensemble based forecasts. Our suite of models includes the operational suite selected by NCARs TIGGE archives for the THORPEX Program. These are: ECMWF, UKMO, JMA, NCEP, CMA, CMC, BOM, MF, KMA and the CPTEC models. The superensemble strategy includes a training and a forecasts phase, for these the periods chosen for this study include the months February through September for the years 2007 and 2008. This paper addresses precipitation forecasts for the medium range i.e. Days 1 to 3 and extending out to Day 10 of forecasts using this suite of global models. For training and forecasts validations we have made use of an advanced TRMM satellite based rainfall product. We make use of standard metrics for forecast validations that include the RMS errors, spatial correlations and the equitable threat scores. The results of skill forecasts of precipitation clearly demonstrate that it is possible to obtain higher skills for precipitation forecasts for Days 1 through 3 of forecasts from the use of the multimodel superensemble as compared to the best model of this suite. Between Days 4 to 10 it is possible to have very high skills from the multimodel superensemble for the RMS error of precipitation. Those skills are shown for a global belt and especially over China. Phenomenologically this product was also found very useful for precipitation forecasts for the Onset of the South China Sea monsoon, the life cycle of the mei-yu rains and post typhoon landfall heavy rains and flood events. The higher skills of the multimodel superensemble make it a very useful product for such real time events.
[11]
BaoHongjun.
Inspection and application of multi-model integrated quantitative precipitation forecast in a storm flood forecast
[C]∥S12 Meteorological, Geo-hazard Meteorological Forecasting and Services. Chinese Meteorological Society, 2012.

 , 蔡晓军
, 蔡晓军
