
陈亮 , 段建平, 马柱国
中国科学院大气物理研究所,中国科学院东亚区域气候—环境重点实验室, 北京 100029
Chen Liang, Duan Jianping, Ma Zhuguo
中图分类号: P426.6;P434
文献标识码: A
文章编号: 1001-8166(2018)04-0396-08
通讯作者:
收稿日期: 2017-12-1
修回日期: 2018-03-1
网络出版日期: 2018-04-20
版权声明: 2018 地球科学进展 编辑部
基金资助:
作者简介:
First author:Chen Liang(1982-),male, Pingxiang City, Jiangxi Province, Associate professor. Research areas include regional climate simulation and land-atmosphere interactions.E-mail:chenliang@tea.ac.cn
作者简介:陈亮(1982-),江西萍乡人,副研究员,主要从事区域气候模拟及陆气相互作用研究.E-mail:chenliang@tea.ac.cn
展开
摘要
大气环流异常是造成天气和气候变化的直接原因。以往对大气环流形势和中国降水关系的研究绝大部分是在对大气环流形势进行主观分型和进一步诊断的基础上来研究两者的联系。相对于对大气环流形势的主观分析,客观分型方法采用的指标更一致、标准更统一,能够得到较多的大气环流类型,目前得到了较为广泛的应用。利用欧洲中期数值天气预报中心提供的1979—2016年的再分析资料(ERA-Interim),通过选择逐日12UTC的海平面气压、可降水量和700 hPa风速3个变量, 应用倾斜旋转T模态主成分分析方法对中国区域内的大气环流进行了客观分型,并进一步分析了不同大气环流类型与中国区域降水之间的联系。结果表明,不同大气环流类型对中国区域降水趋势和降水量的影响不仅在空间上存在差异,而且在季节上也不尽相同。总体表现为大气环流类型对降水量大的区域和降水量多的月份影响较大,而对降水量小的区域和降水少的月份的影响较小。此外,与环流类型发生频次对中国降水的影响相比,大气环流类型发生频次不变的背景下降水强度变化对中国降水趋势的影响更加显著。
关键词:
Abstract
Atmospheric circulation anomaly is a direct cause of weather and climate change. In the past, most researches for the relationship between Weather Type (WT) and precipitation have mainly focused on the subjective classification and diagnosis. Compared to the subjective analysis, objective classification uses more consistent index and standard unification, thus, we can get more WTs, and it has been widely used in many areas. By using daily 12UTC Sea Level Pressure (SLP), Precipitable Water (PW), and 700 hPa wind speed (UV700) data from ECMWF’s Interim Reanalysis, the classification of WTs over China was performed with the method of obliquely rotated T-mode principle component analysis. WT and its link to precipitation over China were further analyzed. The results show that the influence of different WTs on precipitation is not uniform over China, and also show distinctly difference in different seasons. A common feature is that WTs great impact on the regions and months with large precipitation, while less impact on regions and months have with less precipitation. In addition, precipitation trends originating from WT intensity changes are much more deterministic, significant, and predictable than trends from WT frequency changes.
Keywords:
气候变化与大气环流形势有着密切的关系,大气环流异常是造成天气气候变化的直接原因。因此,研究大气环流形势的异常特征是理解和解释气候变化的一个重要手段[1]。就中国而言,降水在空间上的变化要远比气温复杂,这与影响中国降水的大气环流形势的类型有关[2]。前人的研究工作表明,中国夏季降水在20世纪70年代中后期发生了明显的年代际变化,主要表现为自20世纪70年代中后期长江流域的夏季降水明显增加,而华北地区和黄河流域的夏季降水明显减少[3]。Kwon等[4]的研究结果指出,在20世纪90年代中期,东亚夏季风发生了一次明显的年代际转折,导致中国南方地区夏季降水明显增加。也有研究表明,自21世纪以来,我国东北、华北以及西北东部地区的降水明显减少,而淮河流域降水明显增多[5]。大量研究表明,上述年代际降水的变化主要由大气环流形势的变化引起[6,7,8]。陆日宇[6]通过对大气环流形势进行诊断分析发现,华北地区降水在20世纪70年代末的明显减少与大气环流场变化的异常是密切相关的。黄荣辉等[7]指出,中国东部夏季降水主模态的年代际异常与水汽输送的年代际异常之间存在密切联系。Gong等[8]的研究认为,长江中下游夏季降水在1979年以后的转折与西太平洋副高强度的变化是有关联的。然而,上述研究对大气环流形势的分析和诊断都是基于主观分型或者通过建立一些指数来定量描述。相对于对大气环流形势的主观分析,客观分型方法采用的指标更一致、标准更统一,能够得到较多的大气环流类型,目前的应用也较为广泛[9,10]。
客观分型方法在天气和气候研究的应用中已有较长的历史,但应用最广泛的就是基于倾斜旋转T模态主成分分析对大气环流的分型[11]。这种方法是基于海平面气压场、位势高度场或其他可以描述大气环流的变量场进行分型,可将大气环流形势定量地划分为具体的环流型,进而可以更加具体地研究不同环流背景下的气候特征。应用此方法对不同环流类型与区域降水变化间关系的研究,不仅可以揭示降水变化的成因,同时也可为进行不同时间尺度的气候预测提供参考依据[9,10]。本文拟采用客观分型方法,在对大气环流形势进行客观分型的集成上,进一步揭示不同类型大气环流形势与我国降水变化间的潜在联系。
本文利用的观测降水数据为中国地面降水月值0.5°×0.5°格点数据集(V2.0),选用的时段为1979—2006年。该数据集是基于国家气象信息中心基础资料专项最新整编的中国地面2 472个台站降水资料,利用ANUSPLIN软件的薄盘样条法进行空间插值而生成。
对大气环流进行分型采用的方法[12]为提出的倾斜旋转T模态主成分分析方法。由于该方法能够得到包含主观分型结果的天气型,且其结果在时间和空间上也更加稳定,因此也较好地避免了其他方法中常出现的“雪球”效应,即大多数天分给一种类型,而其他类型的天数都比较少[13,14]。倾斜T模态主成分分析方法可以通过cost733-1.2分型软件来实现[9], Philipp等[15]详细描述了软件的相关信息。本文利用倾斜T模态主成分分析方法进行大气环流分型的目的是找出影响中国区域降水的主导环流类型。进行大气环流分型的区域为整个中国区域,具体边界范围为19.5°~50.25°N,79.5°~130.5°E。选择的变量为逐日12UTC的海平面气压,可降水量和700 hPa风速,数据来源于欧洲中期数值天气预报中心提供的再分析资料(ERA-Interim,1979—2016年)[16]。在进行倾斜T模态主成分分析之前,首先对海平面气压、可降水量和700 hPa风速数据进行了高通滤波,来消除天气系统的季节变化,且不影响输入变量空间分布。采用的滤波方法为31天滑动平均高斯滤波。
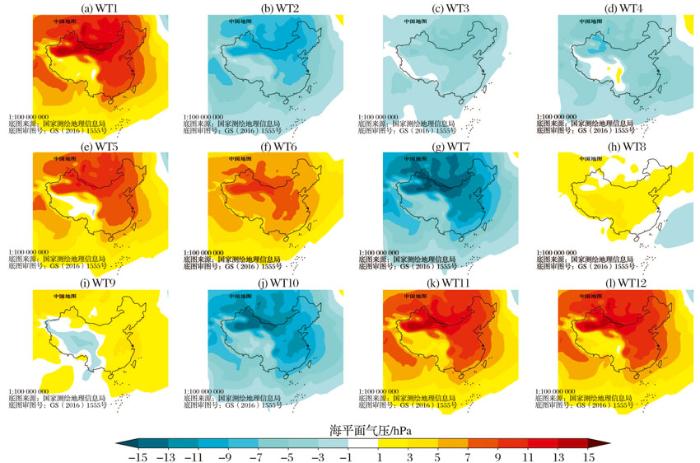
利用倾斜T模态主成分分析方法,把中国区的环流类型(Weather Type,WT)分为了12种(分别表示为WT01WT12,图1)。大气环流分型后显示出明显不同的海平面气压分布特征。环流类型有显著的季节变化特征,冬季主要集中在WT1,WT11和WT12 3种类型(图1a,k,l),过度季节包括WT2,WT3,WT5,WT6,WT8和WT9 6种类型(图1b,c,e,f,h,i),夏季包括WT4,WT7和WT10 3种类型(图1d,g,j)。
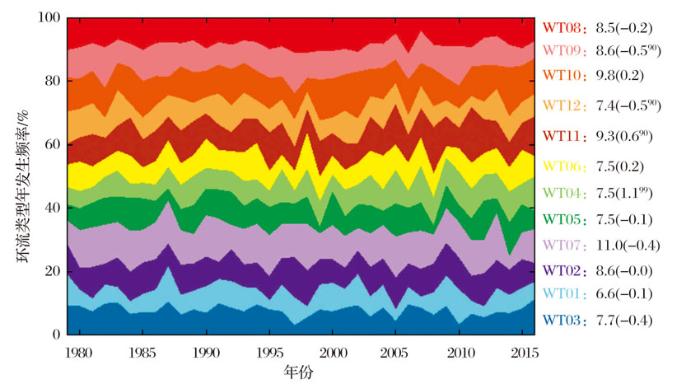
基于分出的12种环流类型,进一步计算了1979—2016年中国区域每次降水对应的环流类型在每一年发生的总频次及其在12种环流类型中所占的百分比(图2)。
结果显示,每种环流类型所占的百分比为6.6%~11%, 环流类型WT01所占的百分数最低,环流类型WT07所占的百分数最高。12种环流类型中,有5种环流类型的年发生频次在1979—2016年呈增加趋势,另外7种环流类型的年发生频次呈减少趋势,但仅有4种环流类型的年发生频次变化趋势通过了显著性检验。其中,WT09和WT12的发生频次呈显著减小趋势,对应减小趋势均为-0.5%/10a,而WT11和WT04的发生频次呈显著增加趋势,对应增加趋势分别为0.6%/10a和1.1%/10a。
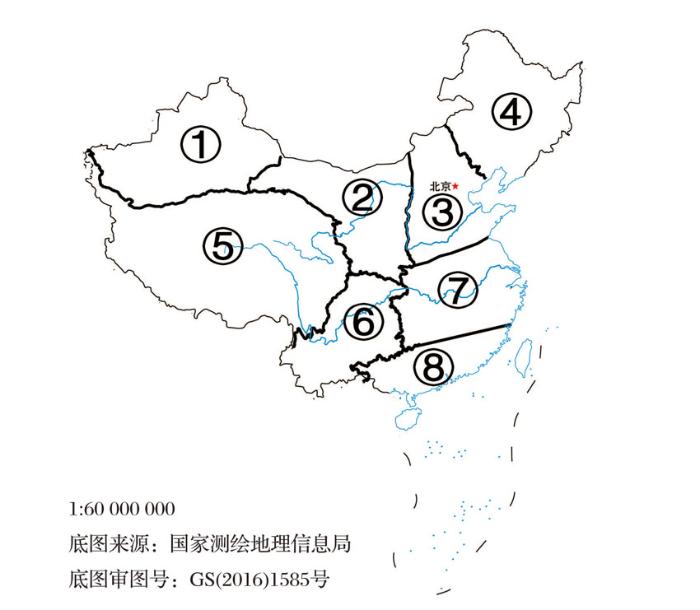
为了更好地揭示各种环流类型对全国及子区域降水的影响,我们把中国区域分为了8个子区(图3)。子区域划分的依据既考虑了中国降水量从西北到东南逐渐增加的变化特征,又考虑了我国的地形地貌特征和行政区域界线。以此划分的8个子区分别为:①西北西部地区;②西北东部地区;③华北地区;④东北地区;⑤青藏高原;⑥西南地区;⑦长江中下游;⑧华南地区(包括台湾和海南岛)。8个区域的年平均降水量分别为: 236,603,972,986,747,2 212,2 625和3 230 mm。
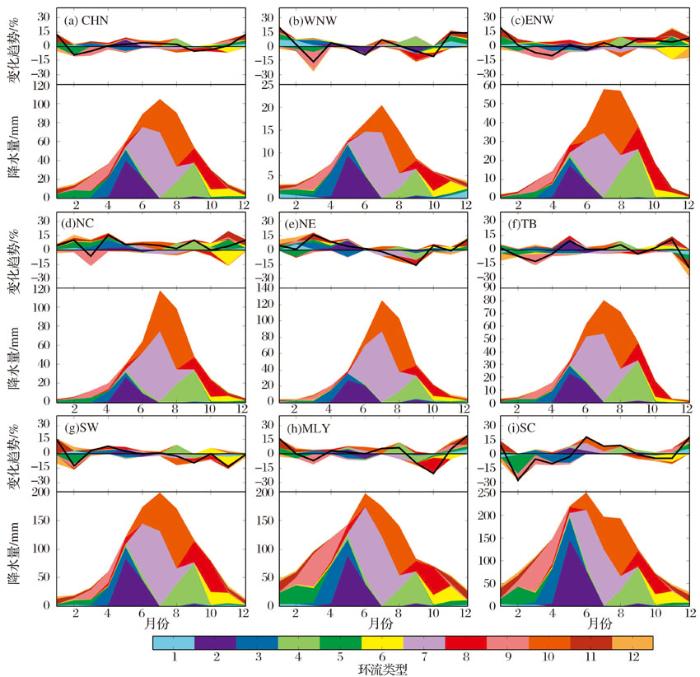
对于每一个区域,我们又进一步分析了各种环流类型对各月降水变化的影响(图4)。12种环流类型对各月降水量的总影响不论是在全国(图4a)还是在8个子区域(图4b~i)都是在夏季(6~8月)最大,冬季最小(12月至翌年2月)。但12种环流类型引发的降水量在区域间存在较大差异,就全国来看,12种环流类型引发的总降水量对5~9月各月引发的降水量都在60 mm以上,而对12月至翌年2月各月引发的降水量都在20 mm以下。环流类型引发的降水量在7月最大,1月最小,与我国降水量的季节分布相一致。表明利用此12种环流类型可解释我国降水量在各月的分布特征。在区域上,12种环流类型引发的降水在华南(SC, 图4i)最大,在新疆(图4b)最小。在8个区域引发的降水量变化与实际各区域降水量间的差异基本一致。
图1 基于倾斜T模态主成分分析方法划分的中国区域12种天气环流类型
(a)~(i)阴影为海平面气压在1979—2016年时段的异常
Fig.1 Twelve WTs which derived based on obliquely rotated T-mode principle component analysis
(a)(i) SLP anomalies are show in filled contours for the period from 1979 to 2016
图2 12种环流类型发生频次的变化特征
99和90分别表示通过了99%和90%的信度检验
Fig.2 The change characteristic of the occurrence of the twelve WTs for each year
90 and 99 means the trend passed 90% and 99% significant level relatively
图4 不同环流类型下中国及8个子区域降水变化的月趋势及年内变化
Fig.4 Annual cycle of area averaged precipitation and trend for whole China and eight sub-regions in different WTs
进一步对1979—2016年各环流类型引发的月降水变化的趋势进行了分析,结果显示12种环流类型对全国4~8月逐月降水的总影响在1979—2016年的变化趋势略有增加或保持不变,而对2~3月和9~10月的影响有减弱趋势,对1月和12月降水的影响有增强趋势。12种环流类型对全国8个子区域逐月降水的影响趋势与对全国的影响趋势基本接近,表现为对暖季的影响略有增加或保持不变,而对冷季的影响有相对较大幅度的变化(图4)。但有2个区域与全国形势的差异较大,分别是东北地区(图4e)和西南地区,12种环流类型对东北地区7~9月降水的影响有减小趋势,而对2~3月降水的影响有增加趋势,这与12种环流类型对全国及其他子区域的影响相反。12种环流类型对西南地区(图4i)逐月降水影响的趋势变化与全国及其他子区域的影响在趋势上较为一致,但在幅度上要明显大于对其他区域的影响。总之,12种环流类型对我国降水的影响从季节上来看,在降水量大的月份(5~9月)的影响要明显大于降水量小的月份(10~4月)(图4a~i);从趋势上来看,对降水量大的月份的影响较为稳定,而对降水量小的月份的影响相对较大(图4a~i)。
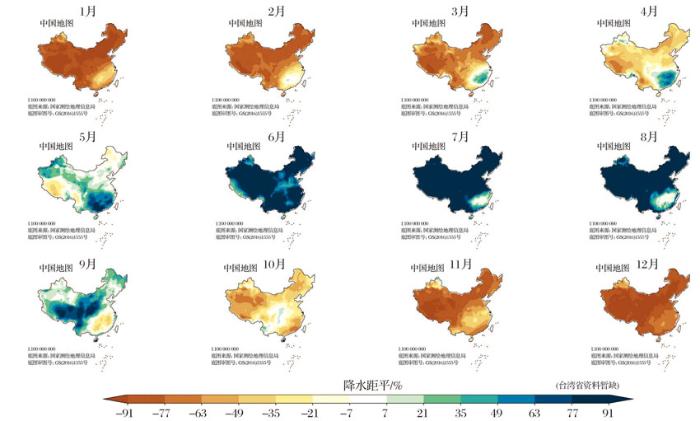
为了明晰环流类型对中国降水影响的空间特征,我们分析了1979—2016年逐月降水距平的空间变化特征(图5)。结果显示,全国范围降水正距平的月份为6~8月,即降水最多的月份。全国范围降水全部为负距平的月份为11月至翌年2月,即降水最少的月份。对于9月,除华南地区降水为负距平以外,其他区域均为正距平。与此同时,华南地区降水正距平的月份要明显早于其他区域,华南部分区域开始于3月。这与华南雨季开始和雨带的北移时间相一致。
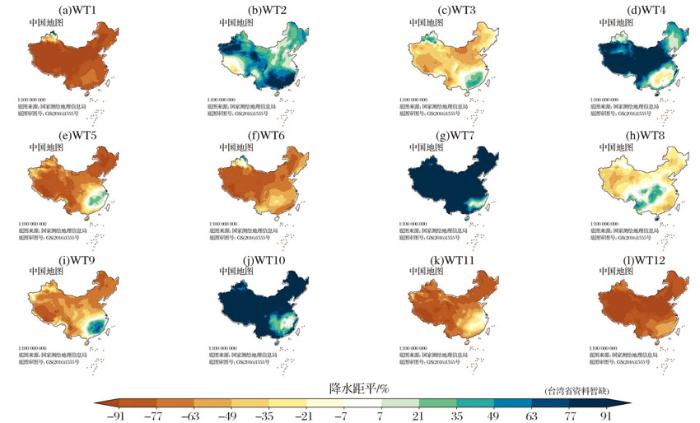
通过对12种环流类型对全国范围降水影响的分析显示,第7种(WT07, 图6g)和第10种(WT10, 图6j)环流类型会引发全国范围的降水增加,第2种环流类型(WT02, 图6b)会引发全国绝大部分区域降水的增加,但青藏高原部分区域的降水会减少,第4种(WT04, 图6d)环流类型也会引发全国绝大部分区域降水的增加,但会引发华南地区降水的减少。第11种(WT11, 图6k)和第12种(WT12, 图6i)环流类型会引发全国范围降水的减少,第1种(WT01, 图6a)和第6种(WT06, 图6f)也会引发全国绝大部分区域降水的减少,但会引发新疆极小区域降水的增加。第5种(WT05, 图6e)和第9种(WT11, 图6g)环流类型会引发除华南部分区域的全国范围降水的减少。第3种(WT03, 图6c)和第8种(WT11, 图6h)环流类型引发的中国降水变化的幅度最小,第3种环流类型除会引发新疆北部和华南部分区域的降水会增加以外,其他区域的降水会略有减少。第8种环流类型引发的降水变化在西南和华南部分区域会略有增加,而在其他区域会略有减少。由此可看出,对中国降水变化影响最大的环流类型为第1种、第7种、第10种和第12种环流类型。第1种和第12种环流类型会引发几乎全国范围降水的异常减少,而第7种和第10种环流类型会引起几乎全国范围降水的异常增加。需要特别注意的是,这4种环流类型并不完全是在1979—2016年的发生频次发生了显著变化的4种环流类型(即第4种、第9种、第11种和第12种)。
图5 观测的中国1979—2016年逐月降水距平
Fig.5 Mean observed monthly precipitation anomalies for the period from 1979 to 2016
图6 12种环流类型对应的1979—2016年降水距平
Fig.6 Mean precipitation anomalies corresponding to twelve WTs from 1979 to 2016
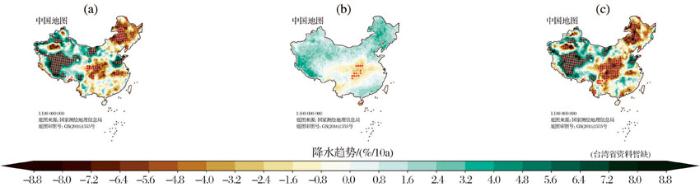
为了揭示到底环流类型怎么影响我国的降水,我们把观测的降水变化分解到了因环流类型发生频次变化而引起的降水变化和环流类型发生强度变化而引发的降水变化(图7)。器测的中国1979—2016年的降水变化显示,东北、西南以及黄土高原地区的降水有明显的下降趋势,而西北、新疆部分区域和青藏高原地区有明显的增加趋势(图7a),其他区域降水的趋势变化不太明显。降水的变化主要来自于环流类型频次和环流类型对应降水强度的变化。假设每一种环流类型对应的降水强度不随时间变化,令其等于气候的平均态,可以得出图7b环流类型变化导致的年降水趋势;假设环流类型的频率是稳定的,令其为气候平均态,则可以得出图7c对应环流类型的降水强度变化导致的降水趋势变化。最终结果显示,由环流类型发生频次变化引发的中国区域降水的趋势变化幅度较小,而由环流类型对应降水强度变化引发的降水趋势变化的幅度相对较大,而且与器测资料显示的降水趋势变化的空间分布极为相似。因此,我们可认为环流类型对中国降水变化的影响主要是由环流类型对应的降水强度的变化所引起,环流类型发生频次变化对中国降水变化的影响相对较小。
图7 中国1979—2016年年降水变化趋势与环流类型的关系
(a)观测的1979—2016年中国区域年降水变化趋势(%/10年);(b) 环流类型发生频率导致的降水趋势变化和(c) 环流类型对应降水强度导致的降水趋势变化;红色点区域表示趋势通过90%信度检验
Fig.7 Observed precipitation trend and its links to WTs from 1979 to 2016
(a) Observed precipitation trends over China and (b, c) Their assignment to WT frequency and intensity cahnges;Red dots means significant trends with 90% level
本文基于欧洲中期数值天气预报中心提供的再分析资料(ERA-Interim, 1979—2016年),通过选择逐日12UTC的海平面气压、可降水量和700 hPa风速3个变量, 利用倾斜旋转T模态主成分分析方法对中国区域内的大气环流进行了分型。进一步对不同环流类型和中国区域降水趋势和降水量变化间的联系进行了分析,结果显示,不同环流类型对中国区域降水变化的影响不仅在区域上有所差别,而且在月份上也有不同。总体上,环流类型对降水量大的区域的影响要大于对降水量小的区域的影响,对降水量大的月份的影响要大于对降水量小的月份。特别重要的是,我们发现相对于环流类型发生频次对中国降水的影响,环流类型对应的降水强度对中国降水趋势的影响更大。
在本文研究的基础上,将来的工作有必要进一步阐明环流类型对中国降水影响的动力机制。目前的结论是通过对再分析资料和观测资料的分析得出的,将来利用全球气候模式和动力降尺度资料对环流类型与降水的关系进行研究,有助于理解气候模式中环流类型发生频率和对应降水强度变化对降水趋势的影响。
The authors have declared that no competing interests exist.
| [1] |
|
| [2] |
Variations trend of yearly mean air temperature and precipitation in China in the last 50 years [J].中国近50年气温及降水量的变化趋势分析 [J].
通过对我国385个站的观测资料序列进行分析研究,得到我国气候变化的一些特征。近25年全国平均温度有明显的上升趋势,只有极少数测站有明显的降温趋势,华北及东北的广大地区是增温最快、范围最大的地区。全国平均降水量没有明显的变化趋势。逐站分析降水量的年际变化后发现,我国降水量的变化存在着明显的区域特征,新疆地区是降水量增加最快的地区;华中-华北地区的降水则存在明显的减少趋势;这两个地区的平均降水量都与全球海表温度距平有很好的相关性。文中还利用同期大气再分析资料(NCEP/NCAR)尝试分析了气候变化与大气环流特征的关系。
|
| [3] |
Research on the characteristics of interdecadal variability of summer climate in China and its possible cause [J].关于我国夏季气候年代际变化特征及其可能成因的研究 [J].
利用我国 1 60个台站 1 951~ 2 0 0 0年夏季 (6~ 8月 )降水和气温观测资料 ,以及NCEP/NCAR海温、风场和水汽的再分析资料 ,分析了我国夏季风降水和气温的年代际变化特征及其可能成因。分析结果表明 ,我国夏季降水有明显的年代际变化 ,在 1 976年前后发生了一次明显的气候跃变 ,从 1 977年到 2 0 0 0年夏季长江流域的降水明显增加 ,而华北地区和黄河流域夏季降水明显减少 ,出现了严重干旱。分析结果还表明 ,我国西北地区降水的振荡位相要超前于华北地区降水振荡位相 5~ 8年 ,华北地区气候年代际时间尺度变化是从 1 977年起降水减少 ,气温上升 ;但西北地区从 2 0世纪 70年代开始 ,则温度升高 ,降水增多。此外 ,分析结果也表明我国气温同样有年代际变化 ,但不如降水年代际变化明显。作者还从热带太平洋SST (海面温度 )的年代际变化及其对中印半岛和东亚上空水汽输送的影响 ,分析了上述我国气候年代际变化的可能成因。分析结果表明 ,热带中东太平洋的SST也有明显的年代际变化 ,从 1 976年以后热带中东太平洋海水明显增暖 ,出现了明显的“类似ElNi no型”的SST距平分布 ,呈现出“年代际的ElNi no现象”。这种海温异常分布减弱了亚洲夏季风 ,从而减弱了从热带太平洋、中国南海和孟加拉湾向东亚的水汽输送 ,
|
| [4] |
Decadal change in east Asian summer monsoon circulation in the mid-1990s [J].
Abstract Top of page Abstract 1.Introduction 2.Data and Methods 3.Results 4.Summary and Discussion Acknowledgments References [1] A climate shift in the mid-1990s in summertime circulation over east Asia is described and the dynamics associated with the climate shift are discussed. The east Asian summer monsoon has a large interdecadal variability as well as interannual variability. It is suggested herein that the east Asian summer monsoon has undergone a decadal change in the mid-1990s. After the mid-1990s, there has been a significant decrease in the strength of zonal winds near the subtropical jet over the east Asia as well as a distinct increase in precipitation in the southeastern part of China. This decrease of the strength of zonal winds over east Asia could be understood as a barotropic response to a steady forcing associated with heating from increased precipitation. These decadal changes are significantly predominant only in the summertime. Concurrently, there has been a remarkable increase in the number of the typhoon passing through the southeastern part of China. It is suggested that the distinctive increase of the typhoon passing may be partly responsible for the increased precipitation in the same area after the mid-1990s.
|
| [5] |
Recent changes in the summer precipitation pattern in East China and the background circulation [J].
This study documents the decadal changes of the summer precipitation in East China, with increased rainfall in the Huang-Huai River region (HR) and decreased in the Yangtze River region (YR) during 2000–2008 in comparison to 1979–1999. The main features of the atmospheric circulation related to the increased precipitation in the HR are the strengthened ascending motion and slightly increased air humidity, which is partly due to the weakened moisture transport out of the HR to the western tropical Pacific (associated with the weakened westerly over East Asia and the warming center over the Lake Baikal). The rainfall decrease in the YR is related to the weakened ascending motion and reduced water vapor content, which is mainly related to the weakened southwesterly moisture flux into the YR (associated with the eastward recession of the Western Pacific Subtropical High). The global sea surface temperature (SST) also shows significant changes during 2000–2008 relative to 1979–1999. The shift of the Pacific decadal oscillation (PDO) to a negative phase probably induces the warming over the Lake Baikal and the weakened westerly jet through the air-sea interaction in the Pacific, and thus changes the summer precipitation pattern in East China. Numerical experiments using an atmospheric general circulation model, with prescribed all-Pacific SST anomalies of 2000–2008 relative to 1979–1999, also lend support to the PDO’s contribution to the warming over the Lake Baikal and the weakened westerlies over East China.
|
| [6] |
Linear relationship between the interdecadal and interannual variabilities of North China rainfall in rainy season [J].华北汛期降水量年代际和年际变化之间的线形关系 [J].
华北地区汛期(7月和8月)降水量的变化具有明显的年代际和年际两种时间尺度. 在年代际时间尺度上, 华北降水在20世纪70年代末发生突然减少. 研究了降水突然减少对应的大气环流变化以及对降水年际变化产生的影响, 发现年代际变化所提供的背景对华北降水年际变化的规律和物理机制没有影响, 华北汛期降水年代际和年际变化之间的关系是线性的.
|
| [7] |
Interdecadal variation of the leading modes of summertime precipitation anomalies over eastern China and its association with water vapor transport over East Asia [J].我国东部夏季降水异常主模态的年代际变化及其与东亚水汽输送的关系 [J].
本文利用1958~2000年ERA-40再分析每日资料和我国516台站降水资料以及EOF方法, 分析了我国东部季风区夏季降水异常主模态的年代际变化特征及其与东亚上空水汽输送通量时空变化的关系。分析结果表明了我国东部季风区夏季降水的时空变化存在两种主模态: 第1主模态不仅显示出明显的准两年周期振荡的年际变化特征且也有明显的年代际变化, 在空间上具有经向三极子型分布; 第2主模态显示出明显的年代际变化特征, 且在空间上具有经向偶极子型分布。这表明了这两主模态有明显的年代际变化, 在1958~1977年期间我国东部夏季降水异常分布为从南到北 “+-+” 经向三极子型分布, 而在1978~1992年期间降水异常出现了与1958~1977年相反的分布, 为从南到北 “-+-” 经向三极子型分布。然而, 在1993~1998年期间, 由于第2主模态的作用增大, 我国东部夏季降水异常为从南到北经向三极子型与 “+-” 偶极子型模态的结合, 这使华南夏季降水明显增加。并且, 分析结果还表明: 这两主模态的年代际变化与东亚上空夏季水汽输送通量的时空变化密切相关, 它不仅与东亚和西北太平洋上空似如东亚/太平洋型 (EAP型) 遥相关波列分布的夏季水汽输送通量异常年代际变化有关, 而且与欧亚上空中高纬度西风带似如欧亚型 (EU型) 遥相关波列的夏季水汽输送通量异常年代际变化密切相关。
|
| [8] |
Shift in the summer rainfall over the Yangtze River valley in the late 1970s [J].
The summer rainfall over the middle-lower valley of the Yangtze River and over the whole eastern China experienced a notable regime shift in about 1979. This change is consistent with a simultaneous jump-like change in the 500 hPa geopotential height (Φ500) over the northern Pacific. The rainfall over the Yangtze River valley is closely related to the Φ500 averaged over the area 20°-25°N, 125°-140°E, with a correlation coefficient of 0.66 for the period 1958-1999. Since 1980, the subtropical northwestern Pacific high (SNPH) has enlarged, intensified, and extended southwestward. The changes in the SNPH are strongly associated with the variations of the sea surface temperatures (SSTs) of the eastern tropical Pacific and tropical Indian Ocean. The anomalies of these SSTs, responsible primarily for the shift of the summer rainfall over the Yangtze River through the changes in SNPH, precede the Φ500 signals with different leading times.
|
| [9] |
Circulation vs. climatic changes over the Czech Republic: A comprehensive study based on the COST733 database of atmospheric circulation classifications [J].
Very high variability in the results, caused both by the variability within stations and within the circulation classifications used, suggests that such a comparative approach is highly desirable in synoptic-climatological studies.
|
| [10] |
Synoptic-climatological applicability of circulation classifications from the COST733 collection: First results [J].
A large number of classifications of circulation patterns, collected within the COST733 Action, have been evaluated as to their synoptic-climatological applicability, defined here as the ability to stratify daily maximum and minimum temperature at a network of stations across Europe. The methods vary widely in their synoptic-climatological applicability. The number of types plays an important role. After the effects of varied number of types is eliminated, several classification methods emerge that have a good ability to stratify surface temperature. They include especially various variants of the Hess鈥揃rezowsky catalogue and the Lamb classification. The synoptic-climatological performance of many classifications differs between winter and summer; there are also considerable differences between a large and small spatial domain, on which the classifications are defined.
|
| [11] |
Classifications of atmospheric circulation patterns[J]. Annals of the New York Academy of Sciences. Classifications of atmospheric circulation patterns [J]. |
| [12] |
An example of using obliquely rotated principal components to detect circulation types over Europe [J].
Aportación documental a la historia del convento de Santo Domingo de Gerona
|
| [13] |
An intercomparison of computer-assisted circulation classification methods [J]. |
| [14] |
Properties of the circulation classification scheme based on the rotated principal component analysis [J].
The study addresses some methodological issues of application of principal component analysis (PCA) to the classification of circulation patterns. The obliquely rotated PCA in T-mode (i.e. with time observations corresponding to variables and grid points to realizations) is applied to 500 hPa geopotential heights over Europe and adjacent parts of Atlantic Ocean. The solutions are examined for various numbers of principal components rotated, and for both raw and anomaly data, with the aim to find the way of determining the optimum number of circulation types. This is done, among others, by examining temporal and spatial stability of solutions, their compliance with simple structure requirements, and temporal behaviour of classifications. Some of the solutions that are pre-selected according to the rule based upon the separation between successive eigenvalues prove to perform considerably better than unselected ones; some of them do not. Which pre-selected solutions should be given preference is impossible to decide in advance, without a detailed scrutiny. Nevertheless, even after such a scrutiny is done, more than a single classification are acceptable. The final choice of the optimum solution depends on the aims of the intended study: It should balance the demands on statistical stability of types and on resemblance between types and daily patterns classified with them.
|
| [15] |
Cost733cat—A database of weather and circulation type classifications [J].
A new database of weather and circulation type catalogs is presented comprising 17 automated classification methods and five subjective classifications. It was compiled within COST Action 733 鈥淗armonisation and Applications of Weather Type Classifications for European regions鈥 in order to evaluate different methods for weather and circulation type classification. This paper gives a technical description of the included methods using a new conceptual categorization for classification methods reflecting the strategy for the definition of types. Methods using predefined types include manual and threshold based classifications while methods producing types derived from the input data include those based on eigenvector techniques, leader algorithms and optimization algorithms. In order to allow direct comparisons between the methods, the circulation input data and the methods鈥 configuration were harmonized for producing a subset of standard catalogs of the automated methods. The harmonization includes the data source, the climatic parameters used, the classification period as well as the spatial domain and the number of types. Frequency based characteristics of the resulting catalogs are presented, including variation of class sizes, persistence, seasonal and inter-annual variability as well as trends of the annual frequency time series. The methodological concept of the classifications is partly reflected by these properties of the resulting catalogs. It is shown that the types of subjective classifications compared to automated methods show higher persistence, inter-annual variation and long-term trends. Among the automated classifications optimization methods show a tendency for longer persistence and higher seasonal variation. However, it is also concluded that the distance metric used and the data preprocessing play at least an equally important role for the properties of the resulting classification compared to the algorithm used for type definition and assignment.
|
| [16] |
The ERA-Interim reanalysis: Configuration and performance of the data assimilation system [J].
ERA-Interim is the latest global atmospheric reanalysis produced by the European Centre for Medium-Range Weather Forecasts (ECMWF). The ERA-Interim project was conducted in part to prepare for a new atmospheric reanalysis to replace ERA-40, which will extend back to the early part of the twentieth century. This article describes the forecast model, data assimilation method, and input datasets used to produce ERA-Interim, and discusses the performance of the system. Special emphasis is placed on various difficulties encountered in the production of ERA-40, including the representation of the hydrological cycle, the quality of the stratospheric circulation, and the consistency in time of the reanalysed fields. We provide evidence for substantial improvements in each of these aspects. We also identify areas where further work is needed and describe opportunities and objectives for future reanalysis projects at ECMWF. Copyright 2011 Royal Meteorological Society
|

/
| 〈 |
|
〉 |
