
温家洪 , 袁穗萍, 李大力, 王璐阳, 张敏, 杜士强
上海师范大学地理系, 上海 200234
Wen Jiahong, Yuan Suiping, Li Dali, Wang Luyang, Zhang Min, Du Shiqiang
中图分类号: P951
文献标识码: A
文章编号: 1001-8166(2018)04-0350-11
收稿日期: 2017-07-30
修回日期: 2017-12-12
网络出版日期: 2018-04-20
版权声明: 2018 地球科学进展 编辑部
基金资助:
作者简介:
First author: Wen Jiahong(1966-), male, Xingguo County, Jiangxi Province, Professor. Research areas include natural disaster risk analysis and management, climate change adaptation.E-mail:jhwen@shnu.edu.cn
作者简介:温家洪(1966-),男,江西兴国人,教授,主要从事自然灾害风险分析与管理研究.E-mail:jhwen@shnu.edu.cn
展开
摘要
海平面上升是人为气候变暖最为严重的后果之一。近年来海平面上升及其风险管理研究与实践取得了突破性进展:①海平面上升作为一种致灾因子,需要预测未来可能的情景及其概率,并关注低概率高影响的上限情景。为此,近年来发展了完全概率估计方法,以典型浓度路径和共享社会经济路径情景为条件,对未来海平面上升进行多情景及其概率估算。②在高排放情景下,冰盖模式模拟得出南极冰盖到2100年对海平面的贡献高达0.781.50 m,远高出IPCC第五次报告的估计。③21世纪末的全球平均海平面(GMSL)上限由原来的2.0 m调高为2.5 m,并指出21世纪之后,海平面上升仍很可能加速,但上升的不确定性将增大。④发展了综合考虑极端情景和中间情景、适应对策路径和稳健决策等方法,进行长周期关键项目决策、规划和风险管理,以管理海平面上升的潜在影响和风险。海平面上升及其风险管理研究今后需要加强监测、分析和模拟来预测不同时间尺度全球、区域和地方海平面上升的情景和概率,加强冰盖的动力过程和突变研究,减小海平面上升预测的不确定性,评估其上限情景,加强深度不确定性下的风险决策方法及其应用研究,以满足沿海地区气候变化适应规划和风险管理决策的需求。
关键词:
Abstract
Sea level rise is among the most severe societal consequences of anthropogenic climate change. Significant advance has been achieved in recent years in the study of future sea level rise and its risk management practice: ①Sea level rise is considered as a kind of hazard,its future plausible scenarios and their probabilities are necessary to be predicted and estimated,and the upper limit with very low probability and high consequences should be emphasized. For this purpose,a complete probability distribution framework has been developed to predict the scenarios and probabilities of future sea level rise with Representative Concentration Pathways (RCPs) and the Shared Socioeconomic Pathways (SSPs) in recent years. ② For a high emissions scenario,it was found that Antarctic Ice Sheet might make a contribution to Global Mean Sea Level (GMSL) rise as high as 78150 cm (mean value 114 cm) by 2100. For the same scenario,the IPCC Fifth Assessment Report gave an Antarctic contribution of only -8+14 cm (mean value 4 cm). ③ Recent studies recommended a revised worst-case (Extreme) GMSL rise scenario of 2.5 m from previous 2.0 m by 2100. It is recognized that GMSL rise will not stop at 2100; rather,it will continue to rise for centuries afterwards,but the degree of uncertainty related to sea level rise will increase. ④ Approaches of combining the upper-bound scenario and a central estimate or mid-range scenario, Adaptation Pathways and robust decision-making are developed to provide a set of long-term planning envelope. These decision-making methods are used widely in coastal risk management related to future sea level rise. Sea level rise and its risk management need to enhance monitoring,analysis and simulation to predict the global,regional and local seal level rise scenarios and the probabilities with different time scales,reduce the estimate uncertainty, assess its upper limits, and enhance decision methods and their application under deep uncertain, in order to meet the needs of climate change adaptation planning,decision-making and long-term risk management in coastal regions.
Keywords:
海平面上升被认为是人类社会面临的最重要的风险之一[1]。近来年,海平面上升及其风险管理从两方面取得了显著进展,一是从气候变化适应、风险管理与决策的视角,对海平面上升的信息需求有了重要的新认识,并意识到海平面上升预测包括IPCC报告可能存在的不足[24];二是自2013年IPCC第五次评估报告以来,对海平面上升研究,特别是南极冰盖对未来海平面的贡献研究取得了显著进展[57]。海平面上升属于缓发型灾害,对未来海平面上升及其风险管理问题,国内学者和海岸带管理者还没有引起足够重视,本文综述上述两方面的国际最新进展,并初步探讨了海平面上升风险管理的理念与策略,以飨读者。
海平面的波动总是与全球气候变化振荡密切相关。末次间冰期(距今129 000116 000年前)全球平均海平面(Global Mean Sea Level,GMSL)约比现在高出6 m[810]。距今2万年前末次冰盛期结束,冰盖开始融化,GMSL在1.3万年内上升了约130 m[11],上升最快时可超过每百年4 m[8]。自1880年起,GMSL上升了2124 cm;自1993年,上升了约8 cm[1214]。19世纪末以来GMSL的上升速率比至少近2 800年以来的任何时期都异常的快[15]。海平面加速上升是海岸带风险管理面临的严峻挑战,未来数十年、21世纪末或之后,GMSL将上升多少成为关注的焦点。围绕着这一问题,近年来关于全球、区域和地方的未来海平面上升情景和概率取得了显著进展。
未来海平面变化预测主要有4种方法:①基于全球CO2排放典型浓度路径情景(Representative Concentration Pathways,RCPs),如IPCC第五次评估报告[16],最新的研究则往往基于共享社会经济路径(Shared Socioeconomic Pathways,SSPs)情景[17,18],采用“基于过程”的模式,估计海平面各分量如热膨胀、冰川融化和冰盖动力过程的贡献,累加各分量的贡献,从而对未来海平面变化进行预测;②半经验方法[19,20],基于降低了复杂性,但物理上合理的模型,构建海平面响应全球温度或辐射强迫变化的统计关系,评估未来海平面变化;③通过专家判断和随机抽样来估算未来海平面上升情景和概率的方法[2123];④对历史观测数据进行统计分析得到过去海平面变化的主要周期和速率,通过简单外推对未来海平面变化进行预测。但对于海平面上升长期预测,该方法通常只提供参考基线[22]和短时间尺度的预测[24]。通常认为基于过程的方法不确定性最低[16],但当前的趋势是几种方法的综合,如最新的关于GMSL情景与概率,以及纽约未来海平面上升的高限情景的评估就综合了基于过程、半经验方法、专家判断方法的结果[4,22,25,26]。
对于长寿命的关键基础设施,确定2100年及之后GMSL可能的上限极为重要。基于格陵兰可能的最大冰物质损失等估算,Pfeffer等[27]给出了GMSL上限值,并成为Parris等[28]提出的到2100年GMSL的上界为2.0 m的基础。近几年,基于重力卫星测量、现场GPS监测和物质平衡估算获得的越来越多的证据表明,南极和格陵兰的物质损失在加速[2933]。由于南极周围海洋环流的变化,加速了南极冰盖的融化,冰盖某些部分崩解不可避免[34,35]。此外,最近物理过程模式发展了与边缘冰崖不稳定性、冰架水文裂隙化(hydrofracturing,雨水和融水增强的裂隙化)和崩解相关的物理反馈模拟,并耦合到冰盖模式,用于估计南极冰盖对海平面的贡献[7]。基于这些反馈模拟南极冰盖,在RCP8.5情景下,到2100年,GMSL上升的中位值将可能额外增加0.61.1 m[5]。与此同时,在格陵兰岛,有迹象表明,加速导致高情景(high-end)融化的过程可能已经开始[36]。表面径流注入冰盖底部和海洋变暖作用下,格陵兰冰盖正在发生冰动力的重要变化,这可能使Jakobshavn Isbræ和 Kangerdlugssuaq冰川,以及东北格陵兰冰流因海洋冰盖的不稳定性,变得更为脆弱[30]。
越来越多的证据表明,南极和格陵兰冰物质损失加速,只是增大考虑海岸带风险管理最坏情景的一个方面。Miller等[37]和Kopp等[38]讨论了支持2100年GMSL上升最糟情景范围为2.0 2.7 m的多个论据:①Pfeffer等[27]假设海水热膨胀对GMSL的贡献为30 cm。然而,Sriver等[39]发现物理上热膨胀可能的上限可超过50 cm(额外增加了20 cm)。②Pfeffer等[27]提出到2100年南极的最大贡献约为60 cm,基于Bamber等[40]的专家评判研究,假设到2100年南极融化速率保持线性增加,第95分位的融化速率将达到约22 mm/a,则可能超过该值30 cm。③Pfeffer等[27]的研究没有包括由于地下水抽取,陆地蓄水量可能减少,Church等[16]发现21世纪陆地水储量变化对GMSL上升的贡献为-111 cm。因此,越来越多研究支持到2100年GMSL上界高于Pfeffer等[27]估计的2.0 m[37,3944]。另外,如前所述,最新的模式模拟得出南极冰盖物质损失持续加速,并将额外增加海平面上升[5] 。因此,最新研究建议将2100年GMSL上升的最糟(极端)情景修改为2.5 m[4,38]。
Parris等[28]给出了到2100年GMSL的下限(lower-end)情景为0.2 m,Sweet等[4]建议该值上调为0.3 m。主要原因是卫星高度计近1/4世纪监测的GMSL上升速率保持在3 mm以上,主要波动是与厄尔尼诺—南方涛动(ENSO)相关的年际变率[13,4547]。另外,过去30年(自1980年代中期以来),基于验潮站重建的GMSL[14,15]与1993年开始的高度计记录非常相近,以约3 mm/a的速率持续上升。如果21世纪持续这一上升速率,则GMSL至少上升0.3 m。另外,即使是典型浓度路径最低情景(RCP2.6)下,多个概率估计显示GMSL仍非常可能(>90%的概率)上升2530 cm。
在IPCC第五次评估报告[16]的基础上,最新的GMSL上升研究强调其概率分布,特别是聚焦于探讨低概率情景或提供完全条件概率分布的上升范围。相关研究综合了多种海平面上升估算方法的现有结果,在特定的概率分析框架中包含了额外的某些假设,例如,依赖结构化的专家启发式判断评估了过程模式没能捕捉到的冰盖融化的贡献[40],或者从地质证据中构建过去海平面和大气温室气体浓度[42]或温度[15]的关系。
研究发现到2100年RCP2.6,4.5和8.5情景下,GMSL上升90%的概率范围(第5至95分位)分别为0.250.80,0.350.95和0.51.3 m[37,38,48,49]。这些预测与过去2800年全球温度/GMSL的关系相一致[15]。
在RCP8.5情景下,到2100年GMSL高限值包括约1.8 m(95分位)[4143],约2.2 m(99分位)[44],以及约2.5 m(99.9分位)[38],这些结果均超出了IPCC第五次评估报告的GMSL上升范围。
基于典型浓度路径,到2100年GMSL上升的6种情景及其超越概率见表1[38]。
表1 2100年GMSL(中位值)情景的超越概率[
Table 1 Probability of exceeding GMSL(median value)scenarios in 2100[
| GMSL上升情景/m | RCP2.6 | RCP4.5 | RCP8.5 |
|---|---|---|---|
| 低(0.3) | 94 | 98 | 100 |
| 中—低(0.5) | 94 | 98 | 100 |
| 中(1.0) | 2 | 3 | 17 |
| 中—高(1.5) | 0.40 | 0.50 | 1.30 |
| 高(2.0) | 0.10 | 0.10 | 0.30 |
| 极端(2.5) | 0.05 | 0.05 | 0.10 |
值得注意的是,冰盖模式的最新结果[5]尚未纳入GMSL的条件概率分析,上述结果是假设冰盖物质损失为恒定加速,情况可能并非如此[5,50,51],如Bars 等[51]基于RCP8.5情景,利用概率密度函数得出到2100年海平面上升的中位值为1.84 m,95%分位为2.92 m。因此,海平面上升有可能在21世纪前期为中间情景,而在世纪末为高或极端情景。在RCP2.6和RCP8.5情景下,超过低情景的概率分别为94%和100%,而超过极端情景的概率为0.05%0.1%。然而,新的证据显示南极冰盖物质损失如果持续加速,特别是RCP8.5情景下,可能会显著增加中—高、高和极端情景的概率。
基于不同年份SSPs预估的情景和2100年辐射强迫目标(FTs),Nauels等[18]采用一个综合的海平面上升模型预估,并考虑了由冰架水文裂隙化和冰崖不稳定性导致的南极加速冰流[5],预估未来海平面上升。得出在可持续发展(SSP1)情景,相对于1986—2005年,到2100年海平面上升的中位值为89 cm(可能范围:57130 cm),中度发展情景(SSP2)为105 cm(73150 cm),局部发展情景(SSP3)为105 cm(75147 cm),不均衡发展情景(SSP4)为93 cm(63133 cm),以及传统化石燃料为主的发展(SSP5)为132 cm(95189 cm)。其模型将特定排放情景和社会经济指标与海平面上升预估相关联,并认为快速和尽早减排对于降低2100年的海平面上升至关重要。
大多数研究只给出了21世纪GMSL的变化趋势,以及到2100年的上升情景,但认识到2100年之后GMSL不会停止上升是重要的,因为研究结果认为未来几个世纪海平面将继续升高[38,52]。到2200年,0.32.5 m的GMSL上升范围将增加到0.49.7 m(表2)[4]。从表2可得,在低情景下GMSL上升会减速,到2200年只略有增加;中—低情景下将温和地持续加速,而在其他情景下,将显著加速(表2)。21世纪GMSL上升速率从低情景下近似恒定的3 mm/a,到世纪末其他情景下的544 mm/a,显示出不同的加速度[4]。2200年GMSL上升量并不一定反映了冰盖、冰崖、冰架反馈过程可能的最大贡献,而这些过程有可能显著增加GMSL的上升量[5]。
表2 自2000年起算的GMSL上升情景(19年的平均中值)[
Table 2 GMSL rise scenario heights in meters for 19-year averages centered on decade through 2200 initiating in year 2000(only median values are shown) [
| GMSL情景 | 2010年 | 2020年 | 2030年 | 2040年 | 2050年 | 2060年 | 2080年 | 2090年 | 2100年 | 2120年 | 2150年 | 2200年 |
|---|---|---|---|---|---|---|---|---|---|---|---|---|
| 低 | 0.03 | 0.06 | 0.09 | 0.13 | 0.16 | 0.19 | 0.25 | 0.28 | 0.3 | 0.34 | 0.37 | 0.39 |
| 中低 | 0.04 | 0.08 | 0.13 | 0.18 | 0.24 | 0.29 | 0.4 | 0.45 | 0.5 | 0.6 | 0.73 | 0.95 |
| 中 | 0.04 | 0.1 | 0.16 | 0.25 | 0.34 | 0.45 | 0.71 | 0.85 | 1 | 1.3 | 1.8 | 2.8 |
| 中高 | 0.05 | 0.1 | 0.19 | 0.3 | 0.44 | 0.6 | 1 | 1.2 | 1.5 | 2 | 3.1 | 5.1 |
| 高 | 0.05 | 0.11 | 0.21 | 0.36 | 0.54 | 0.77 | 1.3 | 1.7 | 2 | 2.8 | 4.3 | 7.5 |
| 极端 | 0.04 | 0.11 | 0.24 | 0.41 | 0.63 | 0.9 | 1.6 | 2 | 2.5 | 3.6 | 5.5 | 9.7 |
至于实际的GMSL上升情景,在21世纪早期,可能是与中—低或中间情景相当的上升幅度。由于冰盖物质损失率可能并非呈线性变化[5],在21世纪晚期,GMSL上升速率可能会转向更高的情景,并可能超过预估的所有速率。地质记录表明,末次冰退期(20 0009 000年前),GMSL上升速率约大于10 mm/a,在融水脉冲阶段速率大于40 mm/a[37,53]。
在过去的一个世纪[14,54,55],或者说在地质历史记录的任何时间[15,56],全球海平面变化在空间都不均匀。风场、气压场、海—气热量和淡水通量、洋流阶段性和长期的变化驱动着海洋物质的动态重新分配,导致区域海平面的变化。
预估当地相对海平面上升情景需要考虑一系列影响海平面变化的过程及其空间格局,并应与预测的GMSL上升幅度保持一致。可设累积海平面上升为:
ST= SO+SI+SL+SG,
式中:ST为自基线以来的海平面变化,SO为海洋变化,SI为冰物质变化,SL为人为的陆地水储量变化,SG为地面的垂向运动。
上述4个分量可进一步分解为冰盖物质变化、山地冰川物质变化、海洋过程、陆地水储量变化,以及构造和沉积物压实,用于构建每一种情景和概率分布。
地面的垂向运动是影响相对海平面变化趋势的一个重要因素。许多大河口三角洲已经或正在面临严重的相对海平面上升,例如,珠江三角洲的相对海平面上升可能超过7.5 mm/a,长江三角洲为328 mm/a[57]。在这些地区,自然和非气候过程如冰川均衡代偿作用(Glacial Isostatic Adjustment,GIA)和沉积物压实导致相对海平面上升增加0.52 mm/a[15],而人工抽取地下水和开采石油/天然气进一步导致了相对海平面上升[37,5861]。另一方面,有些地区,如阿拉斯加南部地区,由于冰川均衡代偿作用,地面抬升大于10 mm/a,相对海平面趋势为负值[62]。
美国国防部有众多设施分布在全球沿海,Hall等[63]评估了这些设施所在地的相对海平面上升。基于Perrette等[64]和Kopp等[38]的气候格网数据,利用蒙特卡洛采样对2100年GMSL上升的特定情景给出所得样本的权重,确定给定地点的相对海平面上升情景。Hall等[63]还利用全球GPS监测和验潮站数据,根据地面升降调整进一步确定当地的相对海平面上升情景。为将区域的概率预测与GMSL上升情景建立关联,Sweet等[4]从RCP 2.6,RCP4.5和RCP8.5情景中,利用蒙特卡洛对GMSL和区域的相对海平面预测的时间序列各采样20 000次,获得了美国海岸线1度格网的区域相对海平面上升。纽约市气候变化委员会预估相对于1985—2005年,纽约市到2100年90分位的海平面上升上限(upper bound)约为190 cm。Grinsted等[41]利用概率估计方法评估了RCP8.5下,北欧地区及其主要城市6种概率条件下21世纪相对海平面的上升情景。可见,近年来地方海平面变化研究也转向提供相对海平面上升的情景和概率,并关注其上限估计。
使用上限或上界情景的思想,也已应用于海岸带风险管理实践,突出表现在伦敦的泰晤士河口2100计划(TE2100)。该计划确定的21世纪海平面上升的上界为2.7 m,该值是根据Rohling等[42]和Pfeffer等[27]得出的末次间冰期海平面平均上升速率,通过降尺度,并考虑区域和地方因素的不确定性,综合获得的[65,66]。
风险是指潜在的损失,即风险既包含负面的后果,也包含事件发生的概率。灾害风险是由致灾因子、暴露和脆弱性三者综合作用的结果。从风险管理的视角,国际学界得出的共识是海平面上升作为一种致灾因子,需要考虑其强度(量级)和概率2个方面。海平面上升的概率估计可以帮助适应性规划考虑不同的风险忍受水平[4,41]。同时,海平面上升问题还需关注其低概率高影响的事件和情景[2,3,6]。确定2100年及以后的海平面上升可能的上限,对于长寿命关键基础设施的规划与决策极为重要[4,6,21]。
IPCC第五次评估报告给出了各典型浓度路径的GMSL的情景和概率[16]。对于海岸带管理者,IPCC的海平面上升情景是最权威的有关未来海平面的信息来源,的确,这些情景确实在全球广泛用于评估海岸带风险和适应。但是对于高风险海岸带的管理者来说,这些情景并非正确的依据,至少不是唯一的依据。从海岸带风险管理的角度,使用IPCC的情景有2个值得关注的问题[3]。
首先,IPCC情景关注的是全球海平面变化概率分布的中部,而不是高风险的尾部。因为IPCC第一工作组确定的海平面上升情景,目的是理解地球系统过程和减少不确定性,而海岸带管理者的目的是降低风险,因此,两者的视角完全不同[3,67]。
IPCC第五次评估报告[16]基于过程模式集合和其他信息,预测了1986—2005年到2081—2100年典型浓度路径RCP 2.6,4.5和8.5情景下,GMSL上升中位值和可能(66%的概率)的范围分别为0.44 m(0.280.61 m),0.53 m(0.360.71 m)和0.74 m(0.520.98 m)。正如IPCC所定义的,“可能”范围被评估为至少有66%的概率包含真值[68],到2100年GMSL上升约有1/3的概率位于可能范围之外[69],从规避风险的角度(risk-averse perspective),这是不可忍受的。鉴于GMSL大约有33%的概率或许落在可能范围之外,规避风险的决策者发现,IPCC未来全球海平面上升可能的范围不足于为规划提供依据,因为对于风险管理而言,概率分布上限尾端是重要的信息。在人口稠密,拥有大量重要基础设施的沿海低地,大型风暴洪水是需要防范的主要风险,而IPCC的情景并非为此进行设计的。例如,海岸带附近核电站的从业和管理者可能对未来GMSL上升估计结果的第99分位(或99.9分位等)更感兴趣,以便稳健地管理其风险,因为总风险中低概率但高影响的后果往往占有不成比例的份额,海岸带的许多影响与海平面上升的幅度呈高度非线性的关系[70]。
其次,第五次评估报告主要是基于过程模式估计未来GMSL上升的情景。这些模型基于物理定律,并结合了过程的参数化,但这些参数不能刻画足够详细的细节。第五次评估报告海平面上升一章也评估了其他方法,例如,半经验模型、冰盖动力学的物理模型和海平面变化的历史重建记录。其他方法得出的未来GMSL的范围均高于基于过程模型的。但这些结果并没有综合到IPCC的情景中,因为评估报告的作者认为其他方法的可信度更低。然而,风险管理要求决策分析要基于所有已有知识,包括使用的不同方法,以及所有的不确定性和专家之间有歧义的观点[71]。为海岸带风险管理构建海平面上升情景时,其他方法的结果可信度较低,也不应抛弃,因为较低可信度的信息仍然与规避风险的决策相关[3]。
直到最近,海平面上升研究还是普遍提供单一的“中间范围”或“中部”预测值[72,73]。这种方法可能足以解决近期规划的需要。然而,中短期规划通常不能满足许多决策的需求,例如,现有长寿命关键基础设施或新的基础设施(如发电厂、军事设施)的规划决策与管理者,需要考虑更广泛的风险,包括那些低概率高影响的情景。
Hinkel等[3]认为传统的海平面上升估算往往偏离了支持风险评估与管理需求的目标。因此,海平面上升的最新研究倾向于基于风险的视角,综合已有科学成果,估计可能的海平面情景与概率,以支持与未来海平面上升相关的风险评估与管理。考虑科学上合理的海平面上升所有范围,包括发生概率极低的可能结果,这与保险、环境毒理等领域以风险为核心的标准做法相一致。基于风险视角的海平面上升估算方法,通常包括基于典型浓度路径的概率估计和不连续的情景方法,及其可能的上下限[3,4,38],即估计未来可能的GMSL全概率分布(图1),为决策者提供最全面的信息库,因此,决策者可以从中选取最相关的某个情景用于其规划过程[6]。
图1 气候模拟典型浓度路径(RCP)下,与排放相关的海平面上升条件概率预估示意图[
Fig.1 Schematic showing the intersection of scenario approaches with emission-dependent (conditional) probabilistic projections of sea level rise under the climate modeling community’s Representative Concentration Pathways (RCP)[
未来海平面上升将威胁到全球沿海地区的人口、生态系统、基础设施以及重要的其他经济和环境资产。海岸带规划者做出关键的决策需要权衡多方面的因素,如决策的类型、预期的未来效应、规划远景,以及风险承受能力,包括资产的临界性和人口暴露的规模和脆弱性等[63]。针对海平面上升的风险管理决策方法目前主要有2类:①基于“情景分析(Scenarios Analysis)”和“概率风险分析(Probabilistic Risk Analysis)”的决策方法;②面向深度不确定性条件下的风险评估和决策量化的稳健决策方法(Robust Decision Making,RDM)。
对于规划师和工程师而言,为特定项目选择一种海平面情景的过程并不简单,目前只有少数案例研究涉及到其应用[63,65]。为风险管理的目标选择有意义的海平面情景,始于理解特定的系统、问题、目标和偏好。这包括①决策类型是什么?业务起讫时间多长?期间决策能否有效地实施?新信息出现时决策的灵活性如何?②如果海平面上升,会对什么产生影响,以及以什么方式?什么将暴露于风险?③对于宝贵的资产,在短期和长期,哪些后果是想要避免的?风险承受能力多大?④重要的人文和自然系统是否存在一旦超过,损失将激增的阈值或临界点?⑤海岸系统的详细信息有哪些?例如,海拔、海岸线的特征,有价资产(房屋、基础设施、敏感的生态系统)的位置?
风险决策过程的关键是明确给定相对海平面上升量,可能造成新建或现有基础设施的影响多大,这将决取于地形、土地覆被、物理强迫(即影响典型极值水位分布的因素),以及现有风暴洪水防御设施等。因此,重要的是要认识当地物理强迫特征和机制,以及在未来海平面情景下,物理强迫的特征如极值水位事件的幅度、频率或持续时间是如何变化的。在一些地方小幅的相对海平面上升将大大增加洪水发生的频率和空间范围。例如,给定相对海平面上升量,在平坦、低洼的海岸带,潮汐洪水已经并将继续变得更加频繁和严重[74,75]。
适应性规划的前期,首先需要建立海平面上升、目标系统,以及对系统的威胁之间的概念框架。第二步,根据未来不同情景对系统和规划进行压力测试,以评估潜在的风险。对于适应能力有限或缺乏弹性的长周期项目的规划,21世纪后期GMSL上升高度不确定性的问题愈加凸现。如果没有充分考虑到低概率高影响的后果,将显著增加未来的暴露和风险[6]。对于许多决策,评估最坏情景是必要的,而不只是评估科学上“可能”发生的情景。例如,泰晤士河口2100计划中,规划者认为,在规划新的防洪基础设施保护伦敦市21世纪免受泰晤士河风暴洪水的影响过程中,极端海平面上升情景是技术分析的关键内容[65]。
针对至关重要的决策、规划和长期风险管理,作为选择可能的初步方案的策略为:①确定一个科学合理的海平面上升的上限(这可能被认为是最坏情景或极端情景),尽管发生概率低,但在规划的时间跨度内不能排除。使用这个上限情景作为系统总风险和长期适应战略的指南。②确定一个中值估计或中间情景,使用此情景作为短期规划的基线,如制定未来20年的初始适应规划,该情景和上限情景一起可为规划提供总体方案。
这种方法与Kopp等[26]的建议,以及泰晤士河口2100计划、荷兰水长远管理规划的应用一致[3,65]。持续监测目前海平面的趋势和变化,以及提升相关气候系统过程与反馈的科学认识,识别在中间或最坏情景下,系统随时间的演化。通过系统的评估来确定当前海平面上升及其风险演化,进而选择适应性管理策略,可针对上限情景实施更为积极的应对方案[63,76]。这种决策方法也称为“适应对策路径”或“动态适应政策路径”方法[77]。
由于人类活动造成的气候变化的影响,导致如海水热膨胀、海洋结构变化、陆冰融化、海洋和大气环流,以及陆地水平衡变化,这些因素的复杂相互作用,造成未来海平面无论是年平均还是日极端值均不同于过去的趋势[78]。虽然对一些过程如热膨胀有了较清楚的理解,但其他因素仍然很不确定。例如,目前的模型无法阐明触发或限制陆冰快速流动的关键机制[5]。西南极冰盖(West Antaratic Ice Sheet,WAIS)可能比以前认为的更加不稳定,有可能快速崩解[79]。海平面预测是深度不确定的问题[79]。当专家或决策者不能知道或不同意系统模型关于行动产生的后果或系统模型关键参数的先验概率,则出现深度不确定性[80]。
深度不确定性给决策者带来了情景不确定、决策后果不确定、决策方案不确定等困难和风险[81]。当政策制定者和决策者面临着一个难以预测的、深度不确定的未来时,需要的不仅仅是传统的基于预测的决策分析,以帮助他们在备选方案中做出选择。近年来发展了新的决策方法如稳健决策(Robust Decision Making,RDM),结合日益强大的计算机工具,非常适合深度不确定性情形[82]。RDM基于一个简单的概念:RDM运行模型数百甚至数千次以确定决策计划在未来一系列可能的情景下的表现,而不是用数据和模型来描述一个最佳的未来预估。基于结果数据库的可视化和统计分析,来帮助决策者评估未来各种情形下决策计划的实施情况。RDM可以解释政策如何随时间而演化,表达未来不确定性,并具有可对比的决策标准,从而使管理者的决策更加稳健。RDM是一种发展和评估长期政策或策略的量化和协商方法。
社区组织和政府使用RDM方法构建“稳健”的策略和政策,并能够在一系列的未来情景中充分发挥作用。RDM并不提供任何单一的策略或政策,相反,RDM可以帮助决策者了解哪些策略是最具适应性的,并可调整以满足不断变化的条件,理解哪一组方案在各种情况下都能发挥最佳效果,最终是成本效益高的[83]。RDM创造了一种促进决策者之间对话的全新方式,决策者面对的问题不再是“未来会发生什么事情”,而是转向“现在可以采取哪些措施来确保局势朝着我们期望的方向发展”[84]。
RDM的主要步骤包括明确问题现状,提出政策措施(决策构建)—基于未来不确定性构建未来情景(案例生成)—根据脆弱性分析判定各政策措施在不同未来情景下的表现,判断政策措施是否达标,发现存在洞的情景(情景分析)—分析各政策措施提升城市适应气候变化能力及其经济效益比(权衡分析)—制定适应策略(稳健政策)[82]。
近年来,稳健决策方法被越来越多地应用于解决包括海平面上升等气候变化不确性的决策中,如美国新奥尔良市抵御未来风暴潮适应措施规划[85],路易斯安那州可持续海岸综合总体规划[86]等。
近年来,国际海平面变化研究已取得显著进展,特别是从气候变化适应与风险管理的角度,认识到以往海平面上升研究,包括IPCC报告存在的不足。只预测海平面上升的中间范围或中间情景,不能满足风险决策的信息需求。海平面上升作为一种致灾因子,既需要预测可能的未来情景,还要了解其发生概率,并关注低概率高影响的高限或上限情景。海平面上升及其风险管理的主要进展包括:①在高排放情景下,到2100年南极冰盖对海平面的贡献可能高达0.781.50 m(均值为1.14 m),远高出同一排放情景下IPCC第五次评估报告的-0.080.14 m(均值0.04 m);②发展了完全概率评估方法,以典型浓度路径和共享社会经济路径情景为条件,对海平面上升不同情景和概率进行了预测;③将原来21世纪末2.0 m的GMSL上限调高为2.5 m,并认为21世纪及之后,海平面上升仍很可能加速,但上升的不确定性将增大;④发展了综合考虑极端情景和中间情景、适应对策路径和稳健决策(RDM)等方法,进行长周期关键项目决策、规划和风险管理的策略,在欧美等国家的实践中已得到广泛应用。
一方面,末次间冰期全球年平均温度比工业化前高12 ℃(可以和21世纪的全球变暖类比)[8],当时,GMSL比现在高510 m[9,10]。另一方面,未来气候变化的精确轨迹及其影响存在巨大的不确定性,限制了基于长期预测结果进行与风险相关的决策[87,88]。为了应对海平面上升适应和风险管理的迫切需要,2017年2月,世界气候变化研究计划(World Climate Research Program, WCRP)启动了“区域海平面变化与海岸带影响”重大挑战项目[89]。2015年8月,美国全球变化研究计划和国家海洋委员会联合组成了“海平面上升和海岸洪水灾害情景与工具的跨部门工作组”。海平面上升情景和概率及其上限情景已应用于国际海岸风险管理实践,但该问题在我国学界和沿海规划与管理部门还没有引起足够关注。在现有工作基础上,需要更多的监测、研究来预估不同时间和空间尺度海平面上升的情景和概率,基于海平面变化过程模型模拟,加强冰盖冰动力、临界点和突变的研究,减小预测的不确定性,评估其上限情景。同时,加强海平面上升和海岸洪水风险管理与决策方法及其应用研究,以满足我国沿海地区气候变化适应规划和风险管理决策的不同需求。
The authors have declared that no competing interests exist.
| [1] |
|
| [2] |
Sea-level scenarios for evaluating coastal impacts [J].
Global-mean sea-level rise will drive impacts and adaptation needs around the world's coasts over the 21st century and beyond. A key element in assessing these issues is the development of scenarios (or plausible futures) of local relative sea-level rise to support impact assessment and adaptation planning. This requires combining a number of different but uncertain components of sea level which can be linked to climatic and non-climatic (i.e., uplift/subsidence of coastal land) factors. A major concern remains about the possibility of significant contributions from the major Greenland and Antarctic ice sheets and this must be factored into the assessments, despite the uncertainty. This paper reviews the different mechanisms which contribute to sea-level change and considers a methodology for combining the available data to create relative (or local) sea-level rise scenarios suitable for impact and adaptation assessments across a range of sophistication of analysis. The methods that are developed are pragmatic and consider the different needs of impact assessment, adaptation planning, and long-term decision making. This includes the requirements of strategic decision makers who rightly focus on low probability but high consequence changes and their consequences. Hence plausible high end sea-level rise scenarios beyond the conventional Intergovernmental Panel on Climate Change (IPCC) range and which take into account evidence beyond that from the current generation of climate models are developed and their application discussed. Continued review and development of sea-level scenarios is recommended, starting with assimilating the insights of the forthcoming IPCC AR5 assessment. WIREs Clim Change 2014, 5:129芒聙聯150. doi: 10.1002/wcc.253Conflict of interest: The authors have declared no conflicts of interest for this article.For further resources related to this article, please visit the WIREs website.
|
| [3] |
Sea-level rise scenarios and coastal risk management [J].
The IPCC's global mean sea-level rise scenarios do not necessarily provide the right information for coastal decision-making and risk management.
|
| [4] |
Global and Regional sea Level Rise Scenarios for the United States[R]. NOAA Technical Report NOS CO-OPS 083. Silver Spring, |
| [5] |
Contribution of Antarctica to past and future sea-level rise [J].
Abstract Polar temperatures over the last several million years have, at times, been slightly warmer than today, yet global mean sea level has been 6-9090009metres higher as recently as the Last Interglacial (130,000 to 115,000 years ago) and possibly higher during the Pliocene epoch (about three million years ago). In both cases the Antarctic ice sheet has been implicated as the primary contributor, hinting at its future vulnerability. Here we use a model coupling ice sheet and climate dynamics-including previously underappreciated processes linking atmospheric warming with hydrofracturing of buttressing ice shelves and structural collapse of marine-terminating ice cliffs-that is calibrated against Pliocene and Last Interglacial sea-level estimates and applied to future greenhouse gas emission scenarios. Antarctica has the potential to contribute more than a metre of sea-level rise by 2100 and more than 15090009metres by 2500, if emissions continue unabated. In this case atmospheric warming will soon become the dominant driver of ice loss, but prolonged ocean warming will delay its recovery for thousands of years.
|
| [6] |
How high will the seas rise? [J].
Recent estimates suggest that global mean sea level rise could exceed 2 m by 2100. These projections are higher than previous ones and are based on the latest understanding of how the Antarctic Ice Sheet has behaved in the past and how sensitive it is to future climate change. They pose a challenge for scientists and policy-makers alike, requiring far-reaching decisions about coastal policies to be made based on rapidly evolving projections with large, persistent uncertainties. An effective approach to managing coastal risk should couple research priorities to policy needs, enabling judicious decision-making while focusing research on key questions.
|
| [7] |
DeConto R M, Alley R B. Potential Antarctic Ice Sheet retreat driven by hydrofracturing and ice cliff failure [J]. |
| [8] |
|
| [9] |
A probabilistic assessment of sea level variations within the last interglacial stage [J].
The last interglacial stage (LIG; ca. 130-115 ka) provides a relatively recent example of a world with both poles characterized by greater-than-Holocene temperatures similar to those expected later in this century under a range of greenhouse gas emission scenarios. Previous analyses inferred that LIG mean global sea level (GSL) peaked 6-9 m higher than today. Here, we extend our earlier work to perform a probabilistic assessment of sea level variability within the LIG highstand. Using the terminology for probability employed in the Intergovernmental Panel on Climate Change assessment reports, we find it extremely likely (95 per cent probability) that the palaeo-sea level record allows resolution of at least two intra-LIG sea level peaks and likely (67 per cent probability) that the magnitude of low-to-high swings exceeded 4 m. Moreover, it is likely that there was a period during the LIG in which GSL rose at a 1000-yr average rate exceeding 3 m kyr(-1), but unlikely (33 per cent probability) that the rate exceeded 7 m kyr(-1) and extremely unlikely (5 per cent probability) that it exceeded 11 m kyr(-1). These rate estimates can provide insight into rates of Greenland and/or Antarctic melt under climate conditions partially analogous to those expected in the 21st century.
|
| [10] |
Ice volume and sea level during the last interglacial [J].
Abstract During the last interglacial period, ~125,000 years ago, sea level was at least several meters higher than at present, with substantial variability observed for peak sea level at geographically diverse sites. Speculation that the West Antarctic ice sheet collapsed during the last interglacial period has drawn particular interest to understanding climate and ice-sheet dynamics during this time interval. We provide an internally consistent database of coral U-Th ages to assess last interglacial sea-level observations in the context of isostatic modeling and stratigraphic evidence. These data indicate that global (eustatic) sea level peaked 5.5 to 9 meters above present sea level, requiring smaller ice sheets in both Greenland and Antarctica relative to today and indicating strong sea-level sensitivity to small changes in radiative forcing.
|
| [11] |
Links between climate and sea levels for the past three million years [J]. |
| [12] |
Estimating mean sea level change from the TOPEX and Jason altimeter missions [J].
The Jason-2 satellite altimeter mission was launched in June 2008, extending the record of precision sea level measurements that was initiated with the launch of TOPEX/Poseidon in 1992 and continued with the launch of Jason-1 in December 2001. We have used the measurements from these three missions to construct a seamless record of global mean sea level change from 1993 to the present. We present the results of our calibration activities, including data comparisons during the “tandem period” of the missions, during which we solve for biases between the missions, as well as comparisons to independent tide gauge sea level measurements. When the entire record is assembled, the average rate of sea level rise from 1993–2009 is 3.4 ± 0.4 mm/year. There is considerable interannual variation due to ENSO-related processes, which include the period of lower sea level rise over the last three years of the time series during the recent La Nina event.
|
| [13] |
Sea-level rise from the late 19th to the early 21st century [J]. |
| [14] |
Probabilistic reanalysis of twentieth-century sea-level rise [J].
Abstract Estimating and accounting for twentieth-century global mean sea level (GMSL) rise is critical to characterizing current and future human-induced sea-level change. Several previous analyses of tide gauge records--employing different methods to accommodate the spatial sparsity and temporal incompleteness of the data and to constrain the geometry of long-term sea-level change--have concluded that GMSL rose over the twentieth century at a mean rate of 1.6 to 1.9 millimetres per year. Efforts to account for this rate by summing estimates of individual contributions from glacier and ice-sheet mass loss, ocean thermal expansion, and changes in land water storage fall significantly short in the period before 1990. The failure to close the budget of GMSL during this period has led to suggestions that several contributions may have been systematically underestimated. However, the extent to which the limitations of tide gauge analyses have affected estimates of the GMSL rate of change is unclear. Here we revisit estimates of twentieth-century GMSL rise using probabilistic techniques and find a rate of GMSL rise from 1901 to 1990 of 1.2 脗 0.2 millimetres per year (90% confidence interval). Based on individual contributions tabulated in the Fifth Assessment Report of the Intergovernmental Panel on Climate Change, this estimate closes the twentieth-century sea-level budget. Our analysis, which combines tide gauge records with physics-based and model-derived geometries of the various contributing signals, also indicates that GMSL rose at a rate of 3.0 脗 0.7 millimetres per year between 1993 and 2010, consistent with prior estimates from tide gauge records.The increase in rate relative to the 1901-90 trend is accordingly larger than previously thought; this revision may affect some projections of future sea-level rise.
|
| [15] |
Temperature-driven global sea-level variability in the Common Era [J].
Abstract We assess the relationship between temperature and global sea-level (GSL) variability over the Common Era through a statistical metaanalysis of proxy relative sea-level reconstructions and tide-gauge data. GSL rose at 0.1 00± 0.1 mm/y (20303) over 0-700 CE. A GSL fall of 0.2 00± 0.2 mm/y over 1000-1400 CE is associated with 090804 0.2 00°C global mean cooling. A significant GSL acceleration began in the 19th century and yielded a 20th century rise that is extremely likely (probability [Formula: see text]) faster than during any of the previous 27 centuries. A semiempirical model calibrated against the GSL reconstruction indicates that, in the absence of anthropogenic climate change, it is extremely likely ([Formula: see text]) that 20th century GSL would have risen by less than 51% of the observed [Formula: see text] cm. The new semiempirical model largely reconciles previous differences between semiempirical 21st century GSL projections and the process model-based projections summarized in the Intergovernmental Panel on Climate Change's Fifth Assessment Report.
|
| [16] |
|
| [17] |
. The roads ahead: Narratives for shared socioeconomic pathways describing world futures in the 21st century [J].
Long-term scenarios play an important role in research on global environmental change. The climate change research community is developing new scenarios integrating future changes in climate and society to investigate climate impacts as well as options for mitigation and adaptation. One component of these new scenarios is a set of alternative futures of societal development known as the shared socioeconomic pathways (SSPs). The conceptual framework for the design and use of the SSPs calls for the development of global pathways describing the future evolution of key aspects of society that would together imply a range of challenges for mitigating and adapting to climate change. Here we present one component of these pathways: the SSP narratives, a set of five qualitative descriptions of future changes in demographics, human development, economy and lifestyle, policies and institutions, technology, and environment and natural resources. We describe the methods used to develop the narratives as well as how these pathways are hypothesized to produce particular combinations of challenges to mitigation and adaptation. Development of the narratives drew on expert opinion to (1) identify key determinants of these challenges that were essential to incorporate in the narratives and (2) combine these elements in the narratives in a manner consistent with scholarship on their inter-relationships. The narratives are intended as a description of plausible future conditions at the level of large world regions that can serve as a basis for integrated scenarios of emissions and land use, as well as climate impact, adaptation and vulnerability analyses.
|
| [18] |
Linking sea level rise and socioeconomic indicators under the shared socioeconomic pathways [J].
In order to assess future sea level rise and its societal impacts, we need to study climate change pathways combined with different scenarios of socioeconomic development. Here, we present sea level rise (SLR) projections for the Shared Socioeconomic Pathway (SSP) storylines and different year-2100 radiative forcing targets (FTs). Future SLR is estimated with a comprehensive SLR emulator that accounts for Antarctic rapid discharge from hydrofracturing and ice cliff instability. Across all baseline scenario realizations (no dedicated climate mitigation), we find 2100 median SLR relative to 1986–2005 of 8965cm (likely range: 57–13065cm) for SSP1, 10565cm (73–15065cm) for SSP2, 10565cm (75–14765cm) for SSP3, 9365cm (63–13365cm) for SSP4, and 13265cm (95–18965cm) for SSP5. The 2100 sea level responses for combined SSP-FT scenarios are dominated by the mitigation targets and yield median estimates of 5265cm (34–7565cm) for FT 2.665Wm, 6265cm (40–9665cm) for FT 3.465Wm, 7565cm (47–11365cm) for FT 4.565Wm, and 9165cm (61–13265cm) for FT 6.065Wm. Average 2081–2100 annual SLR rates are 5 mm yrand 19 mm yrfor FT 2.665Wmand the baseline scenarios, respectively. Our model setup allows linking scenario-specific emission and socioeconomic indicators to projected SLR. We find that 2100 median SSP SLR projections could be limited to around 5065cm if 2050 cumulative COemissions since pre-industrial stay below 850 GtC, with a global coal phase-out nearly completed by that time. For SSP mitigation scenarios, a 2050 carbon price of 100 US2005 tCOwould correspond to a median 2100 SLR of around 65 cm. Our results confirm that rapid and early emission reductions are essential for limiting 2100 SLR.
|
| [19] |
Semiempirical and process-based global sea level projections [J].
We review the two main approaches to estimating sea level rise over the coming century: physically plausible models of reduced complexity that exploit statistical relationships between sea level to climate forcing, and more complex physics-based models of the separate elements of the sea level budget. Recent estimates of sea level rise by 2100 have converged, but largely through increased contributions and uncertainty in process based model estimates of contributions from ice sheets. Hence here we focus on ice sheet flow as this has the largest potential to contribute to sea level rise. Recently, progress has been made in ice dynamics, ice stream flow, grounding line migration and integration of ice sheet models with high resolution climate models. Calving physics remains an important and difficult modeling issue. Mountain glaciers, numbering hundreds of thousands, must be modeled by extensive statistical extrapolation from a much smaller calibration dataset. Rugged topography creates problems in process-based mass balance simulations forced by regional climate models with resolutions 10-100 times larger than the glaciers. Semi-empirical models balance increasing numbers of parameters with the choice of noise model for the observations to avoid overfitting the highly autocorrelated sea level data. All models face difficulty in separating out non-climate driven sea level rise (e.g., groundwater extraction) and long term disequilibria in the present day cryosphere-sea level system
|
| [20] |
A semi-empirical approach to projecting future sea-level rise [J]. |
| [21] |
Expert judgements of sea-level rise at the local scale [J].
Whilst local projections of sea-level rise (SLR) are necessary to facilitate targeted climate change adaptation and communication strategies, downscaling from global climate models can be problematic. Here, we use expert probability judgement to elicit a suite of local projections, and associated uncertainties, for future SLR on the Severn Estuary in the south-west of the UK. Eleven experts from a range of policy and academic backgrounds took part in a structured probability elicitation exercise for the years 2050, 2100 and 2200. In addition to the quantitative elicitation, the experts鈥 reasoning during the task was qualitatively analysed. Quantitative analyses show that although there is consensus that sea levels will rise on the Estuary in future, there is wide variation between judgements and much uncertainty regarding the magnitude of future rise. For example, median estimates of SLR (compared to the 2011 level) range from 9.6 to 40 cm in the year 2050; 20 to 100 cm in 2100; and 35 to 300 cm in 2200. Fifty per cent confidence intervals and ninety per cent confidence intervals vary even more. Qualitative analyses indicate that experts鈥 judgements may have been influenced by their choice of methods and information sources, the ways in which they thought about the future, and heuristics. The study shows the merits of integrating qualitative and quantitative methods to explore the reasoning behind uncertainty judgements. We conclude that where expert probability judgements are to be used to characterise uncertainty such reasoning should be made explicit.
|
| [22] |
New York City panel on climate change. New York City panel on climate change |
| [23] |
An expert judgement assessment of future sea level rise from the ice sheets [J].
A major gap in predictive capability concerning the future evolution of the ice sheets was identified in the Fourth Assessment Report (AR4) of the Intergovernmental Panel on Climate Change. As a consequence, it has been suggested that the AR4 estimates of future sea-level rise from this source may have been underestimated. Various approaches for addressing this problem have been tried, including semi-empirical models and conceptual studies. Here, we report a formalized pooling of expert views on uncertainties in future ice-sheet contributions using a structured elicitation approach. We find that the median estimate of such contributions is 29 cm-substantially larger than in the AR4-while the upper 95th percentile value is 84 cm, implying a conceivable risk of a sea-level rise of greater than a metre by 2100. On the critical question of whether recent ice-sheet behaviour is due to variability in the ice sheet-climate system or reflects a long-term trend, expert opinion is shown to be both very uncertain and undecided.
|
| [24] |
Research and prediction of the trend of relative sea level change in Shanghai area in 2030 and forecast the progress of [J].2030年上海地区相对海平面变化趋势的研究和预测 [J].
从全球气候变化区域响应角度,依据1912—2000年吴淞验潮站年平均潮位资料,构建灰色线性回归组合模型,并将其与最小二乘法和小波变换相结合,分析以吴淞为代表的上海绝对海平面长期变化趋势和周期变化规律。由此预测2030年上海绝对海平面相对2011年的上升值为4 cm,结合已公布的构造沉降和城市地面沉降、流域水土保持和大型水利工程及人工挖沙导致的河口河槽冲刷、河口围海造地和深水航道及跨江跨海大桥导致水位抬升等叠加效应及其变化趋势,预测2030年上海市相对海平面上升10~16 cm,陆地海平面上升有7个风险分区。
|
| [25] |
A probabilistic approach to 21st century regional sea-level projections using RCP and high-end scenarios [J].
61We construct regional sea-level projections for three climate change scenarios61Projections are derived using a probabilistic method61Bulk of global oceans display close to global average projected sea level (± 5cm)61Pattern of projected sea-level for High-end scenario deviates from RCP scenarios due to the elevated contribution from Antarctic ice sheet61Methodological choices affect projections at cm-scale for ocean volume and up to 10′s of cm for land-ice melt by 2100.
|
| [26] |
Assessing New Jersey’s Exposure to Sea-Level Rise and Coastal Storms: Report of the New Jersey Climate Adaptation Alliance Science and Technical Advisory Panel[R]. |
| [27] |
O’Neel S. Kinematic constraints on glacier contributions to 21st-century sea-level rise [J]. |
| [28] |
Global sea level rise scenarios for the US National Climate Assessment[R].US Department of Commerce, National Oceanic and Atmospheric Administration, Oceanic and Atmospheric Research, |
| [29] |
A reconciled estimate of ice-sheet mass balance [J]. |
| [30] |
Sustained mass loss of the northeast Greenland ice sheet triggered by regional warming [J].
The Greenland ice sheet has been one of the largest contributors to global sea-level rise over the past 20 years, accounting for 0.5 mm yr0903’1 of a total of 3.2 mm yr0903’1. A significant portion of this contribution is associated with the speed-up of an increased number of glaciers in southeast and northwest Greenland. Here, we show that the northeast Greenland ice stream, which extends more than 600 km into the interior of the ice sheet, is now undergoing sustained dynamic thinning, linked to regional warming, after more than a quarter of a century of stability. This sector of the Greenland ice sheet is of particular interest, because the drainage basin area covers 16% of the ice sheet (twice that of Jakobshavn Isbr0107) and numerical model predictions suggest no significant mass loss for this sector, leading to an under-estimation of future global sea-level rise. The geometry of the bedrock and monotonic trend in glacier speed-up and mass loss suggests that dynamic drawdown of ice in this region will continue in the near future.
|
| [31] |
Comment on ‘Mass gains of the Antarctic ice sheet exceed losses’ by HJ Zwally and others [J].
****
|
| [32] |
Surface mass balance contributions to acceleration of Antarctic ice mass loss during 2003-2013 [J].
Abstract Recent observations from satellite gravimetry (the Gravity Recovery and Climate Experiment (GRACE) mission) suggest an acceleration of ice mass loss from the Antarctic Ice Sheet (AIS). The contribution of surface mass balance changes (due to variable precipitation) is compared with GRACE-derived mass loss acceleration by assessing the estimated contribution of snow mass from meteorological reanalysis data. We find that over much of the continent, the acceleration can be explained by precipitation anomalies. However, on the Antarctic Peninsula and other parts of West Antarctica, mass changes are not explained by precipitation and are likely associated with ice discharge rate increases. The total apparent GRACE acceleration over all of the AIS between 2003 and 2013 is 09080813.609000900±0900097.2090009Gt/yr2. Of this total, we find that the surface mass balance component is 0908088.209000900±0900092.0090009Gt/yr2. However, the GRACE estimate appears to contain errors arising from the atmospheric pressure fields used to remove air mass effects. The estimated acceleration error from this effect is about 9.809000900±0900095.8090009Gt/yr2. Correcting for this yields an ice discharge acceleration of 09080815.109000900±0900096.5090009Gt/yr2.
|
| [33] |
Spatial and temporal Antarctic Ice Sheet mass trends, glacio-isostatic adjustment, and surface processes from a joint inversion of satellite altime-ter, gravity, and GPS data [J].
Abstract We present spatiotemporal mass balance trends for the Antarctic Ice Sheet from a0002statistical inversion of satellite altimetry, gravimetry, and elastic-corrected GPS data for the period 2003-2013. Our method simultaneously determines annual trends in ice dynamics, surface mass balance0002anomalies, and a time-invariant solution for glacio-isostatic adjustment while remaining largely independent of forward models. We establish that over the period 2003-2013, Antarctica has been losing mass at a rate of -84 00± 220002Gt0002yr -1 , with a sustained negative mean trend of dynamic imbalance of -111 00± 130002Gt0002yr -1 . West Antarctica is the largest contributor with -112 00± 100002Gt0002yr -1 , mainly triggered by high thinning rates of glaciers draining into the Amundsen Sea Embayment. The Antarctic Peninsula has experienced a dramatic increase in mass loss in the last decade, with a mean rate of -28 00± 70002Gt0002yr -1 and significantly higher values for the most recent years following the destabilization of the Southern Antarctic Peninsula around 2010. The total mass loss is partly compensated by a significant mass gain of 56 00± 180002Gt0002yr -1 in East Antarctica due to a positive trend of surface mass balance anomalies.
|
| [34] |
Marine ice sheet collapse potentially under way for the Thwaites Glacier Basin, West Antarctica [J].
Resting atop a deep marine basin, the West Antarctic Ice Sheet has long been considered prone to instability. Using a numerical model, we investigated the sensitivity of Thwaites Glacier to ocean melt and whether its unstable retreat is already under way. Our model reproduces observed losses when forced with ocean melt comparable to estimates. Simulated losses are moderate (<0.25 mm per year at sea level) over the 21st century but generally increase thereafter. Except possibly for the lowest-melt scenario, the simulations indicate that early-stage collapse has begun. Less certain is the time scale, with the onset of rapid (>1 mm per year of sea-level rise) collapse in the different simulations within the range of 200 to 900 years.
|
| [35] |
Widespread, rapid grounding line retreat of Pine Island, Thwaites, Smith, and Kohler glaciers, West Antarctica, from 1992 to 2011 [J].
We measure the grounding line retreat of glaciers draining the Amundsen Sea Embayment of West Antarctica using Earth Remote Sensing (ERS-1/2) satellite radar interferometry from 1992 to 2011. Pine Island Glacier retreated 3165km at its center, with most retreat in 2005–2009 when the glacier un-grounded from its ice plain. Thwaites Glacier retreated 1465km along its fast-flow core and 1 to 965km along the sides. Haynes Glacier retreated 1065km along its flanks. Smith/Kohler glaciers retreated the most, 3565km along its ice plain, and its ice shelf pinning points are vanishing. These...
|
| [36] |
The darkening of the Greenland ice sheet: Trends, drivers, and projections (1981-2100) [J].
The surface energy balance and meltwater production of the Greenland ice sheet (GrIS) are modulated by snow and ice albedo through the amount of absorbed solar radiation. Here we show, using spaceborne multispectral data collected during the three decades from 1981 to 2012, that summertime surface albedo over the GrIS decreased at a statistically significant (99 %) rate of 0.02 decadebetween 1996 and 2012. The negative trend is confined to the regions of the GrIS that undergo melting in summer with the dry-snow zone showing no trend. The period 1981-1996 showed no statistically significant trend. The analysis of the outputs of a regional climate model indicates that the drivers of the observed albedo decrease is imputable to a combination of increased near-surface temperatures, which enhanced melt and promoted growth in snow grain size and the expansion of bare ice areas, as well as by trends in light-absorbing impurities on the snow and ice surfaces. Neither aerosol models nor in situ observations indicate increasing trends in impurities in the atmosphere over Greenland, suggesting that their apparent increase in snow and ice might be related to the exposure of a "dark band" of dirty ice and to the consolidation of impurities at the surface with melt. Albedo projections through the end of the century under different warming scenarios consistently point to continued darkening, with albedo anomalies in 2100 averaged over the whole ice sheet lower than in 2000 by 0.08, driven solely by a warming climate. Future darkening is likely underestimated because of known underestimates in projected melting and because the model albedo scheme does not currently include light-absorbing impurities and the effect of biological activity, which themselves have a positive feedback, leading to increased melting, grain growth and darkening.
|
| [37] |
A geological perspective on sea-level rise and its impacts along the US mid-Atlantic coast [J].
We evaluate paleo-, historical, and future sea-level rise along the U.S. mid-Atlantic coast. The rate of relative sea-level rise in New Jersey decreased from 3.5 ± 1.0 mm/yr at 7.5-6.5 ka, to 2.2 ± 0.8 mm/yr at 5.5-4.5 ka to a minimum of 0.9 ± 0.4 mm/yr at 3.3-2.3 ka. Relative sea level rose at a rate of 1.6 ± 0.1 mm/yr from 2.2 to 1.2 ka (750 Common Era [CE]) and 1.4 ± 0.1 mm/yr from 800 to 1800 CE. Geological and tide-gauge data show that sea-level rise was more rapid throughout the region since the Industrial Revolution (19th century = 2.7 ± 0.4 mm/yr; 20th century = 3.8 ± 0.2 mm/yr). There is a 95% probability that the 20th century rate of sea-level rise was faster than it was in any century in the last 4.3 kyr. These records reflect global rise (001.7 ± 0.2 mm/yr since 1880 CE) and subsidence from glacio-isostatic adjustment (001.3 ± 0.4 mm/yr) at bedrock locations (e.g., New York City). At coastal plain locations, the rate of rise is 0.3-1.3 mm/yr higher due to groundwater withdrawal and compaction. We construct 21st century relative sea-level rise scenarios including global, regional, and local processes. We project a 22 cm rise at bedrock locations by 2030 (central scenario; low- and high-end scenarios range of 16-38 cm), 40 cm by 2050 (range 28-65 cm), and 96 cm by 2100 (range 66-168 cm), with coastal plain locations having higher rises (3, 5-6, and 10-12 cm higher, respectively). By 2050 CE in the central scenario, a storm with a 10 year recurrence interval will exceed all historic storms at Atlantic City.
|
| [38] |
Probabilistic 21st and 22nd century sea-level projections at a global network of tide-gauge sites [J].DOI URL [本文引用: 10] 摘要
Abstract Sea-level rise due to both climate change and non-climatic factors threatens coastal settlements, infrastructure, and ecosystems. Projections of mean global sea-level (GSL) rise provide insufficient information to plan adaptive responses; local decisions require local projections that accommodate different risk tolerances and time frames and that can be linked to storm surge projections. Here we present a global set of local sea-level (LSL) projections to inform decisions on timescales ranging from the coming decades through the 22nd century. We provide complete probability distributions, informed by a combination of expert community assessment, expert elicitation, and process modeling. Between the years 2000 and 2100, we project a very likely (90% probability) GSL rise of 0.5–1.265m under representative concentration pathway (RCP) 8.5, 0.4–0.965m under RCP 4.5, and 0.3–0.865m under RCP 2.6. Site-to-site differences in LSL projections are due to varying non-climatic background uplift or subsidence, oceanographic effects, and spatially variable responses of the geoid and the lithosphere to shrinking land ice. The Antarctic ice sheet (AIS) constitutes a growing share of variance in GSL and LSL projections. In the global average and at many locations, it is the dominant source of variance in late 21st century projections, though at some sites oceanographic processes contribute the largest share throughout the century. LSL rise dramatically reshapes flood risk, greatly increasing the expected number of “1-in-10” and “1-in-100” year events.
|
| [39] |
Toward a physically plausible upper bound of sea-level rise projections [J].
Anthropogenic sea-level rise (SLR) causes considerable risks. Designing a sound SLR risk-management strategy requires careful consideration of decision-relevant uncertainties such as the reasonable upper bound of future SLR. The recent Intergovernmental Panel on Climate Change ’s ( IPCC ) Fourth Assessment reported a likely upper SLR bound in the year 2100 near 0.602m (meter). More recent studies considering semi-empirical modeling approaches and kinematic constraints on glacial melting suggest a reasonable 2100 SLR upper bound of approximately 202m. These recent studies have broken important new ground, but they largely neglect uncertainties surrounding thermal expansion (thermosteric SLR) and/or observational constraints on ocean heat uptake. Here we quantify the effects of key parametric uncertainties and observational constraints on thermosteric SLR projections using an Earth system model with a dynamic three-dimensional ocean, which provides a mechanistic representation of deep ocean processes and heat uptake. Considering these effects nearly doubles the contribution of thermosteric SLR compared to previous estimates and increases the reasonable upper bound of 2100 SLR projections by 0.2502m. As an illustrative example of the effect of overconfidence, we show how neglecting thermosteric uncertainty in projections of the SLR upper bound can considerably bias risk analysis and hence the design of adaptation strategies. For conditions close to the Port of Los Angeles, the 0.2502m increase in the reasonable upper bound can result in a flooding-risk increase by roughly three orders of magnitude. Results provide evidence that relatively minor underestimation of the upper bound of projected SLR can lead to major downward biases of future flooding risks.
|
| [40] |
An expert judgement assessment of future sea level rise from the ice sheets [J].
A major gap in predictive capability concerning the future evolution of the ice sheets was identified in the Fourth Assessment Report (AR4) of the Intergovernmental Panel on Climate Change. As a consequence, it has been suggested that the AR4 estimates of future sea-level rise from this source may have been underestimated. Various approaches for addressing this problem have been tried, including semi-empirical models and conceptual studies. Here, we report a formalized pooling of expert views on uncertainties in future ice-sheet contributions using a structured elicitation approach. We find that the median estimate of such contributions is 29 cm-substantially larger than in the AR4-while the upper 95th percentile value is 84 cm, implying a conceivable risk of a sea-level rise of greater than a metre by 2100. On the critical question of whether recent ice-sheet behaviour is due to variability in the ice sheet-climate system or reflects a long-term trend, expert opinion is shown to be both very uncertain and undecided.
|
| [41] |
Riva R E M, et al. Sea level rise projections for northern Europe under RCP8. 5 [J].
We calculate regional projections of 21st century sea level rise in Northern Europe, focusing on the British Isles, the Baltic, and the North Sea. The input to the regional sea level projection is a probabilistic projection of the major components global sea level budget. Local sea level rise is partly compensated by vertical land movement from glacial isostatic adjustment. We explore the uncertainties beyond the likely range provided by IPCC, including the risk and potential rate of marine ice sheet collapse.
|
| [42] |
A geological perspective on potential future sea-level rise [J].
During ice-age cycles, continental ice volume kept pace with slow, multi-millennial scale, changes in climate forcing. Today, rapid greenhouse gas (GHG) increases have outpaced ice-volume responses, likely committing us to > 961m of long-term sea-level rise (SLR). We portray a context of naturally precedented SLR from geological evidence, for comparison with historical observations and future projections. This context supports SLR of up to 0.9 (1.8) m by 2100 and 2.7 (5.0) m by 2200, relative to 2000, at 68% (95%) probability. Historical SLR observations and glaciological assessments track the upper 68% limit. Hence, modern change is rapid by past interglacial standards but within the range of 'normal' processes. The upper 95% limit offers a useful low probability/high risk value. Exceedance would require conditions without natural interglacial precedents, such as catastrophic ice-sheet collapse, or activation of major East Antarctic mass loss at sustained levels above 100061ppmv.
|
| [43] |
Upper limit for sea level projections by 2100 [J].
We construct the probability density function of global sea level at 2100, estimating that sea level rises larger than 180 cm are less than 5% probable. An upper limit for global sea level rise of 190 cm is assembled by summing the highest estimates of individual sea level rise components simulated by process based models with the RCP8.5 scenario. The agreement between the methods may suggest more confidence than is warranted since large uncertainties remain due to the lack of scenario-dependent projections from ice sheet dynamical models, particularly for mass loss from marine-based fast flowing outlet glaciers in Antarctica. This leads to an intrinsically hard to quantify fat tail in the probability distribution for global mean sea level rise. Thus our low probability upper limit of sea level projections cannot be considered definitive. Nevertheless, our upper limit of 180 cm for sea level rise by 2100 is based on both expert opinion and process studies and hence indicates that other lines of evidence are needed to justify a larger sea level rise this century.
|
| [44] |
A probabilistic approach to 21st century regional sea-level projections using RCP and High-end scenarios [J].
61We construct regional sea-level projections for three climate change scenarios61Projections are derived using a probabilistic method61Bulk of global oceans display close to global average projected sea level (± 5cm)61Pattern of projected sea-level for High-end scenario deviates from RCP scenarios due to the elevated contribution from Antarctic ice sheet61Methodological choices affect projections at cm-scale for ocean volume and up to 10′s of cm for land-ice melt by 2100.
|
| [45] |
The 2011 La Niña: So strong, the oceans fell [J].
Global mean sea level (GMSL) dropped by 5 mm between the beginning of 2010 and mid 2011. This drop occurred despite the background rate of rise, 3 mm per year, which dominates most of the 18-year record observed by satellite altimeters. Using a combination of satellite and in situ data, we show that the decline in ocean mass, which explains the sea level drop, coincides with an equivalent increase in terrestrial water storage, primarily over Australia, northern South America, and Southeast Asia. This temporary shift of water from the ocean to land is closely related to the transition from El Ni帽o conditions in 2009/10 to a strong 2010/11 La Ni帽a, which affected precipitation patterns world-wide.
|
| [46] |
Australia’s unique influence on global sea level in 2010-2011 [J].
In 2011, a significant drop in global sea level occurred that was unprecedented in the altimeter era and concurrent with an exceptionally strong La Nina. This analysis examines multiple data sets in exploring the physical basis for the drop's exceptional intensity and persistence. Australia's hydrologic surface mass anomaly is shown to have been a dominant contributor to the 2011 global total, and associated precipitation anomalies were among the highest on record. The persistence of Australia's mass anomaly is attributed to the continent's unique surface hydrology, which includes expansive arheic and endorheic basins that impede runoff to ocean. Based on Australia's key role, attribution of sea level variability is addressed. The modulating influences of the Indian Ocean Dipole and Southern Annular Mode on La Nina teleconnections are found to be key drivers of anomalous precipitation in the continent's interior and the associated surface mass and sea level responses.
|
| [47] |
The rate of sea-level rise [J].
Present-day sea-level rise is a major indicator of climate change(1). Since the early 1990s, sea level rose at a mean rate of similar to 3.1 mm yr(-1) (refs 2,3). However, over the last decade a slowdown of this rate, of about 30%, has been recorded(4-8). It coincides with a plateau in Earth's mean surface temperature evolution, known as the recent pause in warming(1,9-12). Here we present an analysis based on sea-level data from the altimetry record of the past similar to 20 years that separates interannual natural variability in sea level from the longer-term change probably related to anthropogenic global warming. The most prominent signature in the global mean sea level interannual variability is caused by El Nino-Southern Oscillation, through its impact on the global water cycle(13-16). We find that when correcting for interannual variability, the past decade's slowdown of the global mean sea level disappears, leading to a similar rate of sea-level rise (of 3.3 +/- 0.4mm yr(-1)) during the first and second decade of the altimetry era. Our results confirm the need for quantifying and further removing from the climate records the short-term natural climate variability if one wants to extract the global warming signal(10).
|
| [48] |
. Projecting twenty-first century regional sea-level changes [J].
We present regional sea-level projections and associated uncertainty estimates for the end of the 21 st century. We show regional projections of sea-level change resulting from changing ocean circulation, increased heat uptake and atmospheric pressure in CMIP5 climate models. These are combined with model- and observation-based regional contributions of land ice, groundwater depletion and glacial isostatic adjustment, including gravitational effects due to mass redistribution. A moderate and a warmer climate change scenario are considered, yielding a global mean sea-level rise of 0.54 ±0.19 m and 0.71 ±0.28 m respectively (mean ±1 σ ). Regionally however, changes reach up to 30 % higher in coastal regions along the North Atlantic Ocean and along the Antarctic Circumpolar Current, and up to 20 % higher in the subtropical and equatorial regions, confirming patterns found in previous studies. Only 50 % of the global mean value is projected for the subpolar North Atlantic Ocean, the Arctic Ocean and off the western Antarctic coast. Uncertainty estimates for each component demonstrate that the land ice contribution dominates the total uncertainty.
|
| [49] |
Future sea level rise constrained by observations and long-term commitment [J].
Abstract Sea level has been steadily rising over the past century, predominantly due to anthropogenic climate change. The rate of sea level rise will keep increasing with continued global warming, and, even if temperatures are stabilized through the phasing out of greenhouse gas emissions, sea level is still expected to rise for centuries. This will affect coastal areas worldwide, and robust projections are needed to assess mitigation options and guide adaptation measures. Here we combine the equilibrium response of the main sea level rise contributions with their last century's observed contribution to constrain projections of future sea level rise. Our model is calibrated to a set of observations for each contribution, and the observational and climate uncertainties are combined to produce uncertainty ranges for 21st century sea level rise. We project anthropogenic sea level rise of 28-56 cm, 37-77 cm, and 57-131 cm in 2100 for the greenhouse gas concentration scenarios RCP26, RCP45, and RCP85, respectively. Our uncertainty ranges for total sea level rise overlap with the process-based estimates of the Intergovernmental Panel on Climate Change. The "constrained extrapolation" approach generalizes earlier global semiempirical models and may therefore lead to a better understanding of the discrepancies with process-based projections.
|
| [50] |
Impacts of Antarctic fast dynamics on sea-level projections and coastal flood defense [J].
Abstract Strategies to manage the risks posed by future sea-level rise hinge on a sound characterization of the inherent uncertainties. One of the major uncertainties is the possible rapid disintegration of large fractions of the Antarctic ice sheet in response to rising global temperatures. This could potentially lead to several meters of sea-level rise during the next few centuries. Previous studies have typically been silent on two coupled questions: (i) What are probabilistic estimates of this “fast dynamic” contribution to sea-level rise? (ii) What are the implications for strategies to manage coastal flooding risks? Here, we present probabilistic hindcasts and projections of sea-level rise to 2100. The fast dynamic mechanism is approximated by a simple parameterization, designed to allow for a careful quantification of the uncertainty in its contribution to sea-level rise. We estimate that global temperature increases ranging from 1.9 to 3.1 °C coincide with fast Antarctic disintegration, and these contributions account for sea-level rise of 21–74 cm this century (5–95% range, Representative Concentration Pathway 8.5). We use a simple cost-benefit analysis of coastal defense to demonstrate in a didactic exercise how neglecting this mechanism and associated uncertainty can (i) lead to strategies which fall sizably short of protection targets and (ii) increase the expected net costs.
|
| [51] |
A high-end sea level rise probabilistic projection including rapid Antarctic ice sheet mass loss [J].
The potential for break-up of Antarctic ice shelves by hydrofracturing and following ice cliff instability might be important for future ice dynamics. One recent study suggests that the Antarctic ice sheet could lose a lot more mass during the 21st century than previously thought. This increased mass-loss is found to strongly depend on the emission scenario and thereby on global temperature change. We investigate the impact of this new information on high-end global sea level rise projections by developing a probabilistic process-based method. It is shown that uncertainties in the projections increase when including the temperature dependence of Antarctic mass loss and the uncertainty in the Coupled Model Intercomparison Project Phase 5 (CMIP5) model ensemble. Including these new uncertainties we provide probability density functions for the high-end distribution of total global mean sea level in 2100 conditional on emission scenario. These projections provide a probabilistic context to previous extreme sea level scenarios developed for adaptation purposes.
|
| [52] |
The multimillennial sea-level commitment of global warming [J]. |
| [53] |
Ice-sheet collapse and sea-level rise at the Bolling warming 14,600 years ago [J]. |
| [54] |
Estimates of the regional distribution of sea level rise over the 1950-2000 period [J]. |
| [55] |
Sea level variability and change [in “State of the Climate in 2015”] [J]. |
| [56] |
Holocene relative sea-level changes from near-, intermediate-, and far-field locations [J]. |
| [57] |
. Sinking deltas due to human activities [J].
Many of the world's largest deltas are densely populated and heavily farmed. Yet many of their inhabitants are becoming increasingly vulnerable to flooding and conversions of their land to open ocean. The vulnerability is a result of sediment compaction from the removal of oil, gas and water from the delta's underlying sediments, the trapping of sediment in reservoirs upstream and floodplain engineering in combination with rising global sea level. Here we present an assessment of 33 deltas chosen to represent the world's deltas. We find that in the past decade, 85% of the deltas experienced severe flooding, resulting in the temporary submergence of 260,000 km2. We conservatively estimate that the delta surface area vulnerable to flooding could increase by 50% under the current projected values for sea-level rise in the twenty-first century. This figure could increase if the capture of sediment upstream persists and continues to prevent the growth and buffering of the deltas
|
| [58] |
Land Subsidence in the United States[R]. Leicester, Virginia: US Geological Survey .
|
| [59] |
Observation of glacial isostatic adjustment in “stable” North America with GPS [J].
|
| [60] |
Chesapeake Bay land subsidence and sea level change[R]∥An Evaluation of Past and Present Trends and Future Outlook Special Report No. 425 in Applied Marine Science and Ocean Engineering .
|
| [61] |
Land Subsidence and Relative Sea-level Rise in the Southern Chesapeake Bay Region[R]. Leicester,
|
| [62] |
Reevaluation of the viscoelastic and elastic responses to the past and present-day ice changes in Southeast Alaska [J].
We have reevaluated the viscoelastic and elastic responses to the past and present-day ice changes in Southeast Alaska (SE-AK) based on a GPS data set by combining the data previously published in 2005 with additional uplift rates compiled recently. There are 22 new GPS sites, yielding a total of 91 sites. The mean observation epoch of the data sets is the middle of 2003. Here we considered three ice unloading effects due to the last glacial maximum (LGM), the Little Ice Age (LIA) and the present-day ice melting (PDIM). We also examined the dependency of the estimated lithospheric thickness and the asthenospheric viscosity on PDIM models. For this test, two PDIM models were used: one is a model, called here the UAF05 ice model, whose mean epoch is the mid-1970s, and the other is a model, called here the UAF07 model, whose mean epoch is the mid-1980s. Statistical examinations of the misfits between observations and model predictions indicate that UAF07 gives much more consistent results than UAF05, based on the magnitude of the minimum χ 2 and the agreement of the residual distribution with a Gaussian function. We have tested two different kinds of mantle viscosity structure: a 2-layer model similar to the model used the paper previously published in 2005 and a 4-layer model. For the 2-layer model, at the 95% confidence level, the optimum values for the lithospheric thickness and the asthenospheric viscosity (with a thickness of 110 km) are 54 (45–65) km and 5.58 (4.0–12.0) in unit of 10 18 Pa s, respectively. On the other hand, for the 4-layer model, the best values were 60 (42–63) km and 10.0 (3.0–13) in unit of 10 18 Pa s, respectively. The comparison between the analysis results for GPS data and the model computations indicates that the observations detect not only the uplift rates in SE-AK but also their time variations which are considered to be due to the glacier changes after the 1990s.
|
| [63] |
Regional Sea Level Scenarios for Coastal Risk Management: Managing the Uncertainty of Future Sea Level Change and Extreme Water Levels for Department of Defense Coastal Sites Worldwide[R]. U.S. Department of Defense, |
| [64] |
A scaling approach to project regional sea level rise and its uncertainties [J].
Climate change causes global mean sea level to rise due to thermal expansion of seawater and loss of land ice from mountain glaciers, ice caps and ice sheets. Locally, sea level can strongly deviate from the global mean rise due to changes in wind and ocean currents. In addition, gravitational adjustments redistribute seawater away from shrinking ice masses. However, the land ice contribution to sea level rise (SLR) remains very challenging to model, and comprehensive regional sea level projections, which include appropriate gravitational adjustments, are still a nascent field (Katsman et al., 2011; Slangen et al., 2011). Here, we present an alternative approach to derive regional sea level changes for a range of emission and land ice melt scenarios, combining probabilistic forecasts of a simple climate model (MAGICC6) with the new CMIP5 general circulation models. <br><br> The contribution from ice sheets varies considerably depending on the assumptions for the ice sheet projections, and thus represents sizeable uncertainties for future sea level rise. However, several consistent and robust patterns emerge from our analysis: at low latitudes, especially in the Indian Ocean and Western Pacific, sea level will likely rise more than the global mean (mostly by 10???20%). Around the northeastern Atlantic and the northeastern Pacific coasts, sea level will rise less than the global average or, in some rare cases, even fall. In the northwestern Atlantic, along the American coast, a strong dynamic sea level rise is counteracted by gravitational depression due to Greenland ice melt; whether sea level will be above- or below-average will depend on the relative contribution of these two factors. Our regional sea level projections and the diagnosed uncertainties provide an improved basis for coastal impact analysis and infrastructure planning for adaptation to climate change.
|
| [65] |
Addressing ‘deep’ uncertainty over long-term climate in major infrastructure projects: Four innovations of the Thames Estuary 2100 Project [J].
Climate change brings new challenges for traditional environmental risk management, particularly for major infrastructure projects, where the decisions made today can have long-term implications. A major challenge is that projections of future climate are deeply uncertain. If this uncertainty is not managed appropriately, long-lived infrastructure may need to be replaced or expensively retrofitted before the end of the design lifetime. The Thames Estuary 2100 Project (TE2100) was one of the first major infrastructure projects to explicitly recognise and address the issue of the deep uncertainty in climate projections throughout the planning process. In this paper, we discuss the innovations and techniques that were adopted in this case that enabled it to cope with this uncertainty. We classify the overall approach as ‘dynamic robustness’, which aims to build flexible strategies that can be changed over time as more is learnt or as conditions change. The project combined four key innovations: (1) the ‘decision-centric’ process; (2) the combination of numerical models and expert judgement to develop narrative sea level rise scenarios; (3) the adoption of an ‘Adaptation Pathways’ approach to identify the timing and sequencing of possible ‘pathways’ of adaptation measures over time under different scenarios; and (4) the development of a monitoring framework that triggers defined decision points. A secondary focus of this paper is an exploration of how climate information was used in TE2100. We suggest that the techniques employed in TE2100 imply different needs from climate science that may cause them to redefine their research priorities related to adaptation; namely a shift in emphasis away from probabilistic modelling, toward greater investment in observations and monitoring; improved understanding of historical climate variability; and improved understanding of physical Earth system processes and their representation in models to enhance ‘best guess’ models and to better bound future projections using narrative scenarios.
|
| [66] |
How do You Adapt in an Uncertain World? Lessons from the Thames Estuary 2100 Project[R/OL] . |
| [67] |
Bounding probabilistic sea-level projections within the framework of the possibility theory [J].
Despite progresses in climate change science, projections of future sea-level rise remain highly uncertain, especially due to large unknowns in the melting processes affecting the ice-sheets in Greenland and Antarctica. Based on climate-models outcomes and the expertise of scientists concerned with these issues, the IPCC provided constraints to the quantiles of sea-level projections. Moreover, additional physical limits to future sea-level rise have been established, although approximately. However, many probability functions can comply with this imprecise knowledge. In this contribution, we provide a framework based on extra-probabilistic theories (namely the possibility theory) to model the uncertainties in sea-level rise projections by 2100 under the RCP 8.5 scenario. The results provide a concise representation of uncertainties in future sea-level rise and of their intrinsically imprecise nature, including a maximum bound of the total uncertainty. Today, coastal impact studies are increasingly moving away from deterministic sea-level projections, which underestimate the expectancy of damages and adaptation needs compared to probabilistic laws. However, we show that the probability functions used so-far have only explored a rather conservative subset of sea-level projections compliant with the IPCC. As a consequence, coastal impact studies relying on these probabilistic sea-level projections are expected to underestimate the possibility of large damages and adaptation needs.
|
| [68] |
Sea-level rise by 2100 [J].
Not Available
|
| [69] |
|
| [70] |
Coastal Sensitivity to Sea-level Rise: A Focus on the Mid-Atlantic Region[R]. Washington, |
| [71] |
Global Risk Governance: Concept and Practice using the IRGC Framework [M]. |
| [72] |
Modelling sea level rise impacts on storm surges along US coasts [J]. |
| [73] |
|
| [74] |
From the extreme to the mean: Acceleration and tipping points of coastal inundation from sea level rise [J].
Relative sea level rise (RSLR) has driven large increases in annual water level exceedances (duration and frequency) above minor (nuisance level) coastal flooding elevation thresholds established by the National Weather Service (NWS) at U.S. tide gauges over the last half-century. For threshold levels below 0.5 m above high tide, the rates of annual exceedances are accelerating along the U.S. East and Gulf Coasts, primarily from evolution of tidal water level distributions to higher elevations impinging on the flood threshold. These accelerations are quantified in terms of the local RSLR rate and tidal range through multiple regression analysis. Along the U.S. West Coast, annual exceedance rates are linearly increasing, complicated by sharp punctuations in RSLR anomalies during El Ni帽o Southern Oscillation (ENSO) phases, and we account for annual exceedance variability along the U.S. West and East Coasts from ENSO forcing. Projections of annual exceedances above local NWS nuisance levels at U.S. tide gauges are estimated by shifting probability estimates of daily maximum water levels over a contemporary 5-year period following probabilistic RSLR projections of Kopp et al. (2014) for representative concentration pathways (RCP) 2.6, 4.5, and 8.5. We suggest a tipping point for coastal inundation (30 days/per year with a threshold exceedance) based on the evolution of exceedance probabilities. Under forcing associated with the local-median projections of RSLR, the majority of locations surpass the tipping point over the next several decades regardless of specific RCP.
|
| [75] |
Encroaching tides: How Sea Level Rise and Tidal Flooding Threaten U.S. East and Gulf Coast Communities over the Next 30 Years[R]. |
| [76] |
Incorporating Sea Level Change in Civil Works Programs[R] . |
| [77] |
Dynamic adaptive policy pathways: A method for crafting robust decisions for a deeply uncertain world [J].
A new paradigm for planning under conditions of deep uncertainty has emerged in the literature. According to this paradigm, a planner should create a strategic vision of the future, commit to short-term actions, and establish a framework to guide future actions. A plan that embodies these ideas allows for its dynamic adaptation over time to meet changing circumstances. We propose a method for decisionmaking under uncertain global and regional changes called 'Dynamic Adaptive Policy Pathways'. We base our approach on two complementary approaches for designing adaptive plans: 'Adaptive Policymaking' and 'Adaptation Pathways'. Adaptive Policymaking is a theoretical approach describing a planning process with different types of actions (e.g. 'mitigating actions' and 'hedging actions') and signposts to monitor to see if adaptation is needed. In contrast, Adaptation Pathways provides an analytical approach for exploring and sequencing a set of possible actions based on alternative external developments over time. We illustrate the Dynamic Adaptive Policy Pathways approach by producing an adaptive plan for long-term water management of the Rhine Delta in the Netherlands that takes into account the deep uncertainties about the future arising from social, political, technological, economic, and climate changes. The results suggest that it is worthwhile to further test and use the approach. (C) 2012 Elsevier Ltd. All rights reserved.
|
| [78] |
Sources and implications of deep uncertainties surrounding sea-level projections [J].
Long-term flood risk management often relies on future sea-level projections. Projected uncertainty ranges are however widely divergent as a result of different methodological choices. The IPCC has condensed this deep uncertainty into a single uncertainty range covering 66% probability or more. Alternatively, structured expert judgment summarizes divergent expert opinions in a single distribution. Recently published uncertainty ranges that are derived from these ``consensus'' assessments appear to differ by up to a factor four. This might result in overconfidence or overinvestment in strategies to cope with sea-level change. Here we explore possible reasons for these different interpretations. This is important for (i) the design of robust strategies and (ii) the exploration of pathways that may eventually lead to some kind of consensus distributions that are relatively straightforward to interpret.
|
| [79] |
Sea-level projections representing the deeply uncertain contribution of the West Antarctic ice sheet [J].
Abstract There is a growing awareness that uncertainties surrounding future sea-level projections may be much larger than typically perceived. Recently published projections appear widely divergent and highly sensitive to non-trivial model choices . Moreover, the West Antarctic ice sheet (WAIS) may be much less stable than previous believed, enabling a rapid disintegration. Here, we present a set of probabilistic sea-level projections that approximates the deeply uncertain WAIS contributions. The projections aim to inform robust decisions by clarifying the sensitivity to non-trivial or controversial assumptions. We show that the deeply uncertain WAIS contribution can dominate other uncertainties within decades. These deep uncertainties call for the development of robust adaptive strategies. These decision-making needs, in turn, require mission-oriented basic science, for example about potential signposts and the maximum rate of WAIS-induced sea-level changes.
|
| [80] |
A survey of decision-making approaches for climate change adaptation: Are robust methods the way forward? [J].
Applying standard decision-making processes such as cost–benefit analysis in an area of high uncertainty such as climate change adaptation is challenging. While the costs of adaptation might be observable and immediate, the benefits are often uncertain. The limitations of traditional decision-making processes in the context of adaptation decisions are recognised, and so-called robust approaches are increasingly explored in the literature. Robust approaches select projects that meet their purpose across a variety of futures by integrating a wide range of climate scenarios, and are thus particularly suited for deep uncertainty. We review real option analysis, portfolio analysis, robust-decision making and no/low regret options as well as reduced decision-making time horizons, describing the underlying concepts and highlighting a number of applications. We discuss the limitations of robust decision-making processes to identify which ones may prove most promising as adaptation planning becomes increasingly critical; namely those that provide a compromise between a meaningful analysis and simple implementation. We introduce a simple framework identifying which method is suited for which application. We conclude that the ‘robust decision making’ method offers the most potential in adaptation appraisal as it can be applied with various degrees of complexity and to a wide range of options.
|
| [81] |
Decision analysis under deep uncertainty—Present situation and prospect [J].深度不确定环境下的决策分析方法——研究现状与展望 [J].
复杂、重大的决策活动经常会面临深度不确定的决策环境,其决策难度和风险远超一般不确定环境下的决策.自21世纪以来,对深度不确定环境下决策分析方法的研究已成为决策分析领域新的重要方向之一.对此,首先梳理了该领域的研究现状,总结了深度不确定环境下决策问题的特征和难点,分类阐述了4种主要方法的起源与发展、核心思想、实现步骤和典型应用;然后进行了案例分析;最后展望了该领域未来的研究方向.
|
| [82] |
|
| [83] |
Robust climate policies under uncertainty: A comparison of robust decision making and info-gap methods [J].
Abstract This study compares two widely used approaches for robustness analysis of decision problems: the info-gap method originally developed by Ben-Haim and the robust decision making (RDM) approach originally developed by Lempert, Popper, and Bankes. The study uses each approach to evaluate alternative paths for climate-altering greenhouse gas emissions given the potential for nonlinear threshold responses in the climate system, significant uncertainty about such a threshold response and a variety of other key parameters, as well as the ability to learn about any threshold responses over time. Info-gap and RDM share many similarities. Both represent uncertainty as sets of multiple plausible futures, and both seek to identify robust strategies whose performance is insensitive to uncertainties. Yet they also exhibit important differences, as they arrange their analyses in different orders, treat losses and gains in different ways, and take different approaches to imprecise probabilistic information. The study finds that the two approaches reach similar but not identical policy recommendations and that their differing attributes raise important questions about their appropriate roles in decision support applications. The comparison not only improves understanding of these specific methods, it also suggests some broader insights into robustness approaches and a framework for comparing them.
|
| [84] |
Managing Climate Risks in Developing Countries with Robust Decision Making World Resources Report Uncertainty Series[R] . |
| [85] |
Estimating Surge-Based Flood Risk with the Coastal Louisiana Risk Assessment Model [J].
The Coastal Louisiana Risk Assessment model (CLARA) was designed to facilitate comparisons of current and future flood risk under a variety of protection system configurations in a wide range of environmental, operational, and economic uncertainties. It builds on previous studies of coastal risk by incorporating system fragility and a larger number of future scenarios than previously analyzed. Flood depths and direct economic damage from a wide range of simulated storm events are aggregated to produce a statistical summary of coastal risk under different assumptions about future conditions. CLARA's estimates of project-level effects on flood risk reduction were used as one of the key decision drivers in selecting the risk reduction projects included in the Master Plan. Depending on the scenario, the final alternative is projected to reduce expected annual damage by approximately 60 to 80% during the next 50 years relative to a future without action and, at the same time, balance other decision criteria.
|
| [86] |
Louisiana’s comprehensive master plan for a sustainable coast: A response to Hurricanes Katrina and Rita in 2005 [C]// |
| [87] |
Investment Decision Making Under Deep Uncertainty-application to Climate Change[R]. Washington, |
| [88] |
Improving the contribution of climate model information to decision making: The value and demands of robust decision frameworks [J].
In this paper, we review the need for, use of, and demands on climate modeling to support so-called 090004robust090005 decision frameworks, in the context of improving the contribution of climate information to effective decision making. Such frameworks seek to identify policy vulnerabilities under deep uncertainty about the future and propose strategies for minimizing regret in the event of broken assumptions. We argue that currently there is a severe underutilization of climate models as tools for supporting decision making, and that this is slowing progress in developing informed adaptation and mitigation responses to climate change. This underutilization stems from two root causes, about which there is a growing body of literature: one, a widespread, but limiting, conception that the usefulness of climate models in planning begins and ends with regional-scale predictions of multidecadal climate change; two, the general failure so far to incorporate learning from the decision and social sciences into climate-related decision support in key sectors. We further argue that addressing these root causes will require expanding the conception of climate models; not simply as prediction machines within 090004predict-then-act090005 decision frameworks, but as scenario generators, sources of insight into complex system behavior, and aids to critical thinking within robust decision frameworks. Such a shift, however, would have implications for how users perceive and use information from climate models and, ultimately, the types of information they will demand from these models090000and thus for the types of simulations and numerical experiments that will have the most value for informing decision making. WIREs Clim Change 2013, 4:3909000960. doi: 10.1002/wcc.202For further resources related to this article, please visit the WIREs website.This article is a U.S. Government work, and as such, is in the public domain in the United States of America.
|
| [89] |
|

/
| 〈 |
|
〉 |

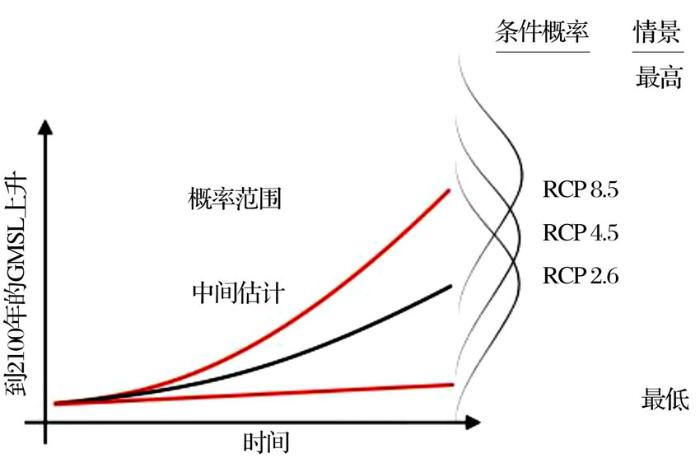