
孙志忠 , 马巍, 穆彦虎, 刘永智, 张淑娟, 王宏磊
中国科学院西北生态环境资源研究院冻土工程国家重点实验室,甘肃 兰州 730000
Sun Zhizhong, Ma Wei, Mu Yanhu, Liu Yongzhi, Zhang Shujuan, Wang Honglei
中图分类号: P642.14
文献标识码: A
文章编号: 1001-8166(2018)03-0248-09
收稿日期: 2017-12-11
修回日期: 2018-02-6
网络出版日期: 2018-03-20
版权声明: 2018 地球科学进展 编辑部
基金资助:
作者简介:
First author:Sun Zhizhong(1974-), male, Qingyuan County, Liaoning Province, Associate professor. Research areas include environment and engineering in cold regions.E-mail:sun@lzb.ac.cn
作者简介:孙志忠(1974-),男,辽宁清原人,副研究员,主要从事寒区环境与冻土工程研究.E-mail:sun@lzb.ac.cn
展开
摘要
基于青藏铁路沿线30个天然场地2006—2015年地温观测资料,对多年冻土天然上限(以下称冻土上限)及其变化、不同深度冻土地温及其变化进行分析,研究了近期多年冻土时空变化特征。观测结果表明,冻土上限为0.88~9.14 m,平均为3.54 m。在冻土上限下降的场地中,冻土上限下降幅度为0.05~2.22 m,平均为0.51 m;冻土上限下降速率为0.01~0.25 m/a,平均为0.07 m/a。高温冻土区冻土上限下降幅度与下降速率分别大于低温冻土区的0.47 m与0.06 m/a。总体而言,冻土上限附近和15 m深度地温呈上升趋势。其中,冻土上限附近地温升温幅度为0.01~0.60 ℃,平均为0.16 ℃;冻土上限附近地温升温速率为0.001~0.067 ℃/a,平均为0.018 ℃/a。低温冻土区上限附近地温升温幅度与升温速率分别大于高温冻土区0.12 ℃和0.014 ℃/a。15 m深度地温升温幅度为0.01 ~0.48 ℃,平均为0.10 ℃,15 m深度地温升温速率为0.002~0.054 ℃/a,平均为0.011 ℃/a。低温冻土区15 m深度地温升温幅度和升温速率分别大于高温冻土区0.11 ℃和0.012 ℃/a。个别观测场地受局地因素影响,出现了冻土上限抬升和冻土地温下降的情形。
关键词:
Abstract
Permafrost changes under natural sites along the Qinghai-Tibet Railway were investigated based on the ground temperature monitored from the year of 2006 to 2015. Among these sites, mean permafrost table was 3.54 m, with a range of 0.88 to 9.14 m. Among the sites with decreasing permafrost table, mean decreasing amplitude of permafrost table was 0.51 m, with a range of 0.05 to 2.22 m; mean decreasing rate of permafrost table was 0.07 m/a, with a range of 0.01 to 0.25 m/a. Decreasing amplitude and decreasing rate of permafrost table in high temperature regions were 0.47 m and 0.06 m/a greater than those in low temperature regions, respectively. In general, ground temperatures at permafrost table and 15 m depth presented rising tendency. Mean rising amplitude of ground temperature at permafrost table was 0.16 ℃, with a range of 0.01 to 0.60 ℃; mean rising rate of ground temperature at permafrost table was 0.018 ℃/a, with a range of 0.001 to 0.067 ℃/a. Rising amplitude and rising rate of ground temperature at permafrost table in low temperature regions were 0.12 ℃ and 0.014 ℃/a greater than those in high temperature regions, respectively. Mean rising amplitude of ground temperature at 15 m depth was 0.10 ℃, with a range of 0.01 to 0.48 ℃; mean rising rate of ground temperature at 15 m depth was 0.011 ℃/a, with a range of 0.002 to 0.054 ℃/a. Rising amplitude and rising rate of ground temperature at 15 m depth in low temperature regions were 0.11 ℃ and 0.012 ℃/a greater than those in high temperature regions, respectively. Due to the effect of local factors, increasing of permafrost table and decreasing of ground temperature were observed under several sites.
Keywords:
温度在0 ℃或低于0 ℃至少连续存在2年的岩土层称为多年冻土[1]。青藏高原平均海拔4 500 m以上,素有“ 世界第三极” 之称,其多年冻土面积约为1.5×10⁶ km2,约占我国多年冻土面积的70%,是世界中、低纬度地区高海拔多年冻土的代表[2]。多年冻土是地气热量交换负积累所产生的一种特殊土体,温度的变化会对冻土内冰晶的状态和未冻水含量产生显著的影响,进而影响到冻土的物理力学性质。在气候变化与人类活动影响下,青藏高原多年冻土区域性退化显著,表现为活动层厚度增加、冻土上限下降、多年冻土厚度减薄、冻土升温以及多年冻土南北界移动等[3,4,5,6,7,8,9,10,11]。多年冻土退化过程中的冻土上限下降、地温升高等正在对青藏高原气候、寒区工程、水文水资源和生态环境产生显著影响[3,12]。 青藏铁路作为青藏高原工程走廊(包括公路、铁路、输油管线及输变线路等)内一项重要的工程,其沿线多年冻土也呈现出不同程度的退化特征。在气候变化影响下,1995—2007 年青藏公路沿线10个监测场地冻土上限平均下降 67 cm,平均下降速率为7.5 cm/a[13]。青藏公路沿线1996—2001年冻土上限附近温度升高了0.1~0.7 ℃[14]。近10年来多年冻土呈现出更明显的升温趋势, 冻土上限附近温度升温速率达 0.06 ℃/a[15]。由于青藏公路沿线天然测温孔孔深较浅(最深6~8 m),所得结果还不能全面反映多年冻土变化。2006—2011年,青藏铁路沿线8个天然场地冻土上限平均下降速率为4.7 cm/a,15 m 深处地温平均升温率为0.018 ℃/a[16]。2006—2010年,青藏铁路沿线27个天然场地活动层厚度增加速率为6.3 cm/a,年平均地温增加速率为0.012 a/℃[17]。由于场地观测周期较短(5年左右),所得结果还存在一定的局限性。拟建中的青藏高速公路也将通过青藏高原多年冻土区,冻土问题依旧制约着公路的设计与施工[18]。天然状态下冻土变化主要受控于气候条件,局地因素如地形地貌、缓冲层与土层性质等均对冻土变化产生重要影响。多年冻土天然上限(以下称冻土上限)指天然条件下的多年冻土上界面,是多年冻土地区工程设计时需要的一个重要指标。随着青藏高原第二次科考的进行,多年冻土作为冰冻圈的重要因子[19],必将更加受到相关学者的关注。本文基于青藏铁路沿线30个天然场地2006—2015年的实测地温数据,对冻土上限埋深与深层地温的时空变化进行分析。研究结果对于判断多年冻土目前所处的状态及制定相应的寒区生态保护、工程设计和施工对策有着重要的现实意义。
为了研究多年冻土对气候变化和工程活动的响应,2005年在青藏铁路沿线共布设了44个观测断面(编号:P1~P44),其中30个断面布设了天然测温孔。天然测温孔距离路基坡脚20~30 m,由于青藏铁路建设过程中大力提倡环保理念,天然场地基本上未受到工程的扰动。天然场地分布于中高山区、高平原、盆地及河谷等地形地貌区,海拔在4 423~5 080 m之间。天然场地基本信息见表1。天然测温孔深度为15~40 m,大多数为18 m。天然测温孔大部分在0~2 m深度范围内分别在0,20,40,80,120,160和200 cm深度上布设了温度探头,2 m以下每隔0.5 m布设一个温度探头。温度探头采用冻土工程国家重点实验室研制的热敏电阻,其测量精度可达±0.05 ℃。采用澳大利亚DataTaker公司的DT500型自动数据采集仪记录及保存测温数据。数采仪放置在设备保护箱内。其中天然孔0~200 cm内的测温点采集频率为1次/小时,其他测温点均为1次/天。本文基于青藏铁路沿线30个天然场地2006—2015年的地温观测数据,对冻土上限变化和冻土地温变化进行了分析。在青藏铁路勘察、设计与施工中,以年平均地温-1.0 ℃作为高温与低温多年冻土的界限[20]。如此算来,30个观测场地中,9个场地位于低温多年冻土区,21个场地位于高温多年冻土区。
表1 青藏铁路沿线天然场地基本信息
Table 1 Basic information of natural sites along the Qinghai-Tibet Railway
| 编号 | 地名 | 经度(E) | 纬度(N) | 高程/m | 孔深/m | 冻土特征 | ||
|---|---|---|---|---|---|---|---|---|
| 冻土 类型 | 年平均 地温/℃ | 冻土 上限/m | ||||||
| P2 | 昆仑山 | 94°03.081' | 35°37.020' | 4 757 | 18 | D | -3.17 | 1.9 |
| P3 | 不冻泉 | 93°57.795' | 35°33.109' | 4 636 | 18 | D | -0.50 | 2.5 |
| P4 | 斜水河南 | 93°43.561' | 35°30.132' | 4 547 | 18 | F,D | -0.75 | 1.0 |
| P6 | 高平原区 | 93°26.776' | 35°21.839' | 4 507 | 40 | D,B,F | -1.50 | 2.9 |
| P7 | 高平原区 | 93°26.678' | 35°21.819' | 4 504 | 18 | D,B | -1.14 | 3.2 |
| P8 | 楚玛尔河南 | 93°13.308' | 35°16.648' | 4 589 | 18 | S,D | -0.50 | 5.0 |
| P10 | 五道梁盆地 | 93°06.678' | 35°12.258' | 4 613 | 15 | D,B,H | -1.70 | 1.8 |
| P12 | 可可西里 | 93°02.521' | 35°08.303' | 4 734 | 40 | D,F,H | -2.40 | 0.9 |
| P15 | 红梁河北 | 93°01.694' | 35°04.066' | 4 675 | 18 | D,F,H | -1.28 | 2.3 |
| P16 | 风火山南坡 | 92°53.914' | 34°40.346' | 4 894 | 20 | F,B,D | -2.00 | 1.7 |
| P17 | 二道沟 | 92°46.939' | 34°36.625' | 4 715 | 18 | B,D | -0.65 | 4.0 |
| P18 | 雅玛尔河 | 92°44.608' | 34°34.532' | 4 654 | 18 | F,D | -0.50 | 3.3 |
| P19 | 雅玛尔河 | 92°43.841' | 34°31.697' | 4 616 | 18 | D | -0.24 | 6.2 |
| P20 | 乌丽盆地 | 92°43.568' | 34°28.667' | 4 587 | 16 | F | -0.50 | 3.1 |
| P22 | 乌丽盆地 | 92°43.568' | 34°28.645' | 4 587 | 16 | F | -0.54 | 5.2 |
| P25 | 开心岭 | 92°20.386' | 34°00.675' | 4 672 | 18 | H,F,D | -0.74 | 2.4 |
| P27 | 开心岭 | 92°20.384' | 33°57.347' | 4 622 | 40 | F,H | -0.80 | 2.9 |
| P29 | 开心岭 | 92°20.369' | 33°55.842' | 4 622 | 20 | F | -0.80 | 3.4 |
| P30 | 布曲河阶地 | 92°14.064' | 33°46.399' | 4 640 | 40 | B,D | -0.46 | 2.7 |
| P31 | 布曲河阶地 | 92°12.272' | 33°45.699' | 4 647 | 18 | D,F | -0.05 | 8.0 |
| P32 | 100道班洼地 | 91°56.334' | 33°28.094' | 4 778 | 18 | D | -0.12 | 4.8 |
| P33 | 老温泉南部 | 91°56.752' | 33°23.874' | 4 817 | 18 | F,D | -0.40 | 3.4 |
| P34 | 七里河北侧 | 91°52.547' | 33°18.325' | 4 841 | 18 | F | 0.27 | 5.0 |
| P35 | 唐古拉北坡 | 91°48.292' | 33°05.315' | 4 948 | 18 | B,F,D | 0 | 4.5 |
| P36 | 唐古拉北坡 | 91°45.164' | 33°04.292' | 4 974 | 15 | B,F | -0.90 | 2.8 |
| P37 | 唐古拉山口 | 91°39.796' | 33°00.644' | 5 080 | 15 | B,F | -1.80 | 2.4 |
| P41 | 日阿纳藏布 | 91°32.040' | 32°30.465' | 4 868 | 20 | F,B | -0.27 | 5.0 |
| P42 | 安多谷地 | 91°36.849' | 32°24.164' | 4 897 | 16 | F | -0.22 | 3.4 |
| P43 | 安多谷地 | 91°37.222' | 32°23.687' | 4 887 | 18 | H,F,D | -0.20 | 3.5 |
| P44 | 安多谷地 | 91°34.884' | 32°18.565' | 4 807 | 15 | B,F | -0.12 | 2.4 |
冻土上限一般指土层的最大融化深度,即0 ℃等温线出现的最大深度,本文据实测的地温资料通过线性插值得到,青藏铁路沿线最大融化深度一般出现在9~10月,个别场地出现在12月。通过每个场地的冻土上限深度,再统计得到该处的地温年平均值。年平均地温是指地温年变化深度处的地温,反映了在一定地质、自然地理条件下多年冻土层的热量状况,是多年冻土分带和多年冻土工程分区的重要指标。青藏铁路沿线该深度一般为12~15 m,年平均地温为0~-3.17 ℃。因此,本文还统计得到15 m深度地温及其变化。
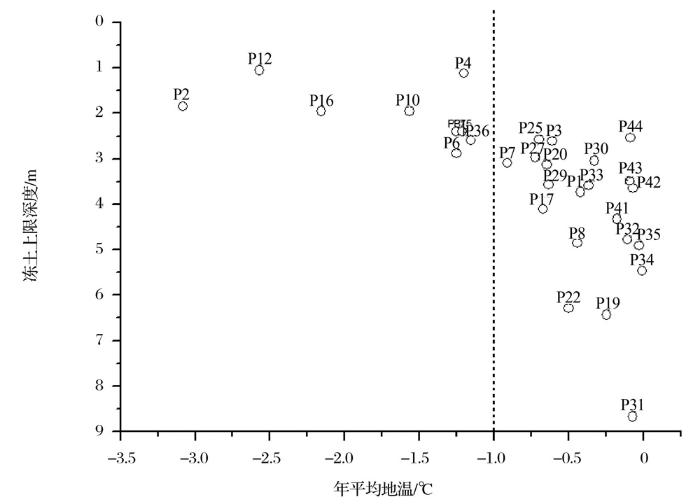
图1为观测场地不同年平均地温下冻土上限深度。从图1可以看出,在观测期内,青藏铁路沿线冻土上限为0.88 ~9.14 m,平均为3.54 m。高温冻土区冻土上限为2.32~9.14 m,平均为4.18 m。低温冻土区冻土上限为0.88~2.96 m,平均为2.03 m。高温冻土区冻土上限深度大于低温冻土区2.15 m。
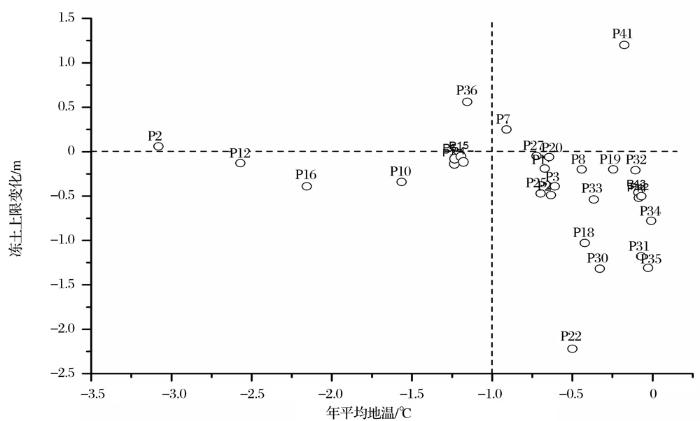
图2为不同年平均地温下冻土上限变化幅度, 纵坐标为正表示冻土上限上升,纵坐标为负表示冻土上限下降。从图2中可以看出,P2,P7,P36与P41这4处场地冻土上限呈上升趋势,尤其以P36与P41场地上升显著,冻土上限上升幅度分别为0.56与1.20 m。其余场地冻土上限均呈下降趋势,下降幅度为0.05~2.22 m,平均为0.51 m。低温冻土区冻土上限下降幅度为0.05 ~0.39 m,平均为0.17 m。高温冻土区冻土上限下降幅度为0.05~2.22 m,平均为0.64 m。高温冻土区冻土上限平均下降幅度大于低温冻土区0.47 m。在冻土上限下降的场地中,冻土上限下降速率为0.01~0.25 m/a,平均为0.07 m/a。低温冻土区冻土上限下降速率为0.01~0.04 m/a,平均为0.02 m/a。高温冻土区冻土上限下降速率为0.01~0.25 m/a,平均为0.08 m/a。高温冻土区冻土上限平均下降速率大于低温冻土区0.06 m/a。
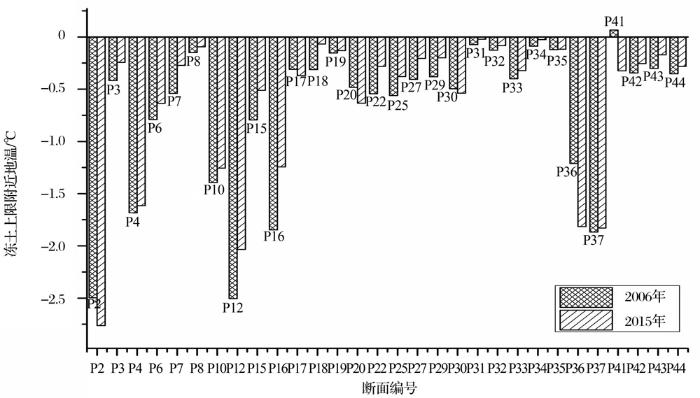
冻土上限随时间不断变化,本文中冻土上限附近地温取每个场地观测期内最深冻土上限附近的地温观测资料,并整理出该深度的地温年平均值。图3为观测场地冻土上限附近2006年与2015年地温年平均值。从图3可以看出,冻土上限附近地温为0.07 ~-2.76 ℃,平均为-0.66 ℃。低温冻土区冻土上限附近地温为-0.51 ~-2.76 ℃,平均为-1.57 ℃。高温冻土区冻土上限附近地温为0.07 ~-0.63 ℃,平均为-0.27 ℃。高温冻土区冻土上限附近地温平均值大于低温冻土区1.30 ℃。
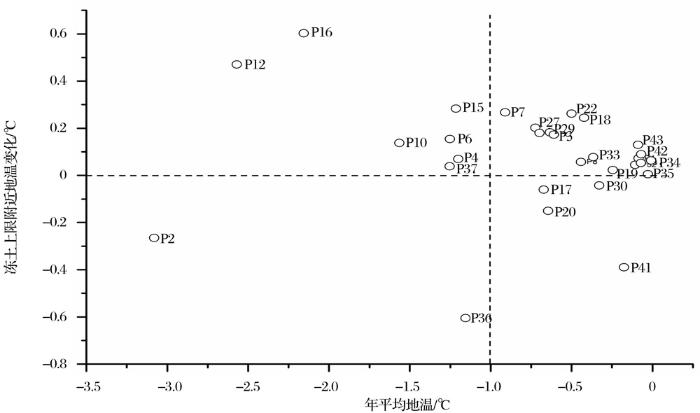
图4为观测场地冻土上限附近地温变化,纵坐标为正表示升温,为负表示降温。从图4可以看出,P2,P17,P20,P30,P36与 P41 6处场地冻土上限附近地温呈降低趋势,尤其以P36与P41场地降低趋势明显,降低幅度分别为0.61与0.39 ℃。其余场地冻土上限附近地温均呈升温趋势,升温幅度为0.01~0.60 ℃,平均为0.16 ℃。低温冻土区冻土上限附近地温升温幅度为0.04~0.60 ℃,平均为0.25 ℃。高温冻土区冻土上限附近地温升温幅度为0.01~0.27 ℃,平均为0.13 ℃。低温冻土区冻土上限附近地温升温幅度大于高温冻土区0.12 ℃。在冻土上限附近地温升温的场地中,冻土上限附近地温升温速率为0.001~0.067 ℃/a,平均为0.018 ℃/a。低温冻土区冻土上限附近地温升温速率为0.006~0.067 ℃/a,平均为0.028 ℃/a。高温冻土区冻土上限地温升温速率为0.001~0.030 ℃/a,平均为0.014 ℃/a。低温冻土区冻土上限附近地温升温速率大于高温冻土区0.014 ℃/a。
图3 观测场地冻土上限附近地温
Fig.3 Ground temperature at permafrost table under monitoring sites
图4 观测场地冻土上限附近地温变化
Fig.4 Change of ground temperature at permafrost table under monitoring sites
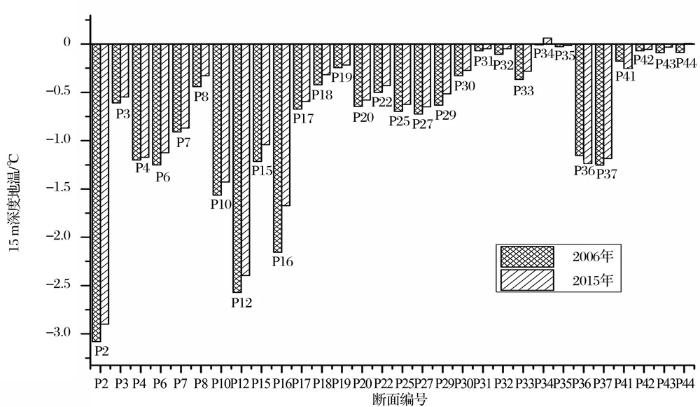
3.3 15 m深度地温及其变化
图5为观测场地15 m深度2006年与2015年地温年平均值。从图5可以看出,15 m深度地温为0.06~-3.08 ℃,平均为-0.73 ℃。高温冻土区15 m深度地温为0.06~-0.91 ℃,平均为-0.34 ℃。低温冻土区15m深度地温为-1.04~-3.08 ℃,平均为-1.64 ℃。高温冻土区15 m深度地温大于低温冻土区(1.30 ℃)。
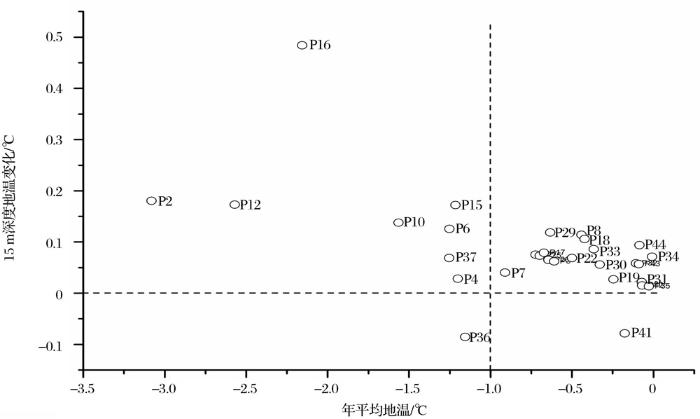
图6为观测场地15 m深度地温年平均值变化,纵坐标为正表示升温,为负表示降温。从图6可以看出,只有P36与 P41 2处场地15 m深度地温呈降低趋势,降低幅度分别为0.08与0.09 ℃。其余场地15 m深度地温均呈升温趋势,升温幅度为0.01~0.48 ℃,平均为0.10 ℃。低温冻土区15 m深度地温升温幅度为0.03 ~0.48 ℃,平均为0.17 ℃。高温冻土区15 m深度地温升温幅度为0.01~0.12 ℃,平均为0.06 ℃。低温冻土区15 m深度地温升温幅度大于高温冻土区0.11 ℃。在升温的场地中,15 m深度地温升温速率为0.002~0.054 ℃/a,平均为0.011 ℃/a。低温冻土区15 m深度地温升温速率为0.003 ~0.054 ℃/a,平均为0.019 ℃/a。高温冻土区15 m深度地温升温速率为0.002 ~0.013 ℃/a,平均为0.007 ℃/a。低温冻土区15 m深度地温升温速率大于高温冻土区0.012 ℃/a。
图6 观测场地15 m深度地温变化
Fig.6 Change of ground temperature at 15 m depth under monitoring sites
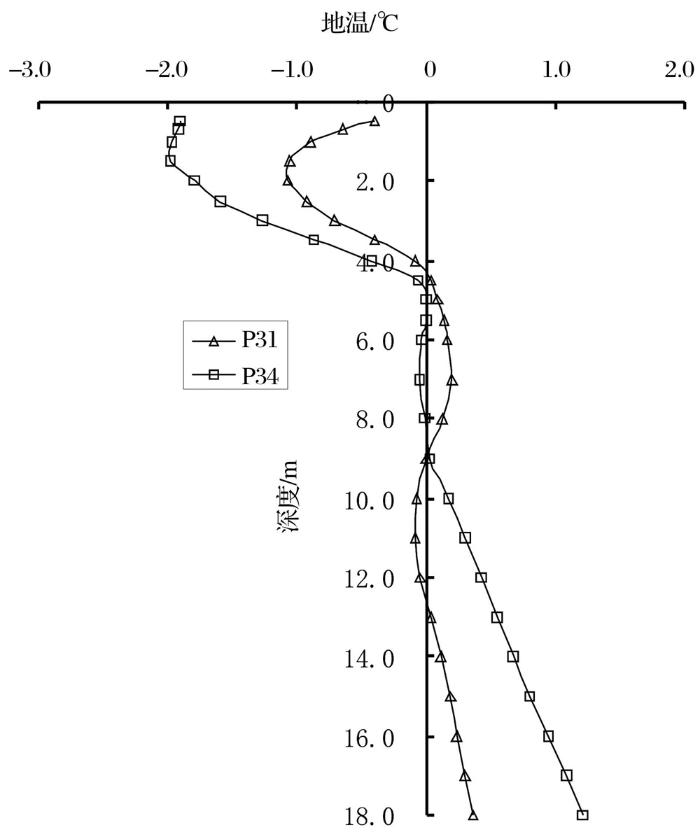
多年冻土是地气之间热质交换的产物。在气候变化的大背景下,基于 1971—2000年青藏高原 77个气象台站的观测数据结果,表明青藏高原近 30年气候变化的总体特征是气温呈上升趋势,降水呈增加趋势[21]。青藏铁路沿线气温呈现不同程度的升温,风火山地区 1957—2011 年的年平均气温升温幅度达 1.8 ℃[22],沿线五道梁、沱沱河与安多等3个国家气象站1970—2011年升温速率为0.24~0.42 ℃/10a[16],如此高的升温幅度与升温速率足以引起多年冻土升温,导致多年冻土退化,从而引起一系列的环境与工程问题。近40年来,沿线降水量在波动中增大,以风火山为例,该地区年降水量由1976—1980年的平均298 mm/a增大到了2006—2010 年的 426 mm/a,并且降水以固体形式为主,主要集中在5~10月,占全年总降水量的90%以上[23]。降水蒸发需消耗大量的热量,因此降水增加对土体温度升高有一定的减缓作用[11]。从本文的观测结果来看,青藏铁路沿线多年冻土总体上呈退化状态,应该是气温升高与降水量增加的综合影响的结果,但气温升高的影响程度要远大于降水量增加带来的影响。局地因素如地形地貌、植被、雪盖及地层岩性等也都显著影响多年冻土的变化。本文据冻土上限变化与不同深度冻土地温变化,总体上可以看出青藏铁路沿线多年冻土退化表现为冻土上限下降和冻土地温升高,但不同地温分区下冻土退化程度有所差异,高温冻土区冻土上限下降幅度和下降速率要大于低温冻土区,主要受到冻土上限附近地温高低差异的影响;而低温冻土区冻土升温幅度与升温速率要大于高温冻土区,主要受到冻土相变潜热的影响[24,25],也不排除土体热参数差异的影响[16]。由于冻土上限距离地表较近,冻土上限及冻土上限附近地温易受到外界环境的影响,气候条件如气温和降水量在区域尺度上对其产生影响,局地因素如植被、积雪坡度、坡向、岩性及水分等则在局域尺度上对其产生影响[26]。青藏铁路沿线冻土上限下降及其附近升温,区域尺度上表现出对气候变化的响应;同时,局地因素对个别场地影响较大,致使个别场地也出现了冻土上限抬升与冻土地温下降的情形(如图2与图4中P36与P41场地),局地因素如地表沼泽化造成冷、暖季活动层导热系数的较大差异可能是造成这一现象的主要原因[27,28]。15 m深度地温变化能更好体现对气候变化的响应[29],除P36与P41场地受局地因素影响较大外,该深度地温总体上呈升温趋势。另外,冻土退化较严重的场地(如P31与P34场地),冻土地温高于-0.07 ℃,活动层与冻土呈现不衔接的状态,表明已经出现冻土层上融区,是冻土退化阶段后期的表现[30](图7)。
图7 冻土退化严重场地地温随深度变化(2013年4月15日)
Fig.7 Change of ground temperature along depth under sites with permafrost degradation(April,15th, 2013)
通过对青藏铁路沿线30个天然场地2006—2015年冻土上限及其变化、不同深度冻土地温及其变化,分析研究了多年冻土的时空变化特征,得出以下几点结论。
(1)沿线冻土上限为0.88~9.14 m,平均为3.54 m。高、低温冻土区冻土上限平均值分别为4.18和2.03 m。在冻土上限下降的场地中,冻土上限下降幅度为0.05~2.22 m,平均为0.51 m。高、低温冻土区冻土上限平均下降幅度分别为0.64和0.17 m。冻土上限下降速率为0.01~0.25 m/a,平均为0.07 m/a。高、低温冻土区冻土上限平均下降速率分别为0.08和0.02 m/a。
(2)沿线冻土上限附近地温年平均值为0.07~-2.76 ℃,平均为-0.66 ℃。高、低温冻土区冻土上限附近地温分别为-0.27和-1.57 ℃。在冻土上限附近地温升温的场地中,冻土上限升温幅度为0.01~0.60 ℃,平均为0.16 ℃。高、低温冻土区冻土上限附近地温平均升温幅度分别为0.13和0.25 ℃。冻土上限附近地温升温速率为0.001~0.067 ℃/a,平均为0.018 ℃/a。高、低温冻土区冻土上限附近地温平均升温速率分别为0.014和0.028 ℃/a。
(3)沿线15 m深度地温年平均值为0.06~-3.08 ℃,平均为-0.73 ℃。高、低温冻土区15 m深度地温分别为-0.34和-1.64 ℃。在15 m深度地温升温的场地中,15 m深度地温升温幅度为0.01~0.48 ℃,平均为0.10 ℃。高、低温冻土区15 m深度地温升温幅度分别为0.06和0.17 ℃。15 m深度地温升温速率为0.002 ~0.054 ℃/a,平均为0.011 ℃/a。高、低温冻土区15 m深度地温升温速率分别为0.007和0.019 ℃/a。
The authors have declared that no competing interests exist.
| [1] |
|
| [2] |
|
| [3] |
Recent permafrost warming on the Qinghai-Tibetan Plateau [J].
[1] Permafrost temperature monitoring through 10 boreholes up to 10.7 m depth has been conducted half-monthly from 1996 through 2006 along the Qinghai-Tibetan Highway. The primary results show that the long-term mean annual permafrost temperatures at 6.0 m depth vary from 0908080.1900°C at the Touerjiu Mountains (TM1) site to 0908083.4300°C at Fenghuo Mountain (FH1) site, with an average of about 0908081.5500°C from all 10 sites over the period of their records, indicating permafrost is relatively warm on the Plateau. Mean annual permafrost temperatures at 6.0 m depth have increased 0.1200°C to 0.6700°C with an average increase of about 0.4300°C during the past decade. Over the same period, mean annual air temperatures from four National Weather Service Stations show an increase of about 0.600°C to 1.600°C, generally sufficient to account for the permafrost warming although other factors, such as changes in snow cover and soil moisture conditions, may also play important roles in permafrost warming. Increase in summer rainfall and decrease in winter snowfall may be cooling factors to the underlying soils, offsetting less degree of permafrost warming compared with the magnitude of air temperature increase. Permafrost temperatures at 6.0 m depth increased year-around with most of the increase happened in spring and summer. Winter air temperature has increased 2.900°C to 4.200°C from 1995 through 2005, which may account for significant spring and summer permafrost warming at 6.0 m depth due to three to six month time lag. However, there were no significant trends of air temperature change in other seasons. Further investigation, especially comprehensive monitoring, is needed to better comprehend the physical processes governing the thermal regime of the active layer and permafrost on the Qinghai-Tibetan Plateau.
|
| [4] |
Responses of permafrost to climate change and their environmental significance, Qinghai-Tibet Plateau [J].
[1] In this paper we summarize recent research in geocryological studies carried out on the Qinghai-Tibet Plateau that show responses of permafrost to climate change and their environmental implications. Long-term temperature measurements indicate that the lower altitudinal limit of permafrost has moved up by 25 m in the north during the last 30 years and between 50 and 80 m in the south over the last 20 years. Furthermore, the thickness of the active layer has increased by 0.15 to 0.50 m and ground temperature at a depth of 6 m has risen by about 0.1脗掳 to 0.3脗掳C between 1996 and 2001. Recent studies show that freeze-thaw cycles in the ground intensify the heat exchange between the atmosphere and the ground surface. The greater the moisture content in the soil, the greater is the influence of freeze-thaw cycling on heat exchange. The water and heat exchange between the atmosphere and the ground surface due to soil freezing and thawing has a significant influence on the climate in eastern Asia. A negative correlation exists between soil moisture and heat balance on the plateau and the amount of summer precipitation in most regions of China. A simple frozen soil parameterization scheme was developed to simulate the interaction between permafrost and climate change. This model, combined with the NCAR Community Climate Model 3.6, is suitable for the simulation of permafrost changes on the plateau. In addition, permafrost degradation is one of the main causes responsible for a dropping groundwater table at the source areas of the Yangtze River and Yellow River, which in turn results in lowering lake water levels, drying swamps and shrinking grasslands.
|
| [5] |
Thermal regimes and degradation modes of permafrost along the Qinghai-Tibet Highway [J].青藏公路沿线冻土的地温特征及退化方式 [J].
青藏高原多年冻土(以下简称冻土)具有地域分布广、厚度薄及稳定性差等特征.过去几十年的气候变暖背景下,冻土广泛退化,地温升高,夏季最大融化深度加深,冬季冻结深度减小.冻土已经产生下引式、上引式和侧引式退化.冻土层厚度减薄,或者在某些地区彻底消失.冻土退化模式研究在冻土学、寒区工程和寒区环境管理方面具有重要意义.由南至北穿越560km冻土区的青藏公路沿线(简称青藏线)冻土在青藏高原腹地具有很好的代表性.在水平方向上,冻土退化在多年冻土下界附近的零星冻土分布区、融区边缘和岛状冻土区表现得更为明显.当最大季节融化深度超过最大季节冻结深度时,冻土开始下引式退化;通常形成融化夹层,造成多年冻土和季节冻结层不衔接.当多年冻土层中地温梯度减小到小于下伏或周边融土层时,则产生上引式或侧引式退化.下引式退化进程可分为4个阶段:(1)初始退化阶段,(2)加速退化阶段,(3)融化夹层阶段,(4)最终多年冻土彻底融化为季节冻土阶段.当多年冻土中地温梯度降至下伏融土层地温梯度以下时,则产生上引式退化.3种类型冻土温度曲线(稳定型、退化型和相变过渡型)展现了这些退化模式.虽然存在不同地段和类型的地温特征,三种退化模式的各种组合最终将使多年冻土消融,转变成季节冻土.过去25年来,青藏线冻土年平均下引式退化速率变化在6~25cm,年平均上引式退化速率在12~30cm,零星多年冻土区年平均侧引式退化速率为62~94cm.这些观测结果超过所报道的过去20年来阿拉斯加亚北极不连续冻土区4cm的年平均退化速率,蒙古国不连续冻土区的4~7cm的年平均退化速率,以及雅库悌共和国亚北极和阿拉斯加北极稳定性冻土区退化速率.
|
| [6] |
Permafrost degradation on the Qinghai-Tibet Plateau and its environmental impacts [J]. |
| [7] |
Permafrost monitoring and its recent changes in Qinghai-Tibet Plateau [J].青藏高原多年冻土监测及近期变化 [J].
对1995-2004年青藏高原多年冻土温度监测资料进行分析,结果表明:在全球气候变暖影响下,近10年来多年冻土发生了显著的变化,活动层厚度有明显的增大趋势,且高温多年冻土区活动层厚度增大趋势大于低温多年冻土区。多年冻土上限温度和6 m深度多年冻土温度均有明显的升温趋势,低温多年冻土区升温速率要大于高温多年冻土。青藏高原多年冻土变化对气候变暖有明显的响应关系。
|
| [8] |
Permafrost changes along the Qinghai-Xizang Highway during the last decades [J].近数十年来青藏公路沿线多年冻土变化 [J]. |
| [9] |
Permafrost degradation under an embankment of the Qinghai-Tibet Railway in the southern limit of permafrost [J].多年冻土南界附近青藏铁路路基下的冻土退化 [J].
基于2006-2012年青藏铁路多年冻土区唐古拉山南侧安多断面地温监测资料,分析了多年冻土南界附近路基下多年冻土的退化过程及其影响因素.结果表明:该监测断面天然场地多年冻土退化表现为多年冻土天然上限下降与多年冻土地温升高,观测期内多年冻土天然上限下降0.29 m,下降速率为4 cm·a-1;路基下10 m处多年冻土温度升高0.03℃,升温速率为0.004℃·a-1.该监测断面路基左路肩下多年冻土退化表现为多年冻土人为上限下降、多年冻土地温升高、多年冻土下限抬升以及多年冻土厚度减少.观测期内多年冻土人为上限下降0.41 m,下降速率为6 cm·a-1;路基下10 m处多年冻土地温升高0.06℃,升温速率为0.009℃·a-1;多年冻土下限抬升0.50 m,抬升速率为7 cm·a-1;多年冻土厚度减少0.90 m,减少速率为13 cm·a-1.工程作用是导致路基下多年冻土退化的主要原因,气温升温与局地因素中的冻结层上水发育促进了这一退化过程.路基下融化夹层的出现,导致多年冻土垂向上由衔接型变为不衔接型.
|
| [10] |
Characteristics of thawed interlayer beneath embankment of the Qinghai-Tibet Railway in permafrost regions and its effect on embankment settlement deformation [J].青藏铁路路基下融化夹层特征及其对路基沉降变形的影响 [J].
基于青藏铁路多年冻土区路基地温与变形现场监测资料, 研究了青藏铁路路基下融化夹层特征及其对路基沉降变形的影响. 结果表明:在已有监测场地中, 青藏铁路沿线天然场地融化夹层发育较少, 而路基下融化夹层发育较多. 低温冻土区路基下融化夹层能够逐渐完全回冻使其消失, 高温冻土区大部分路基下融化夹层有进一步发展的趋势. 当融化夹层下部为高含冰量冻土时, 融化夹层与路基沉降变形关系密切, 路基易产生较大的沉降变形; 当融化夹层下部为低含冰量冻土时, 路基沉降变形较小.
|
| [11] |
Permafrost changes and engineering stability in Qinghai-Xizang Plateau [J].青藏高原多年冻土变化与工程稳定性 [J].
气候变化和工程活动引起多年冻土温度升高、活动层厚度增大、地下冰融化, 导致路基工程稳定性变化. 本研究在综述青藏高原多年冻土变化和冻土工程研究重要进展的基础上, 利用青藏公路和青藏铁路沿线冻土与工程监测数据, 给出了青藏高原多年冻土温度和活动层厚度变化及其与气候变化的关系、多年冻土对工程活动的响应过程, 青藏铁路工程稳定性动态变化以及块石结构路基降温机制和过程. 最后, 提出了在气候变化下冻土工程将来亟待解决的关键科学问题.
|
| [12] |
Impacts of permafrost changes on alpine ecosystem in Qinghai-Tibet Plateau [J].青藏高原冻土区冻土与植被的关系及其对高寒生态系统的影响 [J]. |
| [13] |
Changes in active layer thickness over the Qinghai-Tibetan Plateau from 1995 to 2007 [J].
[1] The active layer over permafrost plays a significant role in surface energy balance, hydrologic cycle, carbon fluxes, ecosystem, and landscape processes and on the human infrastructure in cold regions. Over a period from 1995 to 2007, a systematic soil temperature measurement network of 10 sites was established along the Qinghai-Tibetan Highway. Soil temperatures up to 12 m depth were continuously measured semimonthly. In this study, we investigate spatial variations of active layer thickness (ALT) and its change over the period of record. We found that ALT can be estimated with confidence using semimonthly soil temperature profiles compared to those determined from available daily soil temperature profiles over the Qinghai-Tibetan Plateau. The primary results demonstrate that long-term and spatially averaged ALT is 652.41 m with a range of 1.32–4.57 m along the Qinghai-Tibetan Highway. All monitoring sites show an increase in ALT over the period of their records. The mean increasing rate of ALT is 657.5 cm/yr. ALT shows a closely positive correlation with the thawing index of air temperature on the plateau. We estimated ALT using the thawing index over a period from 1956 to 2005 near the Wudaoliang Meteorological Station in the northern plateau. ALT had no or very limited change from 1956 to 1983 and a sharp increase of 6539 cm from 1983 to 2005. The magnitude of ALT increase is greater in the warm permafrost region than in the cold permafrost region. The primary control of increase in ALT is caused by an increase in summer air temperature, whereas changes in the winter air temperature and snow cover condition play no or a very limited role.
|
| [14] |
Ground temperature monitoring and its recent change in Qinghai-Tibet Plateau [J].
The monitoring data is used to analyze the recent change in the thickness of active layer, the subsurface temperature, the near permafrost surface temperature, and the permafrost temperature at the depth of 6 or 8 m. The results show that their changes have a better accordance with air temperature change. The climate change has an impact on the change of the active layer and the thermal regime of the permafrost. The change of the active layer and the thermal regime of the permafrost can indirectly explain some features of climate change.
|
| [15] |
Thermal state of permafrost and active layer in central Asia during the International Polar Year [J].
Abstract Permafrost in Central Asian is present in the Qinghai–Tibet Plateau in China, the Tien Shan Mountain regions in China, Kazakhstan and Kyrgyzstan, the Pamirs in Tajikistan, and in Mongolia. Monitoring of the ground thermal regime in these regions over the past several decades has shown that the permafrost has been undergoing significant changes caused by climate warming and increasing human activities. During the International Polar Year, measured mean annual ground temperature (MAGT) at a depth of 665m ranged from 613.2°C to 0.2°C on the Qinghai–Tibet Plateau and the active-layer thickness (ALT) varied between 105 and 32265cm at different sites. Ground temperatures at the bottom of the active layer (TTOP) warmed on average by 0.06°C yr 611 over the past decade. In Mongolia, MAGT at 10–1565m depth increased by up to 0.02–0.03°C yr 611 in the Hovsgol Mountain region, but by 0.01–0.02°C yr 611 in the Hangai and Hentei Mountain regions. The increase in permafrost temperatures in the northern Tien Shan from 1974 to 2009 ranged from 0.3°C to 0.6°C. At present measured permafrost temperatures vary from 610.5°C to 610.1°C. The ALT increased from 3.2 to 465m in the 1970s to a maximum of 5.265m between 1995 and 2009. Copyright 08 2010 John Wiley & Sons, Ltd.
|
| [16] |
Variation characteristics of the permafrost along the Qinghai-Tibet Railway under the background of climate change [J].气候变化背景下青藏铁路沿线多年冻土变化特征研究 [J].
多年冻土是复杂地气系统的产物,以升温为特征的气候变化不可避免地对其产生影响.基于青藏铁路沿线8个天然场地2006-2011年的地温监测资料,分析了气候变化背景下,多年冻土升温特征及上限变化规律,并对低、高温冻土的变化特征进行了对比分析.结果表明:2006-2011年监测期间,铁路沿线多年冻土正在经历明显的升温趋势,上限附近和15 m深处平均升温率分别为0.015℃·a-1和0.018℃·a-1,其中,低温冻土区在上述两个深度处升温均比高温冻土区显著;多年冻土上限深度也表现出一定的增深趋势,平均增深速率为4.7 cm·a-1,其中,高温冻土区增深速率大于低温冻土区.低、高温冻土对气候变化的响应表现出了较大差异.同时,受局地因素的影响,不同区域在升温和上限增深上也存在一定差异.
|
| [17] |
Thermal state of the active layer and permafrost along the Qinghai-Xizang (Tibet) Railway from 2006 to 2010 [J].
In this study, we investigated changes in active layer thickness (ALT) and permafrost temperatures at different depths using data from the permafrost monitoring network along the Qinghai-Xizang (Tibet) Railway (QXR) since 2005. Among these sites, mean ALT is ~3.1 m, with a range of ~1.1 to 5.9 m. From 2006 through 2010, ALT has increased at a rate of ~6.3 cm a 1. The mean rate of permafrost temperature rise at the depth of 6.0 m is ~0.02 °C a 1, estimated by linear regression using 5 yr of data, and the mean rate of mean annual ground temperature (MAGT) rise at a depth of zero amplitude is ~0.012 °C a 1. Changes for colder permafrost (MAGT < 1.0 °C) are greater than changes for relatively warmer permafrost (MAGT > 1.0 °C). This is consistent with results observed in the Arctic and subarctic.
|
| [18] |
Key issues of highway construction in permafrost regions in China [J].我国多年冻土区高速公路修筑关键问题研究 [J]. |
| [19] |
et al.Research frame of vulnerability and adaptation for the cryosphere and its changes [J].冰冻圈及其变化的脆弱性与适应研究体系 [J].
冰冻圈及其变化的脆弱性与适应研究是以探索冰冻圈及其变化的脆弱性概念为前提和基础,以冰冻圈变化的自然影响为链接点,以社会经济影响研究为突破,以脆弱性研究为桥梁与纽带,以应对与适应冰冻圈变化影响、风险为目的的冰冻圈科学领域的新兴研究方向。探讨了冰冻圈及其变化的脆弱性概念,并以影响—脆弱性—适应为主线,针对冰冻圈变化的社会经济影响研究、脆弱性研究、适应研究内容及其关键科学问题、脆弱性评估模型、尺度问题进行了较为详细的阐述,初步搭建了中国冰冻圈及其变化的脆弱性与适应研究体系。基于冰冻圈要素的多样性、变化影响的复杂性与显著的区域差异性,从2个梯度勾绘了冰冻圈及其变化的脆弱性与适应研究格局与空间布局。中国冰冻圈及其变化的脆弱性与适应研究除深化冰冻圈变化的影响与脆弱性研究之外,应加强不同利益相关者协同设计、共同参与的冰冻圈变化适应应用研究,并关注冰冻圈灾害风险、渐变风险研究。
|
| [20] |
Characteristics and mechanisms of embankment deformation along the Qinghai-Tibet Railway in permafrost regions [J].
Based on field monitoring datasets, characteristics of embankment deformation were summarized along the Qinghai–Tibet Railway in four permafrost regions with different mean annual ground temperatures (MAGTs). Then, further analyses were carried out at some typical monitoring profiles to discuss mechanisms of these embankment deformations with consideration of detailed information of thermal and subsurface conditions. The results indicated that in regions with MAGT <61021.502°C, embankments only experienced seasonal frost heaves, and of which the magnitudes were not significant. So, the embankments in the regions performed satisfactorily. Whereas in regions with MAGT ≥61021.502°C, both traditional embankment and crushed rock embankment experienced settlements, but characteristics and mechanisms of the settlements were different for the two kinds of embankment. For crushed rock embankment, the magnitudes of settlement and differential settlement between right and left embankment shoulders were not significant and increased slowly. In respect that upwards movements of permafrost tables and better thermal stability of permafrost beneath embankment, mechanism of settlements on the embankment was inferred as creep of warm and ice-rich layer often present near permafrost table. While for traditional embankment, particularly in warm and ice-rich permafrost regions, the magnitudes of settlement and differential settlement between right and left embankment shoulders were significant and still increased quickly. Considering underneath permafrost table movements and permafrost temperature rises, mechanisms of settlements on the embankment included not only creep but also thawing consolidation of underlying permafrost. Therefore, some strengthened measures were needed to ensure long-term stability of these traditional embankments, and special attention should be paid on temperature, ice content and applied load within the layer immediately beneath permafrost table since warming and thawing of the layer could give rise to considerable settlement.
|
| [21] |
Climate changes in the Tibetan Plateau during the last three decades [J].青藏高原近30年气候变化趋势 [J].
以1971~2000年青藏高原77个气象台站的观测数据(最低、最高气温,日照时数,相对湿度,风速和降水量)为基础,应用1998年FAO推荐的Penman-Monteith模型,并根据我国实际状况对其辐射项进行修正,模拟了青藏高原1971~2000年的最大可能蒸散,并由Vyshotskii模型转换为干燥度,力求说明近30年青藏高原的气候变化趋势,以及干湿状况的空间分布。应用线性回归法计算变化趋势,并用Mann-Kendall方法进行趋势检验。结果表明青藏高原近30年气候变化的总体特征是气温呈上升趋势,降水呈增加趋势,最大可能蒸散呈降低趋势,大多数地区的干湿状况有由干向湿发展的趋势。气候因子与地表干湿状况间并不是线性关系,存在很大的不确定性。
|
| [22] |
Variation of temperature and permafrost along Qinghai-Tibet Railway [J].青藏铁路沿线多年冻土区气温和多年冻土变化特征 [J]. |
| [23] |
Changing tendency of precipitation in permafrost regions along Qinghai-Tibet Railway during last thirty years [J].1976—2010 年青藏铁路沿线多年冻土区降水变化特征 [J].
<FONT face=Verdana>针对青藏铁路穿越的多年冻土区段,利用沿线多年冻土区的五道梁、风火山、沱沱河、安多气象站1976-2010年35a的降水量观测资料,并结合同时期地表温度和气温资料,对多年冻土区区域气候变化进行分析,揭示了多年冻土区近35a来降水、地面温度、气温都在波动中上升的变化特征. 结果表明:近10a多年冻土区处在丰水期,多年冻土区气候在逐渐变暖,这将会影响多年冻土地温的变化,进而会对青藏铁路多年冻土区路基工程的稳定性产生一定影响.</FONT>
|
| [24] |
Progress in global permafrost and climate change studies [J].全球多年冻土与气候变化研究进展 [J].
多年冻土热状态和土壤季节冻融过程的变化对陆地生态系统、地-气间温室气体交换、水文和地貌过程以及工程基础设施的建设和运行都具有很大的影响。活动层和多年冻土及其变化数据信息对于验证在不同尺度的陆面过程、水文、生态和气候模型至关重要。本文就目前全球多年冻土与气候变化研究现状进行概括性总结。在全球变暖的影响下,全球范围内多年冻土发生了不同程度的退化。自20世纪70年代末以来,北极高纬度低温多年冻土温度升高可达3℃。由于受相变潜热的影响,在不连续多年冻土区相对较高温度的多年冻土温度增加幅度较小。受局地条件的影响,个别站点多年冻土温度几乎没有发生变化,甚至有降温的趋势。高纬度多年冻土南界向北移动,而中纬度高山地区多年冻土下界向高海拔移动,导致全球多年冻土面积减少。活动层厚度变化具有较强的区域差异,其深度增加范围从几厘米到1m多不等。新的融区在形成,融区厚度在增加且其范围在扩大。导致全球范围内多年冻土温度升高、活动层厚度增加以及融区的形成主要是受气温升高和积雪条件变化所致。未来多年冻土研究应包括不同时-空尺度上的长期监测和数值模拟、多年冻土变化与大气、水文、生态系统、碳循环以及地貌过程的相互作用等方面。
|
| [25] |
Permafrost thermal state in the polar Northern Hemisphere during the international polar year 2007-2009: A synthesis [J].
The permafrost monitoring network in the polar regions of the Northern Hemisphere was enhanced during the International Polar Year (IPY), and new information on permafrost thermal state was collected for regions where there was little available. This augmented monitoring network is an important legacy of the IPY, as is the updated baseline of current permafrost conditions against which future changes may be measured. Within the Northern Hemisphere polar region, ground temperatures are currently being measured in about 575 boreholes in North America, the Nordic region and Russia. These show that in the discontinuous permafrost zone, permafrost temperatures fall within a narrow range, with the mean annual ground temperature (MAGT) at most sites being higher than -2掳C. A greater range in MAGT is present within the continuous permafrost zone, from above -1掳C at some locations to as low as -15掳C. The latest results indicate that the permafrost warming which started two to three decades ago has generally continued into the IPY period. Warming rates are much smaller for permafrost already at temperatures close to 0掳C compared with colder permafrost, especially for ice-rich permafrost where latent heat effects dominate the ground thermal regime. Colder permafrost sites are warming more rapidly. This improved knowledge about the permafrost thermal state and its dynamics is important for multidisciplinary polar research, but also for many of the 4 million people living in the Arctic. In particular, this knowledge is required for designing effective adaptation strategies for the local communities under warmer climatic conditions. Copyright 漏 2010 John Wiley & Sons, Ltd.
|
| [26] |
Review of permafrost monitoring in the northern Da Hinggan Mountains, Northeast China [J].大兴安岭北部多年冻土监测进展 [J].
大兴安岭北部是我国多年冻土最为发育的地区之一, 多年冻土的存在和分布受植被、积雪等局地因素的影响十分显著, 形成了独特的兴安-贝加尔型多年冻土. 随着该区社会经济的发展, 多年冻土对寒区环境以及工程生产活动的影响越来越大. 近几年来逐步在大兴安岭北部建立了以多年冻土为主要研究对象的监测网络, 包括多年冻土地温监测网络、自动气象站、雪特性观测系统、活动层温度-水分观测系统以及地面融沉监测断面, 获得了一系列有意义的数据和成果. 做好大兴安岭北部多年冻土及其周围植被、气候及冻土灾害的监测具有重要的基础性和前瞻性科学价值.
|
| [27] |
The study of the patchy permafrost along the Heihe-Bei’an Highway in Xiao Hinggan Mountains with ground penetrating radar [J].应用探地雷达研究中国小兴安岭地区黑河—北安公路沿线岛状多年冻土的分布及其变化 [J].
<FONT face=Verdana>结合探地雷达对我国东北黑大公路黑北段岛状多年冻土的勘察结果进行了应用分析研究. 结果表明,探地雷达可以较为有效确定多年冻土分布区域、厚层地下冰存在位置,是研究多年冻土的一种有效手段. 探地雷达勘测结果表明,东北小兴安岭岛状多年冻土现在主要位于山间沟谷洼地、或山间盆地中,地表有积水、塔头草生长茂盛、草炭和泥炭发育的沼泽化湿地是其存在的重要标志;结合20世纪70年代对该区的冻土调查结果,以及线路沿线现存冻土比例推断,在过去30a间小兴安岭岛状多年冻土发生了较为显著的退化;现存黑河-北安公路沿线稀疏岛状多年冻土区的比例约为2%,冻土厚度约2~9m,冻土上限约1~3m. 在影响多年冻土分布的因素中,地表水分条件是最为关键的因素,该地表水分通过蒸发吸热、单向导热等作用调节地中热流,并维持一定的净放热,在年平均气温接近0℃的条件下仍可以维持冻土的发育和存在;其它影响因素,如地形、地貌、坡向、植被、地质条件等因素发挥次要作用. </FONT>
|
| [28] |
Influences of local factors on ground temperatures in permafrost regions along the Qinghai-Tibet Highway [J].局地因素对青藏公路沿线多年冻土区地温影响分析 [J].
<FONT face=Verdana>气候是多年冻土形成与变化的动力,局地因素则通过改变地表辐射、对流和传导过程对多年冻土产生影响,导致多年冻土发生空间分异. 应用青藏公路沿线大量的观测资料分析了局地因素对多年冻土区地温所产生的影响. 结果表明:地形地貌、植被、积雪、土壤性质及含水量等局地因素,对青藏公路沿线地区多年冻土的发育和多年冻土热状况有显著影响. 局地因素的差异可能会造成相同气候条件下小范围内冻土类型的分化,土壤颗粒较细、地表水分含量充足、植被发育良好的地段最有利于多年冻土的发育和保存. 在植被覆盖和土壤性质相似的情况下,青藏高原地区多年冻土地温一般是西坡高于东坡,南坡高于北坡. 暖季植被能够阻止部分热量进入土层,降低地表温度;在冷季,植被能减少土层热量散发,有助于保持地表温度. 植被的存在有利于保持活动层以及其下多年冻土层的稳定,植被的退化会导致进入土层的热量发生变化引起季节冻结和融化的变化,并对多年冻土产生影响. 冷季厚层积雪对多年冻土浅层土壤有显著的保温作用,而积雪融化会降低地表土壤温度.</FONT>
|
| [29] |
Responses of embankment thermal regime to engineering activities and climate change along the Qinghai-Tibet Railway [J].多年冻土区铁路路基热状况对工程扰动及气候变化的响应 [J]. |
| [30] |
Processes and modes of permafrost degradation on the Qinghai-Tibet Plateau [J].青藏高原多年冻土退化过程及方式 [J]. |

/
| 〈 |
|
〉 |
