
刘娜 , 王辉, 凌铁军, 祖子清
国家海洋环境预报中心国家海洋局海洋灾害预报技术研究重点实验室,北京 100081
Liu Na, Wang Hui, Ling Tiejun, Zu Ziqing
中图分类号: P731.3
文献标识码: A
文章编号: 1001-8166(2018)02-0131-10
收稿日期: 2017-08-31
修回日期: 2017-12-26
网络出版日期: 2018-02-20
版权声明: 2018 地球科学进展 编辑部
基金资助:
作者简介:
First author:Liu Na(1982-),female,Qingdao City,Shandong Province, Associate professor. Research areas include ocean circulation dynamics, theory and method of ocean forecasting.E-mail:liuna@nmefc.cn
作者简介:刘娜(1982-),女,山东青岛人,副研究员,主要从事海洋环流动力学、海洋预报理论与方法等研究.E-mail:liuna@nmefc.cn
展开
摘要
海洋环境预报在经济发展和基础设施建设等方面发挥着越来越重要的作用,涉及到海上安全、海洋能源开发与保护、远洋运输和海洋渔业等许多领域和方面。近年来,各国的全球海洋预报取得了显著的进展。全球海洋数据同化实验(GODAE)OceanView计划为各国提供协调和技术支持,发展并建立全球业务化海洋预报系统,将全球海洋预报的概念实现业务化运行。全球业务化海洋预报系统以海洋动力数值模式作为动力框架,将近实时高质量的观测输入场通过资料同化融入到模式中,实现对全球范围多时空尺度的海洋状况提供未来演替的预测,并对产品表现不间断地进行监测以保证预报服务的质量。简要介绍和回顾GODAE OceanView所涵盖的全球海洋预报系统的发展历程和现状,并对全球海洋预报未来发展的难点与问题给予展望。
关键词:
Abstract
The marine environmental forecast plays an increasingly important role in economic growth and infrastructure development, and touches upon many fields and aspects, including marine security, energy resources development and protection, ocean shipping and fisheries. Global Ocean Data Assimilation Experiment (GODAE) OceanView supports the national research groups providing them with coordination and technical support among the partners. Forecasting centers develop and establish global operational ocean forecast systems. The global operational ocean forecasting system uses the ocean dynamic numerical model as the dynamic framework, and the near real-time high-quality observation input field is integrated into the model by data assimilation to realize the future environmental forecasts of the marine conditions covering the multi-time scale. The products are routinely validated with observations in order to assess their quality. This paper briefly introduced and reviewed the development process and current situation of the global ocean forecasting system covered by GODAE OceanView, and outlined the future development of global ocean forecasting.
Keywords:
随着海上安全、海洋能源开发与保护、远洋运输和海洋渔业以及天气、季节和气候预报等领域对海洋环境状态信息的需求日益凸显,近年来,各国的全球海洋预报取得了显著进展。1997—2008年,全球海洋数据同化实验(Global Ocean Data Assimilation Experiment, GODAE)计划的实施,为各国全球海洋预报系统的建立和发展提供了国际合作机会,发展并建立全球业务化海洋预报系统,发布海洋物理要素的中期和长期预报[1], 将全球海洋预报的概念实现业务化运行。全球业务化预报系统具备2个重要特点:首先采用预先确定的系统方法,每次预报都以常规和定期的方式进行;同时不间断地监测产品表现来保证服务质量[2]。各系统间进行了相互比较[3],通过评估全球业务化海洋预报的质量和表现,提升海洋分析和预报系统的功能[4],促进全球业务化海洋预报能力的提高。
GODAE OceanView (GOV)计划(2008年—)是继GODAE之后的国际合作项目,继续协调和领导海洋预报系统的提升和发展,促进了海洋研究领域的国际合作,以及全球业务化海洋预报的发展,通过提高计算能力和模式分辨率提升了全球数值模拟和数据同化系统的能力,将业务化和研究应用拓展到生物地球化学和海冰预报[5,6]。GOV计划包含了世界范围内的海洋预报系统,系统区域上从海盆尺度到全球覆盖,模式分辨率上从较低分辨率到涡分辨,绝大多数系统同化了实时观测资料,提供逐日的短期预报,并通过网络发布。本文将介绍和总结GOV所涵盖的全球预报系统的发展过程和现状,并对全球海洋预报未来发展予以展望。
全球业务化海洋预报系统采用海洋动力数值模式作为预报框架的核心组成部分,将近实时、高质量的观测输入场通过资料同化融入到模式中,提供对过去海洋状态最大可能的精确描述以及海洋预报的初始场,从而预测未来全球范围的多时空尺度海洋状况。通过资料同化技术将数值模式与观测数据结合是业务化海洋预报走向精确的重要一步。当前,海洋观测、数值模式和资料同化已是提升全球海洋预报能力的3项关键技术。
海洋观测对海洋预报的初始化、验证以及预报系统的改进至关重要,是业务化海洋预报的基础和前提。全球业务化海洋学关键取决于近实时高质量的现场观测和具有足够空间和时间分辨率的遥感数据的获取。观测数据的数量、质量和可用性将直接影响海洋分析和预测及相关服务的质量。如今,海洋观测是业务化海洋学事业发展的基础条件,现场海洋观测还可用于校正遥感数据,为全球海洋预报提供高质量的数据。
现代海洋观测手段包括海洋科学考察船以及由海洋浮标、水下移动观测平台与海洋卫星等构成的海洋自动观测系统等各种观测技术手段。海洋科学考察船、志愿观测船及船载设备,作为流动的观测平台,可进行定点和走航式的海洋环境立体监测,实现对海洋有限时空覆盖度的调查。船舶观测结果为海洋预报的可操作性提供重要支持, 提供海面实况测量用来校正卫星观测[7,8]。海洋观测系统的多样化和多源化发展,带有探测海面高度和海面温度等海洋要素的卫星成功发射,以及全球Argo 实时海洋观测网和TAO/TRITON浮标阵列的建立,使人们开始有能力获取广阔洋面上大量的、高分辨率的实时海洋观测数据,观测资料大量递增[2]。卫星、浮标、潜标等立体观测系统开始扮演起非常重要的角色,可获取大范围、长期、连续的观测数据。卫星遥感观测的覆盖范围广、同步性强,资料提供及时,具有长期性和连续性[9],能极大地提高海洋预报能力[10]。海表面高度、海表面温度、水色等构成全球海洋预报系统所需的核心业务卫星观测资料。实时地转海洋学观测阵(Argo)国际计划于20世纪末开始布放的剖面浮标观测网,由全球3 000多个剖面漂流浮标阵列组成,可对全球海洋2 000 m以内深度的温盐垂直剖面和参考流速剖面进行观测,实现全球范围内的温度、盐度和上层海流的观测[11]。安装于赤道太平洋两侧的TAO/TRITON监测浮标阵列,由大约70个锚系浮标组成,已提供了10多年的热带海洋海水温盐度、风速风向、海流以及其他参数的连续记录,显著提高了对ENSO过程和机理的认识和预报能力[7]。
国际海洋强国和海洋科学组织,启动了一系列的重大国际观测和科学研究计划,为业务应用和科学研究进行长期基础数据积累,建设全球或区域性海洋观测系统,成为大多数业务化海洋预报应用系统的支柱。包括世界大洋环流实验(World Ocean Circulation Experiment,WOCE,1990—2002年)、国际气候变化与可预测性研究计划(CLImate VARiability and predictability,CLIVAR,1995—2015年)、海洋生物地球化学和海洋生态系统综合研究计划(Integrated Marine Biogeochemistry and Ecosystem Research,IMBER,2003年—)、上层海洋—低层大气研究计划(Surface Ocean-Lower Atmosphere Study,SOLAS,2000年—)、海岸带陆海相互作用研究计划(Land Ocean Interactions in the Coastal Zone,LOICZ,1993年—)、全球有害藻华生态学与海洋学研究计划(Program on the Global Ecology and Oceanography of Harmful Algal Blooms,GEOHAB,1998年—)等对海洋环境进行实时有效的观测和监测。通过加大重要现象与过程机理的强化观测力度,服务于业务应用和科学研究。海洋学和海洋气象学技术合作委员(Joint Technical Commission for Oceanography and Marine Meteorology,JCOMM)作为海洋和海洋气象探测、数据管理与服务的国际政府间合作的管理机构,在国际海洋观测数据采集、数据管理、提供服务等方面发挥了组织和协调的作用;并通过发展全球海洋业务观测网,维护和协调海洋观测系统,建立了初步监测全球观测系统状态的能力。
各国海洋预报机构的海洋数值模式应用海表面强迫场和海底地形,通过数据同化将海洋观测引入模式获得最近的海洋状态,海洋环流模式(下文简称海洋模式)在物理和动力框架约束下对海表到海底的全球海洋环境进行数值模拟,并对海洋状态作出预报。海洋模式在不断发展,包括采用不同的参数化方案,更准确的平流方案,以及更复杂的垂直混合参数化方案或新的垂直坐标[1,5]。
首个全球业务化海洋模式于20世纪90年代末21世纪初应用于短期海洋预报,其全球水平分辨率为1/4°~1°[12]。这个范围的水平分辨率不足以精确预报赤道以外地区的中尺度过程[2]。高分辨率的业务化海洋学系统,需要采用水平涡分辨率和较高垂向分辨率的全球模式,并使用先进的上层海洋物理过程以及高性能的数值代码和算法。为了能很好地表现中尺度变化过程,水平网格距必须足够小,能够分辨斜压不稳定过程。在全球观测系统和超级计算技术进步的基础上,具有涡分辨能力的全球海洋模式的开发和业务化应用成为现实。目前业务化全球海洋预报系统的模式通过采用1/10°或更高分辨率,解决了分辨中尺度过程的问题。
全球海洋模式和同化系统对计算资源都有很高的要求,计算能力成为模式水平和垂向分辨率的限制因素。全球海洋模式在涡分辨率下对计算能力要求是极高的,需要最新的高性能计算能力。20世纪90年代末最强大的超级计算机的计算能力低于1万亿次浮点运算。目前,持续峰值计算能力通常在每秒100万亿次到1 000万亿次,世界上已经有一些强大的超级计算机计算能力达到10亿亿次峰值[5],其中多数是用于地球系统的模拟与预报。全球海洋预报的实际应用需求促使各国海洋预报机构投入大量人力和财力提高高性能计算速度和存储能力,如美国国家海洋和大气管理局(National Oceanic and Atmospheric Administration,NOAA)与欧洲中期天气预报中心现有高性能计算系统计算能力分别为1亿亿次和1.5亿亿次,同时投入巨资建设存储系统[13]。国家海洋环境预报中心近年来持续加大对高性能计算的投入,预计“十三五”期间高性能计算能力将由目前的75万亿次提升到1 000万亿次[14],加速了高分辨率预报系统的发展。
资料同化技术在海洋科学研究中取得了长足的进步,在业务化海洋预报的构建中取得了应用成果。通过资料同化技术将观测数据与模式场相结合,是得到精确的业务化海洋预报的关键步骤。全球海洋预报系统依赖于资料同化来获得初始场的估计,通过资料同化技术将各种不同类别和时间段的观测资料不断地融于数值模式,并将短期分析预报结果作为模式预报的初值,以此将观测与模式的结果不断融合成为最优值,提高预报精度[15]。准确预测中尺度海洋状态的初始场,为采用涡相容和涡分辨率模式精确预报海洋温度、盐度、海流结构以及海冰提供了基础[16]。
随着计算机水平的不断提高和全球海洋模式的发展,业务化海洋环境分析与预报对海洋数据同化方法提出了更高的需求。近10年来,资料同化技术取得了快速的发展,目前的资料同化方法根据其理论原理可分为2类:一类是基于统计估计理论,如最优插值(Optimal Interpolation,OI)和集合卡尔曼滤波(Ensemble Kalman Filter,EnKF)等;另一类是基于最优控制或称变分,如三维变分(3 Dimensional Variation,3DVar)和四维变分(4 Dimensional Variation,4DVar)等[17]。目前全球业务化海洋预报系统中使用了多种较为先进、也是比较成熟的同化方法, OI 和3DVAR 方法由于其经济可行以及统计可靠等特点,目前在海洋动力环境分析与预报领域应用最为广泛,4DVAR 和EnKF 由于更好的海洋模式动力一致性的优点将逐渐成为海洋动力环境分析与预报的主要手段。全球海洋预报系统利用的同化资料除了由卫星观测的海表面温度和海表面高度外,大都采用了温度、盐度剖面资料,以及海冰密集度资料等。全球海洋预报系统将各种不同来源, 不同时空分辨率的原始观测资料进行反演、订正和分析等处理,通过同化大量准实时海洋观测资料, 为海洋数值预报模式提供一个尽可能准确的初始状态[13]。
采用海洋动力模式进行海洋三维温盐流预报开始于20世纪80年代。到20世纪90年代中期,科技的发展使全球中尺度海洋预报成为可能,随着1997年GODAE计划的实施,在国际上提供技术支持,全球数值模拟和数据同化系统得以逐步建立和发展,并建立全球海洋预报系统。
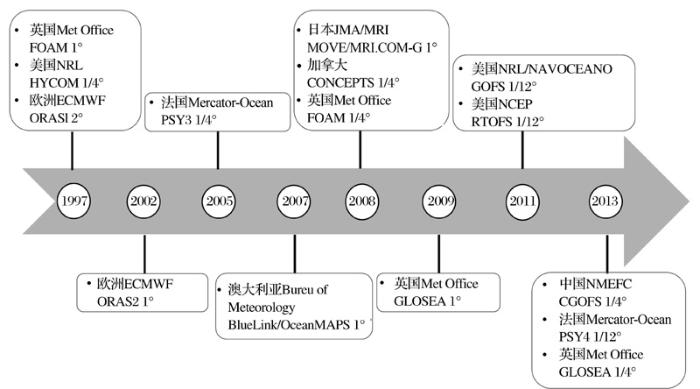
目前,多国海洋预报机构发展并建立各自的全球海洋预报业务系统,图1所示为全球预报系统发展历程中的关键步骤,其中时间为各个预报系统投入业务化运行的年份。英国气象局(Met Office)、美国海军研究实验室(United States Naval Research Laboratory,NRL)和欧洲中期天气预报中心(European Centre for Medium-Range Weather Forecasts,ECMWF)在1997年开发建立了第一批全球预报系统。英国气象局建立全球构架的海洋预报同化模式系统(Forecasting Ocean Assimilation Model system,FOAM),并开发全球再分析系统GLOSEA,其分辨率由1°发展到目前的1/4°。到2000年初,全球预报系统在法国、日本等国家得到发展。法国全球业务化海洋预报由麦卡托海洋中心(Mercator Ocean)负责,从过去的全球2°分辨率到目前已经发展为1/12°,现有PSY4全球1/12°海洋预报系统业务化运行。2008年3月日本气象厅气象研究所研发的全球业务化海洋资料同化系统替换了原有的预报分析系统,与之匹配的同化系统基于三维变分方法搭建,系统更名为MOVE/MRI.COM-G。基于混合坐标海洋模式(HYbrid Coordinate Ocean Model,HYCOM)[18~20]的全球海洋实时预报系统(The NCEP Global Real-Time Ocean Forecast System,RTOFS)是NOAA开发的第一个涡识别(1/12°)分辨率的海洋预报系统,于2011年10月在美国NOAA的海洋预报中心(Ocean Prediction Center,OPC)投入业务化应用。同年,美国海军实验室研制的1/12°水平分辨率的全球海洋预报系统(Global Ocean Forecast System,GOFS)投入运行。澳大利亚和加拿大在2000年下半年开发了自己的系统。
国家海洋环境预报中心以普林斯顿海洋模式(Princeton Ocean Model,POM)为基础开发了三维海洋数值预报模式,建立了西北太平洋、中国海、渤海、中国台湾周边海域的业务化数值预报系统,并基于全球海洋模式(Modular Ocean Model version-4,MOM4),初步建立赤道太平洋上混合层海温7天数值预报系统。基于MOM4模式开发建立的业务化海洋预报系统是我国首个涵盖全球大洋的业务化系统[21,22]。
图1 各国全球业务化海洋预报系统发展历程
Fig.1 Evolution of the development of the ocean forecasting systems in operation in the different countries
美国、欧洲、日本和澳大利亚等国家开展全球海洋预报的研究工作较早,形成了若干相关的知识产权和技术标准等成果,为业务化应用提供了良好的技术指导。其中欧美数值预报技术最为先进,且美国数值预报技术开放度最高,日本、澳大利亚等国家数值预报产品在其相关区域用户具有较高的影响度。
表1列出了国际上全球业务化海洋预报系统及每个系统的详细信息,包括在GOV框架下进行公布的系统名称、海洋模式、数据同化方案、预报时效等信息。其中PSY4,GOFS和RTOFS这3个系统具有水平分辨率为1/12°的涡识别分辨率,能够在中纬度地区分辨中尺度涡。MOVE/MRI.COM-G和ECMWF这2个系统具有较粗分辨率,BlueLink除了澳大利亚周围分辨率提高到1/10°,其他区域具有1°的粗分辨率。如表1所列,大多数全球预报系统采用z垂直坐标系,只有MOVE/MRI.COM-G,GOFS和RTOFS这3个系统采用混合坐标系[22]。
全球海洋预报系统都有各自的数据同化方案。表1所列的全球海洋预报系统的数据同化方案多数是基于三维变分同化方法[16]。随着数据同化方案的复杂程度增加,同化的观测资料的数量和种类也更加丰富。各海洋预报系统同化的数据包括卫星海表面温度数据、卫星高度计沿轨数据、温盐垂直剖面和海冰观测资料等数据。
3.2.1 美国
RTOFS于2011年10月开始在美国国家环境预报中心 (National Centers for Environmental Prediction,NCEP)投入业务化应用。模式网格在78.64°S~47°N采用麦卡托投影,以北区域采用北极偶极子方案,海岸线采取10 m等深线,且白令海峡是开通的。垂向采用32个混合坐标面,位势密度选取2 000 m为参考面。海洋动力模式与热力学能量海冰模型耦合,并采用KPP混合层方案[23]。该系统采用海军NCODA-3DVAR同化方法构建初始场[24,25],同化海表温度、海面动力高度、海冰密集度和实时现场观测数据,风场采用NCEP的3 h业务化全球风场的动量、辐射和降水通量[26]。系统每天运行1次,预报时效为8天,可提供海温和海流的预报。
美国海军的全球海洋预报系统(GOFSv3.0)采用全球1/12° 混合坐标海洋模式HYCOM,垂直方向上分32层。模式大气强迫使用3 h海军全球环境模式(NAVGEMv.1.1)强迫。径流量强迫使用逐月数据,地形数据来自于NRL的DBDB-2。GOFS采用美国海军耦合海洋资料同化(Nary Coupled Ocean Data Assimilation,NCODA)三维变分同化方案(NCODA-3DVar)。未来系统水平分辨率将提高至1/25°,垂直分辨率提高至41层,增加潮汐强迫,将全球WAVEWATCH-Ⅲ模式和HYCOM/CICE耦合,进一步与海军全球环境模式(Navy Global Environmental Model, NAVGEM)做海气耦合,形成海军第一代地球系统预报能力[27]。
3.2.2 欧洲
欧洲的业务化海洋学合作始于1995 年,各国在罗马共同签署了欧洲全球海洋观测系统(Euro Global Ocean Observation System, EuroGOOS) 谅解备忘录。2004 年全球环境与安全监测项目(Global Monitoring for Environment and Security, GMES) 启动了欧洲地区海洋环境安全计划(Marine Environment and Security for the European Area, MERSEA)。在MERSEA的基础上,GMES于2009 年启动了My Ocean 计划,巩固欧洲的海洋监测预报能力,并实现海洋信息服务的业务化,将整合后的业务化海洋学体系推向了应用服务。大部分欧洲的预报系统使用NEMO(Nucleus for European Modelling of the Ocean)海洋模式。
法国麦卡托海洋中心的全球海洋预报系统从以往的全球2°分辨率发展到目前的1/12°,有PSY3和PSY4 2套海洋分析和预报系统业务化运行,预报时效为7天,可提供全球海表温度、盐度、海流、海面高度等的分析和预报,同时也能提供南极圈冰厚、冰密集度和漂移轨迹等预报产品。2套系统均基于NEMO 3.1海洋模型[28],以及使用弹性黏性塑性流变学配方(LIM2_EVP)的海冰模型。PSY3系统采用ORCA025水平网格,PSY4系统采用1/12°的ORCA12网格,两者均为50层的垂向分层。系统中SAM2同化系统[29,30]同化高度计数据,卫星海面温度,现场温度和盐度垂直剖面,通过具有预测误差的三维多变量模态分解的降序卡尔曼滤波器进行同化,预报系统有很大改进,包括观测误差的自适应调节和海冰密集度的同化。此外,3DVAR方案提供了对温度和盐度的缓慢变化的大规模偏差的校正。大气场采用ECMWF 3 h采样,以重现昼夜循环,动量和热湍流表面通量由CORE块体公式计算[31]。
英国FOAM系统在英国气象局业务化运行,可以预报未来7天的海流、海温、盐度、海冰密集度、厚度和冰速等要素。该系统由NEMO海洋模型[28]作为其动力核心,整个系统考虑了海冰的影响,与CICE海冰模式[32]耦合。2013年1月17日后,FOAM进行了大规模的业务升级,从V11升级到V12,水平网格采用1/4°三极点ORCA网格(ORCA025)[28],垂直分层由50层升级为75层,基于DRAKKAR75层设置构建。接近海表面的垂向分辨率达到了1 m。在FOAM新一代系统中已用新发展的三维变分同化方案NEMOVAR[33,34]取代了旧版OCNASM[35]分析订正同化方案[36~38],NEMOVAR同化系统[33,37]将过去2天的船舶、浮标和卫星测得的海表温度、3颗卫星高度计(Jason-1,Jason2和Envisat)测得的海表面高度数据进行了同化,以确保流场海洋状态的准确性。海表面边界条件由直接强迫变为CORE块体公式[31]进行计算,海冰模式由LIM2变为CICE[36]。
ECMWF的全球预报系统基于NEMO V3.0模式发展,水平网格采用全球版本ORCA(三极点)网格。目前使用NEMOVAR数据同化系统,采用3DVAR-FGAT方法,同化窗口为5天。NEMOVAR同化的数据包括温度、盐度、沿轨卫星高度和海冰密集度。2013年对该系统进行了以下4个方面的改进:增加海洋分辨率;改进海浪—海洋耦合;耦合起始时间从第0天开始;改进耦合数据同化系统。
3.2.3 日本
日本气象厅于1995年开始发展业务化海洋资料同化系统ODAS,其目的主要是为了监测和预报ENSO,2003年6月该系统进行了升级改造。2008年3月日本气象厅气象研究所研发的MRI.COM替换了原有的预报分析系统。MRI.COM是σ-z坐标的全球海洋模式,其水平分辨率在低纬地区(6°S~6°N)为0.3°,中高纬地区为1°。基于三维变分方法搭建变分同化MOVE系统[39~41],为预报提供初始场。该预报系统垂直50层,最大水深5 000 m。其同化数据不仅包含了GTS中台站报和船舶报等实测数据,还包含卫星观测的海表温度和高度,以及Argo浮标数据。系统每5天同化1次,预报时效为30天。
3.2.4 澳大利亚
澳大利亚海洋模式分析和预报系统(Ocean Model Analysis and Prediction System,Ocean-MAPS)[42]是通过BLUElink项目由澳大利亚气象局、联邦科学与工业研究组织(Commonwealth Scientific and Industrial Research Organisation,CSIRO)和澳大利亚海军共同开发和使用的业务化海洋预报系统,2007年8月开始业务化运行,2012年预报系统进行了升级改造。由基于美国地球流体动力实验室(Geophysical Fluid Dynamics Laboratory,GFDL)的MOM4模式[43]搭建的澳大利亚海洋预报模式OFAM (Ocean Forecast Australian Model)[44]和基于集合最优插值的海洋数据同化系统(The Bluelink Ocean Data Assimilation System,BODAS)组成。Ocean-MAPS还采用了一套新的非线性或自适应性初始化方案[45]。系统覆盖了全球75°S~75°N的区域,MOM4模式采用变网格,水平网格分辨率在澳大利亚海域(90°~180°E, 16°N~75°S)是0.1°×0.1°涡分辨率,其他海域为1°分辨率。垂向为51层,海表3层分辨率为5 m。目前的Ocean-MAPS由澳大利亚气象局业务化全球大气系统的通量强迫。系统从单纯的海洋环流预报增加到生物地球化学的预报,下一阶段可能发展与北极海冰模式的耦合[46]。
3.2.5 中国
国家海洋环境预报中心2013年研发并建立了我国首个涵盖全球大洋的数值预报系统,该全球海洋预报系统由动力模式和同化系统2个部分组成。其海洋动力数值模式采用美国地球流体动力学实验室开发的MOM4[43]全球海洋模式,模式水平分辨率为全球1/4°×1/4°,达到全球1/4°涡相容水平分辨率,在赤道区域实现分辨中尺度过程。模式垂向分为50层,在225 m以上分辨率为10 m,最大水深取为5 500 m。模式采用OCCAM0.2度地形,水平网格设计时采取三极点网格,可以有效消除北极奇点。全球海洋预报系统的资料同化系统,基于三维变分同化方案[47~49]构建。模式中的采用Sea Ice Simulator[50]海冰模块,考虑上层海冰的热容量和融解热守恒,并采用3层垂直结构和弹—黏—塑性(EVP)流变学本构关系。模式改进了水平黏性系数、海气交换通量等参数化方案,利用非Boussinesq近似方法[51],保证了运动学、动力学和物理上的质量守恒,中性示踪物采用Gent-McWilliams斜扩散[52],垂直混合方案采用KPP(K-Profile Parameterization)垂直混合方案[23],并引入非破碎波浪导致的垂向混合,将浪潮流耦合技术引进到全球MOM4模式中,考虑了潮汐强迫,改善垂直混合方案。模式考虑了全球径流淡水输入。采用美国GFS分辨率为0.5°逐6 h的全球海表面风场和热力强迫的预报场进行业务化运行,预报时效为7天。
表1 国内外全球业务化海洋预报系统
Table 1 Global operational oceanography forecasting systems
| 系统名称 | 国家 | 海洋模式 | 水平分辨率 | 垂向层数/层 | 数据同化方案 | 海冰模式 | 大气强迫 | 预报时效/天 |
|---|---|---|---|---|---|---|---|---|
| RTOFS | 美国 | HYCOM | 1/12° | 32 | NCODA (3DVAR) | Energy Loan | NCEP GFS 3 h HWRF | 8 |
| GOFS | 美国 | HYCOM | 1/12° | 32 | NCODA (3DVAR) | 海军全球环境模式 NAVGEM | 7 | |
| PSY4 | 法国 | NEMO 3.1 | 1/12° | 50 | SAM2V1-3DVAR 大尺度温度、盐度误差订正 | LIM2_EVP | ECMWF 3 h分析 场和预报场 | 14 |
| FOAM | 英国 | NEMO 3.2 | 1/4° | 75 | NEMOVAR (3DVAR) | CICE | Met Office 3 h数值 天气预报 | 7 |
| ECMWF | 欧洲 | NEMO 3.0 | 1° | 42 | NEMOVAR (3DVAR-FGAT) | ECMWF业务 数值预报场 | 18 | |
| MOVE/MRI. COM-G | 日本 | MRI.COM v3.4 | 0.3°~1° | 50 | MOVE(3DVAR) | 气候态月 平均 | JRA55-JCDAS 6 h | 30 |
| Ocean-MAPS | 澳大利亚 | MOM4 | 1/10°~1° | 51 | BODAS (ensenble OI) | ACCESS-GAPS1 ERA-Interim | 7 | |
| CGOFS | 中国 | MOM4 | 1/4° | 50 | 3DVAR | NCEP GFS 6 h | 7 | |
| CONCEPTS | 加拿大 | NEMO 3.1 | 1/4° | 50 | SAM2-ice 3DVAR | CICE | GEM 逐小时 | 10 |
| INDOFOS | 印度 | MOM4 | 1/2°×(1/3°~1°) | 40 | 3DVAR | NCEP GFS 6 h | 5 |
3.2.6 其他
加拿大的全球预报系统CONCEPTS[53,54](Canadian Operational Network of Coupled Environmental Prediction Systems)是NEMO-CICE耦合系统,基于NEMO3.1版本[28]和CICE4.0版本[32]构建,每天提供10天的全球海冰和海洋分析和预报。印度的全球预报系统(Indian Ocean Forecast System,INDOFOS)[55]满足了印度对海洋预报的迫切需求。
各国全球海洋预报系统取得较大进展,在海洋模式分辨率和复杂性等多方面都有显著改善,并采用更准确的数据同化方案,提供近实时的全球海洋预报产品。但在业务应用中仍需不断地改进和完善全球预报系统[6]。在未来几年中,将通过增加模式分辨率、改进未解决物理过程的参数化方案和集合预报等3个方面,对全球海洋预报系统的预报产品质量进行改善和提高。
全球海洋模式涡相容(1/12°)和涡识别的分辨率区别取决于Rossby变形半径,海洋斜压Rossby变形半径远小于同纬度大气斜压Rossby变形半径,其在全球不同区域从几千米变化到几百千米。模拟海洋中小尺度现象需要较高的模式水平分辨率,需要在2个模式网格间分辨第一斜压Rossby变形半径[56],以更好地模拟中尺度涡、沿岸流、海洋锋等海洋中小尺度过程[57~61]。模式水平分辨率的提高意味着计算量以级数倍增加,这需要高性能并行技术优化海洋模式,提高计算速度和效率。随着高性能计算能力的提高,目前使用具有涡相容分辨率网格的全球海洋模型的短期到中期预报是可以负担的。
全球预报系统所采用的海洋模式,在锋面、不稳定过程[62]和海表面附近的剪切峰值[63]以及能力向海洋惯性波传播[64]这些物理过程的模拟中有许多不确定性。需要采用大量中尺度的模拟来改进和完善物理过程参数化方案[65,66]。同时需要改进全球海洋模式海气交换通量、海洋水平和垂向混合等关键物理过程参数化方案,设置更接近实际的海洋模式;发展海洋—大气、海浪—海洋、海流—海冰耦合模式,建立全球模式与区域模式的双向嵌套;发展海洋环境多学科要素预报,实现物理海洋模式和生态模式的耦合。
改进数据同化技术[57,67],利用各种海洋水文常规、非常规现场观测资料和卫星遥感数据,研究海洋多源观测资料特别是海洋卫星遥感资料数据同化方法,优化海洋环流预报初始化系统,提高预报准确率和预报时效[68]。由于分辨海洋中尺度过程需要大量计算资源,全球海洋预报集合预报系统比天气预报和季节性集合预报系统发展要慢。随着计算能力的提高,开发全球系统集合预报系统是可行的,将为全球预报系统的不确定性和可预测性提供有价值的评估和分析。
近年来,为了增强高性能计算能力,硬件设计呈现出众核异构化的趋势[69],异构架构下的程序如何编写,是众核异构系统需要解决的重要问题。目前海洋模式系统软件都是基于MPI消息传递机制实现大规模并行,能够通用于多核架构的高性能计算机系统,但对于众核异构计算机系统的并行研究工作刚刚起步,在并行模型理论研究、并行算法设计和实现上距离实用还有很大距离。非常有必要建立适合海洋模式的大规模异构并行模型,针对众核的并行编程模型,实现多级并行机制。对海洋专业领域算法的应用程序进行新的算法设计,相应的程序开发标准也需要进一步规范和完善。
发展海洋—大气耦合预报系统,组成各成员间即时相互交换信息的有机系统。核心技术是实现高效的海气通量及相关参数在子模式之间的交互传递,并保证整个耦合系统质量和能量的守恒,克服由于在耦合界面上各种通量的误差在耦合过程中不稳定增长而导致的气候漂移问题[70]。另一具挑战性的领域是发展耦合数据同化技术,正确处理海洋和大气环境中的不同时间和空间尺度,探索解决耦合模型偏差的方法,优化耦合协方差的权重,建立耦合同化方法和系统, 解决由海洋和大气分别同化所带来的不协调问题。通过全球海—气耦合预报系统的建立,同步实现海洋—大气耦合“天气”预报。
The authors have declared that no competing interests exist.
| [1] |
Status and future of global and regional ocean prediction systems [J].
Operational evolution of global and regional ocean forecasting systems has been extremely significant in recent years. Global Ocean Data Assimilation Experiment (GODAE) Oceanview supports the national research groups providing them with coordination and sharing expertise among the partners. Several systems have been set up and developed pre-operationally, and the majority of these are now fully operational; at the present time, they provide medium- and long-term forecasts of the most relevant ocean physical variables. These systems are based on ocean general circulation models and data-assimilation techniques that are able to correct the model with the information inferred from different types of observations. A few systems also incorporate a biogeochemical component coupled with the physical system, while others are based on coupled ocean090009wave090009ice090009atmosphere models. The products are routinely validated with observations in order to assess their quality. Data and product implementation and organization, as well as service, for users have been well tried and tested, and most of the products are now available to users. The interaction with different users is an important factor in the development process. This paper provides a synthetic overview of the GODAE OceanView prediction systems.
|
| [2] |
Operational Oceanography in the 21st Century [M]. |
| [3] |
Validation and intercomparison studies within GODAE [J].
During the Global Ocean Data Assimilation Experiment, seven international operational centers participated in a dedicated modeling system intercomparison exercise from February to April 2008. The objectives were: (1) to show GODAE global-ocean and basin-scale forecasting systems of different countries in routine interaction and continuous operation, (2) to assess the quality and perform scientific validation of the ocean analyses and the forecasting performance of each system, and (3) to learn from this exercise in order to increase interoperability and collaboration in real time. The validation methodology has steadily improved through several validation experiments and projects performed within the operational oceanography community. It relies on common approaches and standardization of outputs, with a set of diagnostics based on fully detailed metrics that characterize its strengths and weaknesses, but also provide error levels for ocean estimates. The ocean forecasting systems provide daily fields of mesoscale water mass distribution and ocean circulation, with an option for sea-ice variations. We present a subset of the intercomparisons performed over different areas, showing general ocean circulation in agreement with known patterns. We also present some accuracy assessments through comparison with observed data.
|
| [4] |
GODAE: The Global Ocean Data Assimilation experiment [J].
ABSTRACT The Global Ocean Data Assimilation Experiment (GODAE) will conduct its main demonstration phase from 2003 to 2005. From 2003 to 2005, operational and research institutions from Australia, Japan, United States, United Kingdom, France and Norway will be performing global oceanic data assimilation and ocean forecast in order to provide regular and comprehensive descriptions of ocean fields such as temperature, salinity and currents at high temporal and spatial resolution. A central objective of GODAE is to provide an integrated description that combines remote sensing data, in-situ data and models through data assimilation. Climate and seasonal forecasting, navy applications, marine safety, fisheries, the offshore industry and management of shelf/coastal areas are among the expected beneficiaries of GODAE. The integrated description of the ocean that GODAE will provide will also be highly beneficial to the research community. An overview of GODAE will be given; we will detail the GODAE objectives and strategy and the way it is implemented as an international experiment. Results from first pre-operational or prototype systems will finally be shown.
|
| [5] |
An introduction to GODAE OceanView [J].
Real-time operational predictions of the major ocean basins which resolve the ocean mesoscale at mid-latitudes have become established in more than a dozen countries over the last 15 years. These predictions depend on the global ocean observing system (particularly satellite altimeters and the Argo profiling float system), high performance computers and sophisticated ocean models and data assimilation systems. They support an expanding range of information services for operations at sea, weather forecasts and protection of the environment. GODAE Oceanview (GOV) assists the groups developing these predictions. This paper provides an introduction to GOV and the papers in this special issue.
|
| [6] |
Synthesis of new scientific challenges for GODAE OceanView [J].
The marine environment plays an increasingly important role in shaping economies and infrastructures, and touches upon many aspects of our lives, including food supplies, energy resources, national security and recreational activities. Global Ocean Data Assimilation Experiment (GODAE) and GODAE OceanView have provided platforms for international collaboration that significantly contribute to the scientific development and increasing uptake of ocean forecasting products by end users who address societal issues such as those listed above. Many scientific challenges and opportunities remain to be tackled in the ever-changing field of operational oceanography, from the observing system to modelling, data assimilation and product dissemination. This paper provides a brief overview of past achievements in GODAE OceanView, but subsequently concentrates on the future scientific foci of GODAE OceanView and its Task Teams, and provides a vision for the future of ocean forecasting.
|
| [7] |
Development trend and strategy of ocean observing capability [J].海洋观测能力建设的现状、趋势与对策思考 [J].
海洋观测是海洋科学发展的基础和重要支撑,海洋科学的创新发展在很大程度上依赖于海洋观测能力的提升。介绍了国际海洋观测能力的现状和趋势,提出了目前海洋观测能力建设所面临的挑战。针对我国海洋科学发展的需求和海洋观测能力存在的差距,提出了对策思考。
|
| [8] |
The current status of the real-time in situ Global Ocean Observing System for operational oceanography [J].
The GODAE-OceanView collection of papers primarily concerns the development of ocean data-assimilation models for operational oceanography. However, these models cannot function without a secure supply ofin situocean data in near real-time. Several projects and programmes supply such data. The purpose of this paper is to review these data sources and describe the history, present status, future and robustness of these programmes. The conclusion is that though challenges continue with some components of the Global Ocean Observing System, overall the system continues to evolve and improve. The data are available in real-time to drive assimilation models, and expectations are increasing for more observational data. The prospects for the next 10 years seem to be good. All of the systems are evolving and there is little doubt that the Global Ocean Observing System will look different 10 years from now as new technologies emerge and capabilities improve.
|
| [9] |
Use of satellite observations for operational oceanography: Recent achievements and future prospects [J].
The paper gives an overview of the development of satellite oceanography over the past five years focusing on the most relevant issues for operational oceanography. Satellites provide key essential variables to constrain ocean models and/or serve downstream applications. New and improved satellite data sets have been developed and have directly improved the quality of operational products. The status of the satellite constellation for the last five years was, however, not optimal. Review of future missions shows clear progress and new research and development missions with a potentially large impact for operational oceanography should be demonstrated. Improvement of data assimilation techniques and developing synergetic use of high resolution satellite observations are important future priorities.
|
| [10] |
The development course and trend of ocean remote sensing satellite [J].海洋遥感卫星发展历程与趋势展望 [J]. |
| [11] |
Argo global observation network and studies of upper ocean structure, variability and predictability [J].全球实时海洋观测网(Argo)与上层海洋结构、变异及预测研究 [J].
围绕国家重点基础研究发展计划项目"基于全球实时海洋观测计划(Argo)的上层海洋结构、变异及预测研究",首先介绍Argo这一新型全球海洋观测网给海洋和大气科学带来的发展机遇以及我们面临的挑战,接着阐述项目重点研究区域西北太平洋和热带印度洋—太平洋的国内外进展,最后给出了项目的关键科学问题和主要研究内容。
|
| [12] |
GODAE systems in operation [J].
During the last 15 years, operational oceanography systems have beendeveloped in several countries around the world. These developments have beenfostered primarily by the Global Ocean Data Assimilation Experiment (GODAE),which coordinated these activities, encouraged partnerships, and facilitatedconstructive competition. This multinational coordination has been very beneficialfor the development of operational oceanography. Today, several systems provideroutine, real-time ocean analysis, forecast, and reanalysis products. These systemsare based on (1) state-of-the-art Ocean General Circulation Model (OGCM)configurations, either global or regional (basin-scale), with resolutions that rangefrom coarse to eddy-resolving, and (2) data assimilation techniques ranging fromanalysis correction to advanced three- or four-dimensional variational schemes. Thesesystems assimilate altimeter sea level anomalies, sea surface temperature data, andin situ profiles of temperature and salinity, including Argo data. Some systems haveimplemented downscaling capacities, which consist of embedding higher-resolutionlocal systems in global and basin-scale models (through open boundary exchange ofdata), especially in coastal regions, where small scale-phenomena are important, andalso increasing the spatial resolution for these regional/coastal systems to be able toresolve smaller scales (so-called downscaling). Others have implemented couplingwith the atmosphere and/or sea ice. This paper provides a short review of theseoperational GODAE systems.
|
| [13] |
Global ocean forecasting and scientific big data [J].全球海洋预报与科学大数据 [J]. |
| [14] |
|
| [15] |
Development of data assimilation and its application in ocean science [J].资料同化技术的发展及其在海洋科学中的应用 [J]. |
| [16] |
Status and future of data assimilation in operational oceanography [J].
The GODAE OceanView systems use various data assimilation algorithms, including 3DVar, EnOI, EnKF and the SEEK filter with a fixed basis, using different time windows. The main outputs of the operational data assimilation systems, the increments, have been compared for February 2014 in various regions. The eddy-permitting systems芒聙聶 increments are similar in a number of the regions, indicating similar forecast errors are being corrected, while the eddy-resolving systems represent smaller-scale structures in the mid-latitude regions investigated and appear to have smaller biases. Monthly average temperature increments show significant SST biases, particularly in the systems which assimilate swath satellite SST data, indicating systematic errors in the surface heat fluxes and the way in which they are propagated vertically by the ocean models. On-going developments to the data assimilation systems include improvements to the specification of error covariances, improving assimilation of data near the equator, and understanding the effect of assimilation on the Atlantic Meridional Overturning Circulation. Longer term developments are expected to include the implementation of more advanced algorithms to make use of flow-dependent error covariance information. Assimilation of new data sources over the coming years, such as wide-swath altimetry, is also expected to improve the accuracy of ocean state estimates and forecasts provided by the GODAE OceanView systems.
|
| [17] |
Review of the application of ocean data assimilation and data fusion techniques [J].海洋数据同化与数据融合技术应用综述 [J].
简述了不同数据同化和数据融合方法在海洋环境监测与预测方面的应用、国内外相关业务单位的海洋分析和预报系统的现状,以及海洋数据同化将来的业务化应用的发展趋势.四维变分和集合卡尔曼滤波正在成为国际上海洋环境分析与预报的主要应用方向,海-气耦合数据同化以及海冰数据同化是目前数据同化方法研究的热点.
|
| [18] |
US navy operational global ocean and Arctic ice prediction systems [J].
The US Navys operational global ocean nowcast/forecast system is presently comprised of the 0.08掳 HYbrid Coordinate Ocean Model (HYCOM) and the Navy Coupled Ocean Data Assimilation (NCODA). Its high horizontal resolution and adaptive vertical coordinate system make it capable of producing nowcasts (current state) and forecasts of oceanic weather, which includes three-dimensional ocean temperature, salinity, and current structure; surface mixed layer depth; and the location of mesoscale features such as eddies, meandering currents, and fronts. It runs daily at the Naval Oceanographic Office and provides seven-day forecasts that support fleet operations, provide boundary conditions to higher resolution regional models, and are available to the community. Using a data-assimilative hindcast and series of 14-day forecasts for 2012, the system is shown to have forecast skill of the oceanic mesoscale out to about 10 days for the Gulf Stream region and to 14+ days for the global ocean and other selected subregions. Forecast skill is sensitive to the type of atmospheric forcing (i.e., operational vs. analysis quality). Subsurface temperature bias is small ( 0.25掳C) and root mean square error peaks at the depth range of the mixed layer and thermocline. Coupled to the Community Ice CodE (CICE) on the same grid, the HYCOM/CICE/NCODA system (initially restricted to the Arctic) provides sea ice nowcasts and forecasts. Ice edge location errors are improved from the previous sea ice prediction system but are limited in part by the accuracy of the satellite observations it assimilates.
|
| [19] |
Validation Test Report for the Global Ocean Prediction System V3.0-1/12° HYCOM/NCODA: Phase I[R]. Naval Research Laboratory, Oceanography Division,
|
| [20] |
Validation Test Report for the Global Ocean Forecast System V3. 0-1/12° HYCOM/NCODA: Phase II[R]. Naval Research Laboratory, Oceanography Division, |
| [21] |
Development and application of the Chinese global operational oceanography forecasting syste [J].中国全球业务化海洋学预报系统的发展和应用 [J].
中国全球业务化海洋学预报系统是国家海洋环境预报中心在国内首次构建的全球—大洋—近海3级嵌套的全球业务化海洋学预报系统体系,系统稳定高效业务运行,通过多种方式实时提供和发布全球多尺度多要素的海流、海浪、海温、海冰、海面风场等预报产品,实现了全球海域范围内从百公里级到公里级空间分辨率的一体化预报业务全覆盖。全球业务化海洋学预报系统从全球尺度、大洋尺度到中国周边海域包括8个子系统:全球海面风场数值预报子系统、全球海洋环流数值预报子系统、全球海浪数值预报子系统、全球潮汐潮流数值预报子系统、印度洋海域海洋环境数值预报子系统、极地海冰数值预报子系统、中国周边海域精细化海洋环境数值预报子系统、全球海洋环境预报业务化集成支撑子系统。该系统紧密结合我国经济社会发展和军事保障需求,在“雪龙号”极地遇险脱困预报保障、马航MH370失联飞机搜救预报保障、“蛟龙号”多次深潜海试预报保障、日本福岛“3.11”地震海啸核泄漏影响评估等重大事件的预报保障任务中发挥了至关重要的作用,为我国实施海洋强国战略,维护国家海洋权益、保障涉海安全生产、应对海上突发事件等提供有力的科技支撑。
|
| [22] |
Development of global ocean general circulation numerical forecasting system in China [J].一个基于MOM的全球海洋数值同化预报系统 [J]. |
| [23] |
Oceanic vertical mixing: A review and a model with a nonlocal boundary layer parameterization [J].
If model parameterizations of unresolved physics, such as the variety of upper ocean mixing processes, are to hold over the large range of time and space scales of importance to climate, they must be strongly physically based. Observations, theories, and models of oceanic vertical mixing are surveyed. Two distinct regimes are identified: ocean mixing in the boundary layer near the surface under a variety of surface forcing conditions (stabilizing, destabilizing, and wind driven), and mixing in the ocean interior due to internal waves, shear instability, and double diffusion (arising from the different molecular diffusion rates of heat and salt). Mixing schemes commonly applied to the upper ocean are shown not to contain some potentially important boundary layer physics. Therefore a new parameterization of oceanic boundary layer mixing is developed to accommodate some of this physics. It includes a scheme for determining the boundary layer depth h, where the turbulent contribution to the vertical shear of a bulk Richardson number is parameterized. Expressions for diffusivity and nonlocal transport throughout the boundary layer are given. The diffusivity is formulated to agree with similarity theory of turbulence in the surface layer and is subject to the conditions that both it and its vertical gradient match the interior values at h. This nonlocal 090008K profile parameterization090009 (KPP) is then verified and compared to alternatives, including its atmospheric counterparts. Its most important feature is shown to be the capability of the boundary layer to penetrate well into a stable thermocline in both convective and wind-driven situations. The diffusivities of the aforementioned three interior mixing processes are modeled as constants, functions of a gradient Richardson number (a measure of the relative importance of stratification to destabilizing shear), and functions of the double-diffusion density ratio, R0301. Oceanic simulations of convective penetration, wind deepening, and diurnal cycling are used to determine appropriate values for various model parameters as weak functions of vertical resolution. Annual cycle simulations at ocean weather station Papa for 1961 and 19690900091974 are used to test the complete suite of parameterizations. Model and observed temperatures at all depths are shown to agree very well into September, after which systematic advective cooling in the ocean produces expected differences. It is argued that this cooling and a steady salt advection into the model are needed to balance the net annual surface heating and freshwater input. With these advections, good multiyear simulations of temperature and salinity can be achieved. These results and KPP simulations of the diurnal cycle at the Long-Term Upper Ocean Study (LOTUS) site are compared with the results of other models. It is demonstrated that the KPP model exchanges properties between the mixed layer and thermocline in a manner consistent with observations, and at least as well or better than alternatives.
|
| [24] |
Operational multivariate ocean data assimilation [J].
Abstract A fully three-dimensional, multivariate, optimum-interpolation ocean data assimilation system has been developed that produces simultaneous analyses of temperature, salinity, geopotential and vector velocity. The system is run in real-time, and can be executed as a stand-alone analysis or cycled with an ocean forecast model in a sequential incremental update cycle. Additional capabilities have been built into the system, including flow-dependent background-error correlations and background-error variances that vary in space and evolve from one analysis cycle to the next. The ocean data types assimilated include: remotely sensed sea surface temperature, sea surface height, and sea-ice concentration; plus in situ surface and sub-surface observations of temperature, salinity, and currents from a variety of sources, such as ships, buoys, expendable bathythermographs, conductivity鈥搕emperature鈥揹epth sensors, and profiling floats. An ocean data quality-control system is fully integrated with the multivariate analysis, and includes feedback of forecast fields and prediction errors in the quality control of new observations. The system is operational at the US Navy oceanographic production centres both in global and in regional applications. It is being implemented as the data assimilation component of the Hybrid Coordinate Ocean Model as part of the US contribution to the Global Ocean Data Assimilation Experiment, and in a limited-area ensemble-based forecasting system that will be used in an adaptive sampling, targeted observation application. Copyright 漏 2005 Royal Meteorological Society
|
| [25] |
Data Assimilation for Atmospheric, Oceanic and Hydrologic Applications(Vol. II) [M]. |
| [26] |
Global numerical weather prediction at the National Meteorological Center [J].
The characteristics of the operational global analysis and prediction system at the National Meteorological Center (NMC), recent improvements, the performance in short-, medium-, and extended-range forecasting, and current areas of research are presented. Two types of global forecasts are produced daily at NMC: the aviation 3-day forecasts and the 10-day medium-range forecasts. Dynamic extended-range (more than 10 days) forecasting experiments are considered. The systematic characteristics of the NMC model climatology as shown in a 1 yr integration of a T40 model are reviewed, followed by a discussion of results from an extensive winter Dynamic Extended Range Forecast experiment performed during the winter of 1986/87 and a description of some recent experiments performed for the period of the North American drought of 1988. 57 refs.
|
| [27] |
Overview of US naval operational ocean forecasting system [J].美国海军海洋业务预报纵览 [J].
回顾了过去几十年美国海军海洋学的发展历程,介绍了海军海洋学业务保障体系,对其科研机构和研发机制以及业务系统发展特点进行总结,同时指出美国海军海洋预报业务系统和总体科研发展规划。通过深入分析国外海洋气象科技发展的最新动态和海洋气象预报业务科研建设的最新成果,对我国海洋气象事业的业务发展和科研规划提供有价值的参考。
|
| [28] |
Ocean Dynamics Component: NEMO-OPA. Preliminary Version[R]. |
| [29] |
Data assimilation in operational ocean forecasting systems: The MERCATOR and MERSEA developments [J]. |
| [30] |
SAM2: The second generation of Mercator assimilation system [C]∥II |
| [31] |
|
| [32] |
CICE: The Los Alamos Sea Ice model[R].Documentation and software users manual, Version 4.1 (LA-CC-06-012), T-3 Fluid Dynamics Group, |
| [33] |
The NEMOVAR Ocean Data Assimilation System as Implemented in the ECMWF Ocean Analysis for System 4[R]. |
| [34] |
A variational data assimilation system for the NEMO ocean model [J].
react-text: 449 The comparison of prediction errors in geopotential height, temperature, and precipi- tation forecasts is made quantitatively to evaluate medium-range forecast skills between Global Seasonal Forecasting System version 5 (GloSea5) and Unified Model (UM) in operation by Korea Meteorological Administration during 2014. In addition, the performances in prediction of sea surface temperature anomaly... /react-text react-text: 450 /react-text [Show full abstract]
|
| [35] |
Data assimilation in the FOAM operational short-range ocean forecasting system: A description of the scheme and its impact [J].
Abstract A detailed description of the data assimilation scheme used in the Forecasting Ocean Assimilation Model (FOAM) operational ocean forecasting system is presented. The theoretical basis for the scheme is an improved version of the analysis correction scheme, which includes information from previously assimilated data. The scheme requires the a priori specification of error covariance information for the background model field and the observations. The way in which these error covariances have been estimated is described and some examples are given. The FOAM system assimilates sea surface temperature, sea-level anomaly, temperature profile, salinity profile and sea-ice concentration data. Aspects of the scheme that are specific to each of these observation types are described. Two sets of experiments demonstrating the impact of the data assimilation are presented. The first set are in an idealized identical-twin setting, using the 掳 -resolution North Atlantic FOAM configuration in which the state of the true ocean is assumed to be known. These experiments show that the analyses and forecasts are improved by assimilating the altimeter sea-level-anomaly data. The second set of experiments comprise data impact studies in a realistic hindcast setting. These experiments show a positive impact on the analyses from the Argo temperature- and salinity-profile data. Copyright 漏 2007 Royal Meteorological Society
|
| [36] |
Recent development of the Met Office operational ocean forecasting system: An overview and assessment of the new Global FOAM forecasts [J]. |
| [37] |
Implementing a variational data assimilation system in an operational 1/4 degree global ocean model [J].
Abstract This article describes the implementation of an incremental first guess at an appropriate time three-dimensional variational (3DVAR) data assimilation scheme, NEMOVAR, in the Met Office's operational 1/4 degree global ocean model. NEMOVAR assimilates observations of sea-surface temperature (SST), sea-surface height (SSH), in situ temperature and salinity profiles and sea ice concentration. The Met Office is the first centre to implement NEMOVAR at 1/4 degree and the required developments are discussed, with particular focus on the specification of the background-error covariances. Background-error correlations in NEMOVAR are modelled using a diffusion operator. The horizontal background-error correlations for temperature, salinity and sea ice concentration are parametrized using the Rossby radius, which produces relatively short correlation length-scales at mid to high latitudes, while a flow-dependent mixed-layer depth parametrization is used to define the vertical length-scales for the 3D variables. Results from a one-year reanalysis with NEMOVAR are presented and compared with the preceding operational data assimilation scheme at the Met Office. NEMOVAR is shown to provide significant improvements to SST, SSH and sea ice concentration fields, with the largest improvements seen in regions of high variability such as eddy shedding and frontal regions and the marginal ice zone. This improvement is associated with shorter correlation length-scales in the extratropics and an improved fit to observations in NEMOVAR. Some degradation to subsurface temperature and salinity fields where data are sparse is identified and this will be the focus of future improvements to the system.
|
| [38] |
Describing the Development of the New Foam-nemovar System in the Global 1/4 Degree Configuration[R]. Technical Report 578, |
| [39] |
Data assimilation of sea ice concentration into a global ocean-sea ice model with corrections for atmospheric forcing and ocean temperature fields [J].
A multivariate data assimilation experiment was conducted in order to improve the global representation of both the ocean and sea ice fields through the inclusion of sea ice concentration (SIC) data....
|
| [40] |
Improved analysis of seasonal-interannual fields using a global ocean data assimilation system [J].
Abstract The present study focuses on the recent update of the global ocean data assimilation system in the Meteorological Research Institute (MR1). The model domain of the system is extended to cover the Arctic Ocean with advanced physical processes incorporated (e.g., sea ice). Compared with data-free simulation, data assimilation improves reproduction of the circulation field in the Arctic Ocean, as well as temperature and salinity which are directly modified by data insertion. The system also effectively reproduces the observed sea-ice field. In addition to extending the domain, we have sophisticated statistical information in the global ocean for data assimilation, including coupled temperature-salinity empirical orthogonal function modes in a background error covariance matrix, by incorporating new observational datasets. This improves variability, especially in the salinity field in the tropical Pacific and Indian Oceans, even during the period before the recent increase of salinity observations. The updated system effectively reproduces the oceanic structure associated with the 1997-1998 El Nino. These results will likely contribute to more accurate seasonal predictions using a coupled atmosphere-ocean model.
|
| [41] |
Meteorological research institute Multivariate Ocean Variational Estimation (MOVE) system: Some early results [J].
The Meteorological Research Institute multivariate ocean variational estimation (MOVE) System has been developed as the next-generation ocean data assimilation system in Japan Meteorological Agency. A multivariate three-dimensional variational (3DVAR) analysis scheme with vertical coupled temperature–salinity empirical orthogonal function modes is adopted. The MOVE system has two varieties, the global (MOVE-G) and North Pacific (MOVE-NP) systems. The equatorial Pacific and western North Pacific are analyzed with assimilation experiments using MOVE-G and -NP, respectively. In each system, the salinity and velocity fields are well reproduced, even in cases without salinity data. Changes in surface and subsurface zonal currents during the 1997/98 El Ni09o event are captured well, and their transports are reasonably consistent with in situ observations. For example, the eastward transport in the upper layer around the equator has 70 Sv in spring 1997 and weakens in spring 1998. With MOVE-NP, the Kuroshio transport has 25 Sv in the East China Sea, and 40 Sv crossing the ASUKA (Affiliated Surveys of the Kuroshio off Cape Ashizuri) line south of Japan. The variations in the Kuroshio transports crossing the ASUKA line agree well with observations. The Ryukyu Current System has a transport ranging from 6 Sv east of Taiwan to 17 Sv east of Amami. The Oyashio transport crossing the OICE (Oyashio Intensive observation line off Cape Erimo) line south of Hokkaido has 14 Sv southwestward (near shore) and 11 Sv northeastward (offshore). In the Kuroshio–Oyashio transition area east of Japan, the eastward transport has 41 Sv (32–36°N) and 12 Sv (36–39°N) crossing the 145°E line.
|
| [42] |
BLUElink> development of operational oceanography and servicing in Australia [J]. |
| [43] |
|
| [44] |
Eddy-resolving ocean circulation in the Asian-Australian region inferred from an ocean reanalysis effort [J].
The first global ocean reanalysis with focus on the Asian–Australian region was performed for the period October 1992 to June 2006. The 14-year experiment assimilated available observations of altimetric sea-level anomaly, satellite SST and quality-controlled in situ temperature and salinity profiles from a range of sources, including field surveys and the Argo float array. This study focuses on dominant circulation patterns in the South-East Asian/Australian region as simulated by an eddy-resolving and data-assimilating ocean general circulation model. New estimates of the ocean circulation are provided which are largely in agreement with the limited number of observations. Transports of key currents in the region are as follows: The total (top-to-bottom) annual mean Indonesian Throughflow transport and its standard deviation are 9.702±024.402Sv from the Pacific to the Indian Ocean with a minimum in January (6.602Sv) and a maximum in April (12.302Sv). The Leeuwin Current along the west coast of Australia is dominated by eddy structures with a mean southward transport of 4.102±022.002Sv at 34°S. Along the southern coast of Australia a narrow shelf edge current known as the South Australian Current advects 4.502±022.602Sv eastward at 130°E. The South Australian Current converges east of Tasmania with the eddy-rich extension of East Australian Current. At 32°S this current transports 36.802±0218.502Sv southward. A dominating feature of the circulation between north-eastern Australia and Papua–New Guinea is the strong and quasi-permanent Coral Sea Gyre. This gyre is associated with the highly variable Hiri Current which runs along the south coast of Papua–New Guinea and advects 8.202±0219.102Sv into the Western Pacific Ocean. All of these transport estimates are subject to strong eddy variability.
|
| [45] |
Adaptive nonlinear dynamical initialization [J]. |
| [46] |
Evaluation of a near-global eddy-resolving ocean model [J].
Analysis of the variability of the last 18 yr (1993-2012) of a 32 yr run of a new near-global, eddy-resolving ocean general circulation model coupled with biogeochemistry is presented. Comparisons between modelled and observed mean sea level (MSL), mixed layer depth (MLD), sea level anomaly (SLA), sea surface temperature (SST), and {\chla} indicate that the model variability is realistic. We find some systematic errors in the modelled MLD, with the model generally deeper than observations, which results in errors in the {\chla}, owing to the strong biophysical coupling. We evaluate several other metrics in the model, including the zonally averaged seasonal cycle of SST, meridional overturning, volume transports through key straits and passages, zonally averaged temperature and salinity, and El Nino-related SST indices. We find that the modelled seasonal cycle in SST is 0.5-1.5 A degrees C weaker than observed; volume transports of the Antarctic Circumpolar Current, the East Australian Current, and Indonesian Throughflow are in good agreement with observational estimates; and the correlation between the modelled and observed NINO SST indices exceeds 0.91. Most aspects of the model circulation are realistic. We conclude that the model output is suitable for broader analysis to better understand upper ocean dynamics and ocean variability at mid- and low latitudes. The new model is intended to underpin a future version of Australia's operational short-range ocean forecasting system.
|
| [47] |
Variation assimilation using satellite data of sea surface temperature and altimeter [J].卫星遥感海表温度资料和高度计资料的变分同化 [J].
利用国家气候中心正在发展的第二代全球海洋资料同化系统(BCC_GODAS2.0), 针对多变量同化的协调性问题, 发展了一种基于三维变分框架(3DVAR)下的高度计和海表温度(SST)相互约束的同化方法。该方法使海面高度和 SST 资料在同一个动力约束关系下进行同化。 在一般方法中, 海面高度和 SST 观测项是代价函数中 2 个独立的观测项, 海面高度项引入动力高度计算公式, 海表温度项用统计关系进行垂向投影。在代价函数的实际求解的计算过程中, 虽然其总体积分效应受海面高度观测的约束, 但整个水柱中各层温盐分析变量的调整是无序的。针对这个问题, 文章提出一种新的同化方案。 该方案将SST的观测项并入海面高度观测项中, 海面高度的一部分, 确切说是上层海洋部分, 由 SST 决定, 因此至少在 SST 的统计关系能影响到深度的上层海洋, 在代价函数的求解过程中, 温盐的调整是受较强的统计关系约束的, 而这种统计关系的有效性已经在很多 SST 的同化试验中被其他学者广泛应用并证明。 利用该方法, 对1993—1997年的AVHRR卫星遥感海表温度资料进行变分同化试验, 用TAO、 OISST 和 SODA 数据集进行检验证明, 通过对卫星遥感资料的同化能够有效改进对海洋温度和盐度的估计。海洋表层的月平均温、盐度的总均方根误差相对同化前分别降低了 0.67℃和 0.2‰。在混合层中, 同化效果较好。
|
| [48] |
Evaluation of a 3dVAR system for the South China Sea [J]. |
| [49] |
Preliminary results of a new global ocean reanalysis [J].
Using a new global ocean reanalysis of the second generation Global Ocean Data Assimilation System of the Beijing Climate Center(BCC_GODAS2.0) spanning the period 1990-2009,we firstly quantify the accuracy of BCC_GODAS2.0 in representing the temperature and salinity by comparing with OISST and SODA data.The results show that the assimilation system may effectively improve the estimations of temperature and salinity by assimilating all kinds of observations,especially in the equatorial eastern Pacific.Moreover,the root mean square errors of monthly temperature and salinity are respectively reduced by 0.53鈩 and 0.28 psu,compared with the model control simulation results.Then,the applicability of this ocean reanalysis for sea surface temperature(SST) anomaly variability in the tropical Pacific is evaluated with the observational HadISST data.The NINO3 index of the new reanalysis shows a good agreement with that of HadISST,with a correlation of 93.6%.Variations in SST from BCC_GODAS2.0 are similar to those obtained from HadISST data along the equator,showing the major large zonal-scale features such as the strong magnitude of seasonal cycle.The amplitude of SST anomaly standard deviation in the equatorial eastern Pacific is also closer to observations(HadISST) than NCEP GODAS does.Besides,the first two leading empirical orthogonal function(EOF) modes of the monthly SST anomalies over the tropical Pacific region are explored.The EOF1 pattern of BCC_GODAS2.0 captures a traditional El Ni o pattern,which improves magnitudes of the positive SST anomaly in the cold tongue of the eastern Pacific.The EOF2 pattern exhibits a El Ni o Modoki pattern.Comparatively,the EOF2 pattern of BCC_GODAS2.0 extends more strongly toward the subtropics.It also overcomes the problem that negative loadings are confined in the narrow equatorial eastern Pacific.Consequently,the magnitude and spatial distribution of the leading EOF patterns of BCC_GODAS2.0 are well consistent with those of HadISST.
|
| [50] |
A reformulated three-layer sea ice model [J].
A model is presented that provides an efficient approximation to sea ice thermodynamics for climate studies. Semtner's three-layer framework is used, but the brine content of the upper ice is represented with a variable heat capacity as is done in more physically based models. A noniterative fully implicit time-stepping scheme is used for calculation of ice temperature. The results of the new model are compared to those of Semtner's original model.
|
| [51] |
Relaxing the boussinesq approximation in ocean circulation models [J].
There is a growing need for ocean circulation models that conserve mass rather than volume (as in traditional Boussinesq models). One reason is bottom pressure data expected to flow from satellite-mounted gravity-measuring instruments, and another is to provide a complete interpretation of data from satellite altimeters such as TOPEX/Poseidon. In this paper, it is shown that existing, hydrostatic Boussinesq ocean model codes can easily be modified, with only a modest increase in the CPU requirement, to integrate the hydrostatic, non-Boussinesq equations. The method can be used to integrate both coarse-resolution and eddy-resolving non-Boussinesq models. The basic equations can also be used to formulate a fully nonhydrostatic, non-Boussinesq model. The method is illustrated for the case of the Parallel Ocean Program (POP), the parallel version of the Bryan鈥揅ox鈥揝emtner code developed at Los Alamos National Laboratory. A comparison of eddy-permitting model solutions under double-gyre wind forcing shows that the error in making the Boussinesq approximation is, reassuringly, only a few percent. The authors also consider a coarse-resolution global ocean model under seasonal forcing. The non-Boussinesq model shows a seasonal variation in global mean sea surface height (SSH) with a range of about 3 cm, attributable mostly to changes in the mass of the ocean due to the freshwater flux forcing, but with a roughly 25% contribution from the steric expansion effect. The seasonal cycles of model-computed SSH are also compared with TOPEX/Poseidon data from the South Pacific and South Atlantic Oceans. It is shown that the seasonal cycle in global mean SSH contributes to the model-computed seasonal cycle, and improves the model performance compared to the data. It is found that the difference between the seasonal cycles in the Boussinesq and non-Boussinesq models is almost entirely accounted for by the seasonal cycle in global mean SSH. On the other hand, on longer timescales the difference field between the non-Boussinesq and Boussinesq models shows spatial variability of several centimeters that is not accounted for by a globally uniform correction to the Boussinesq model.
|
| [52] |
Isopycnal mixing in ocean circulation models [J].
Abstract A subgrid-scale form for mesoscale eddy mixing on isopycnal surfaces is proposed for use in non-eddy-resolving ocean circulation models. The mixing is applied in isopycnal coordinates to isopycnal layer thickness, or inverse density gradient, as well as to passive scalars, temperature and salinity. The transformation of these mixing forms to physical coordinates is also presented.
|
| [53] |
A high-resolution ocean and sea-ice modelling system for the Arctic and North Atlantic oceans [J].
As part of the CONCEPTS (Canadian Operational Network of Coupled Environmental PredicTion Systems) initiative, a high-resolution (1/12°) ice–ocean regional model is developed covering the North Atlantic and the Arctic oceans. The long-term objective is to provide Canada with short-term ice–ocean predictions and hazard warnings in ice-infested regions. To evaluate the modelling component (as opposed to the analysis – or data-assimilation – component, which is not covered in this contribution), a series of hindcasts for the period 2003–2009 is carried out, forced at the surface by the Canadian GDPS reforecasts (Smith et al., 2014). These hindcasts test how the model represents upper ocean characteristics and ice cover. Each hindcast implements a new aspect of the modelling or the ice–ocean coupling. Notably, the coupling to the multi-category ice model CICE is tested. The hindcast solutions are then assessed using a verification package under development, including in situ and satellite ice and ocean observations. The conclusions are as follows: (1) the model reproduces reasonably well the time mean, variance and skewness of sea surface height; (2) the model biases in temperature and salinity show that while the mean properties follow expectations, the Pacific Water signature in the Beaufort Sea is weaker than observed; (3) the modelled freshwater content of the Arctic agrees well with observational estimates; (4) the distribution and volume of the sea ice are shown to be improved in the latest hindcast due to modifications to the drag coefficients and to some degree to the ice thickness distribution available in CICE; (5) nonetheless, the model still overestimates the ice drift and ice thickness in the Beaufort Gyre.
|
| [54] |
Assessment of a NEMO-based hydrodynamic modelling system for the Great Lakes [J].
Environment Canada recently developed a coupled lake–atmosphere–hydrological modelling system for the Laurentian Great Lakes. This modelling system consists of the Canadian Regional Deterministic Prediction System (RDPS), which is based on the Global Environmental Multiscale model (GEM), the MESH () surface and river routing model, and a hydrodynamic model based on the three-dimensional global ocean model Nucleus for European Modelling of the Ocean (NEMO). This paper describes the performance of the NEMO model in the Great Lakes. The model was run from 2004 to 2009 with atmospheric forcing from GEM and river forcing from the MESH modelling system for the Great Lakes region and compared with available observations in selected lakes. The NEMO model is able to produce observed variations of lake levels, ice concentrations, lake surface temperatures, surface currents and vertical thermal structure reasonably well in most of the Great Lakes. However, the model produced a diffused thermocline in the central basin of Lake Erie. The model predicted evaporation is relatively strong in the upper lakes. Preliminary results of the modelling system indicate that the model needs further improvements in atmospheric–lake exchange bulk formulae and surface mixed layer physics.
|
| [55] |
The Indian ocean forecast system [J].
In order to meet the ever growing demand for the prediction of oceanographic parametres in the Indian Ocean for a variety of applications, the Indian National Centre for Ocean Information Services (INCOIS) has recently set-up an operational ocean forecast system, viz. the Indian Ocean Forecast System (INDOFOS). This fully automated system, based on a state-of-the-art ocean general circulation model issues six-hourly forecasts of the sea-surface temperature, surface currents and depths of the mixed layer and the thermocline up to five-days of lead time. A brief account of INDOFOS and a statistical validation of the forecasts of these parametres using in situ and remote sensing data are presented in this article. The accuracy of the sea-surface temperature forecasts by the system is high in the Bay of Bengal and the Arabian Sea, whereas it is moderate in the equatorial Indian Ocean. On the other hand, the accuracy of the depth of the thermocline and the isothermal layers and surface current forecasts are higher near the equatorial region, while it is relatively lower in the Bay of Bengal.
|
| [56] |
Using a resolution function to regulate parameterizations of oceanic mesoscale eddy effects [J].
Mesoscale eddies play a substantial role in the dynamics of the ocean, but the dominant length-scale of these eddies varies greatly with latitude, stratification and ocean depth. Global numerical ocean models with spatial resolutions ranging from 1 degrees down to just a few kilometers include both regions where the dominant eddy scales are well resolved and regions where the model's resolution is too coarse for the eddies to form, and hence eddy effects need to be parameterized. However, common parameterizations of eddy effects via a Laplacian diffusion of the height of isopycnal surfaces (a Gent-McWilliams diffusivity) are much more effective at suppressing resolved eddies than in replicating their effects. A variant of the Phillips model of baroclinic instability illustrates how eddy effects might be represented in ocean models. The ratio of the first baroclinic deformation radius to the horizontal grid spacing indicates where an ocean model could explicitly simulate eddy effects; a function of this ratio can be used to specify where eddy effects are parameterized and where they are explicitly modeled. One viable approach is to abruptly disable all the eddy parameterizations once the deformation radius is adequately resolved; at the discontinuity where the parameterization is disabled, isopycnal heights are locally flattened on the one side while eddies grow rapidly off of the enhanced slopes on the other side, such that the total parameterized and eddy fluxes vary continuously at the discontinuity in the diffusivity. This approach should work well with various specifications for the magnitude of the eddy diffusivities. Published by Elsevier Ltd.
|
| [57] |
An operational Eddy resolving 1/16° global ocean nowcast/forecast system [J].
A real-time eddy-resolving global ocean nowcast/forecast system has been running at the Naval Oceanographic Office (NAVOCEANO) since 18 October 2000 and it became an operational product on 27 September 2001. The system, which was developed at the Naval Research Laboratory (NRL), uses the NRL Layered Ocean Model (NLOM) with 1/16掳 resolution and seven layers in the vertical. Real-time satellite altimeter sea surface height (SSH) from TOPEX/Poseidon, ERS-2 and Geosat-Follow-On provided by NAVOCEANO's Altimeter Data Fusion Center, are assimilated into the model. The large size of the model grid (4906脳2304脳7) and operational requirements makes it necessary to use a computationally efficient ocean model and assimilation scheme. The assimilation consists of an optimum interpolation (OI) deviation analysis of SSH with the model as a first guess, a statistical inference technique for vertical mass field updates, geostrophic balance for the velocity updates outside the equatorial region and an incremental updating of the model fields to further reduce gravity wave generation. A spatially varying mesoscale covariance function determined from TOPEX/Poseidon and ERS-2 data is used in the OI analysis. The sea surface temperature (SST) assimilation consists of relaxing the NLOM SST to the Modular Ocean Data Assimilation System (MODAS) SST analysis which is performed daily at NAVOCEANO. Real-time and archived results from the model can be viewed at the NRL Website http://www.ocean.nrlssc.navy.mil/global_nlom. This includes many zoom regions, nowcasts and forecasts of SSH, upper ocean currents and SST, forecast verification statistics, subsurface temperature cross-sections, the amount of altimeter data used for each nowcast from each satellite and nowcast comparisons with unassimilated data. The results show that the model has predictive skill of the mesoscale variability for at least one month.
|
| [58] |
Impact of partial steps and momentum advection schemes in a global ocean circulation model at eddy permitting resolution [J].
The original version of this article unfortunately contained a mistake. The sequence of first and last name of Bernard Barnier was incorrect. The correct sequence is given above.
|
| [59] |
The GODAE/Mercator-Ocean global ocean forecasting system: Results, applications and prospects [J].
The Mercator-Oc脙漏an eddy permitting (1/4) global ocean forecasting system assimilating satellite altimetry is the French contribution to the GODAE project and to the MERSEA project for operational systems. It has run operationally since October 2005 and is forced with daily surface fluxes from ECMWF operational analyses and forecasts. JASON, ERS and GFO altimetry measurements from AVISO were assimilated from January 2005 up to real time. The simulation results are compared with independent in-situ data of the Atlantic, Pacific and Antarctic Ocean basins in order to provide an estimation of the performance of the system. The results are also compared with the Levitus climatology, and with combinations of in-situ and satellite observations since 2005. In the Atlantic basin, the global system is also compared with Mercator-Ocean regional systems that assimilate SST (Sea Surface Temperature), SLA (Sea Level Anomalies) and in situ (temperature and salinity profiles) near real time observations
|
| [60] |
Forecasting the ocean state using NEMO: The new FOAM system [J].
The Forecasting Ocean Assimilation Model (FOAM) deep ocean analysis and forecasting system has been running operationally at the Met Office for over 10 years.The system has recently been transitioned to use the Nucleus for European Modelling of the Ocean (NEMO) community model as its core ocean component. This paper gives an end-to-end description of the FOAM-NEMO operational system and presents some preliminary assessment of operational and hindcast integrations including verification statistics against observations and forecast verification against model best guess fields.Validation of the sea surface height fields is presented, which suggests that the system captures and tracks the major mesoscale features of the ocean circulation reasonably well, with some evidence of improvement in higher-resolution configurations.
|
| [61] |
Mercator Global Eddy Permitting Ocean reanalysis GLORYS1V1: Description and results [J].
react-text: 655 Since a decade ago, Mercator Océan develops and operates different ocean forecasting systems based on OGCM models and advanced data assimilation schemes using in situ and remotely sensed data. In the framework of the European GMES MyOcean project (FP7, 2009-2011), Mercator Océan will become a main contributor for the delivery of regular and systematic information to intermediate users &... /react-text react-text: 656 /react-text [Show full abstract]
|
| [62] |
Langmuir turbulence in the ocean [J]. |
| [63] |
A numerical investigation of resonant inertial response of the ocean to wind events [J].
Abstract A one-dimensional model of upper-ocean vertical mixing is used to investigate the ocean's response to idealized atmospheric storms over short (1–2 day) timescales. Initial ocean conditions are based on observations from the northeast Pacific. When the wind rotation is resonant at the inertial frequency, the surface input of kinetic energy to the currents, KE0, is maximized, as are the net changes in inertial kinetic energy, potential energy, and sea surface temperature. The KE0 is a key air–sea interaction parameter because of its strong dependence on the time histories of the wind forcing and surface current, and because some of this kinetic energy input can go to increasing potential energy when dissipated in regions of large buoyancy gradients below the mixed layer. Energy input and the ocean response are rapidly reduced for less inertial winds, indicating that the upper ocean has highly tuned inertial resonant responses. The degree of tuning is highest for the inertial kinetic energy response...
|
| [64] |
Observations of strong inertial oscillations after the passage of Tropical Cyclone Ofa [J].
One week after Tropical Cyclone Ofa passed near Samoa, near-inertial oscillations of almost 1 m s0908081 in amplitude were observed with a shipboard acoustic Doppler current profiler (ADCP). The velocity was nearly uniform with depth in the upper 80 m. The strongest currents in this layer were found about 300 km from Ofa's track, farther than expected from previous observations and models. Below 80 m was a layer 50090009100 m thick in which the shear exceeded 0.01 s0908081. Strong near-inertial oscillations, with currents over 0.6 m s0908081 from 130 to 200 m, extended through the shear layer to at least 300 m, the limit of the ADCP measurements. The phase of the oscillations propagated upward, consistent with downward propagation of energy. A simple slab model driven by an idealized wind field approximately matches the observed amplitude and phase of the oscillations in the surface layer within 150 km of Ofa's track, but not the stronger current 300 km from the track.
|
| [65] |
Eulerian and eddyinduced meridional overturning circulations in the tropics [J].
Inspired by recent measurements of the eddy-induced Meridional Overturning Circulation in the tropical North Pacific Ocean by Roemmich and Gilson, the authors analyze an oceanic general circulation model for its Eulerian and eddy-induced Meridional Overturning Circulations throughout the Tropics. The model representation for the mesoscale eddy-induced circulation is the parameterization by Gent and McWilliams, and there are also rectified contributions to the time-mean overturning circulation due to seasonal and interannual fluctuations. The eddy-induced circulation is similar in all tropical basins. It has a strength of about 10% of the Eulerian (mainly Ekman) circulation, and its contribution to the meridional heat flux is a similar fraction. The pattern of the meridional streamfunction is one of double cells in the vertical and antisymmetry about the equator. Near the equator there is downwelling above the undercurrent and upwelling below, with the return circulations closed within the upper 250 m and ±5° latitude. Away from the equator in each basin, there are overturning cells with flow in the opposite directions to those nearest the equator, which reach deeper into and through the main pycnocline as well as poleward into the subtropics. Similar to the wind-driven Eulerian Meridional Overturning Circulation, the seasonal cycle in the eddy-induced circulation has a magnitude comparable to the time-mean circulation, although for an entirely different dynamical reason associated with seasonal changes in the buoyancy field that are primarily diabatic. There is also a circulation anomaly during the 1997/98 El Ni09o–Southern Oscillation event that nearly cancels the time-mean, counterrotating, eddy-induced cells nearest the equator and surface. The rather good agreement between the measurements and the model solution gives support to the theory underlying the parameterization of eddy-induced circulation, and it indicates that the associated eddy transport coefficients are larger in the Tropics (i.e., 652 × 10ms) than in middle and high latitudes.
|
| [66] |
Balanced and unbalanced routes to dissipation in an equilibrated Eady flow [J].
The oceanic general circulation is forced at large scales and is unstable to mesoscale eddies. Large-scale currents and eddy flows are approximately in geostrophic balance. Geostrophic dynamics is characterized by an inverse energy cascade except for dissipation near the boundaries. In this paper, we confront the dilemma of how the general circulation may achieve dynamical equilibrium in the presence of continuous large-scale forcing and the absence of boundary dissipation. We do this with a forced horizontal flow with spatially uniform rotation, vertical stratification and vertical shear in a horizontally periodic domain, i.e. a version of Eady's flow carried to turbulent equilibrium. A direct route to interior dissipation is presented that is essentially non-geostrophic in its dynamics, with significant submesoscale frontogenesis, frontal instability and breakdown, and forward kinetic energy cascade to dissipation. To support this conclusion, a series of simulations is made with both quasigeostrophic and Boussinesq models. The quasigeostrophic model is shown as increasingly inefficient in achieving equilibration through viscous dissipation at increasingly higher numerical resolution (hence Reynolds number), whereas the non-geostrophic Boussinesq model equilibrates with only weak dependence on resolution and Rossby number.
|
| [67] |
The Bluelink Ocean Data Assimilation System (BODAS) [J].
Bluelink is Australia’s contribution to the Global Ocean Data Assimilation Experiment (GODAE). The goals of GODAE include the development and application of eddy-resolving, data assimilating ocean forecast systems. In this paper, we describe several aspects of the Bluelink effort that are motivated by this goal. One of the main innovations of Bluelink is the development of the Bluelink ocean data assimilation system (BODAS). The initial test-bed for BODAS is the Bluelink ReANalysis (BRAN), a multi-year model integration with data assimilation. The Bluelink model is a global ocean general circulation model that is eddy-resolving in the Australian region. Observations that are assimilated into BRAN include satellite altimetry, sea-surface temperature and in situ temperature and salinity data from Argo, XBT, TAO and other sources. BODAS is an ensemble optimal interpolation system that uses an ensemble of intraseasonal anomalies from a free running model to estimate the background error covariances (BECs). The ensemble-based BECs are multivariate and inhomogeneous and are shown to reflect the length-scales, the anisotropy and the covariability of mesoscale oceanic processes. We evaluate the performance of BODAS and BRAN (version 1.5), spanning the period January 2003 to June 2006, by comparing reanalyzed fields to a range of satellite-derived and in situ observations. Specifically, we demonstrate that BRAN realistically reproduces the mesoscale circulation around Australia, representing both the broad-scale circulation and, in many instances, the relatively small-scale mesoscale features. Quantitatively, we show that reanalyzed fields in the region around Australia are typically within 6–12 cm of withheld altimetric observations, within 0.5–0.9° of observed sea-surface temperature and within 4–7 cm of observed coastal sea-level. Comparisons with Argo profiles and surface drifting buoys show that BRAN fields are within 1° of observed sub-surface temperature, within 0.15 psu of observed sub-surface salinity and within 0.2 m s 611 of near-surface currents. We identify initialisation as a key area in which the Bluelink system could be improved.
|
| [68] |
Building the capacity for forecasting marine biogeochemistry and ecosystems: Recent advances and future developments [J].
Building the capacity for monitoring and forecasting marine biogeochemistry and ecosystem dynamics is a scientific challenge of strategic importance in the context of rapid environmental change and growing public awareness of its potential impacts on marine ecosystems and resources. National Operational Oceanography centres have started to take up this challenge by integrating biogeochemistry in operational systems. Ongoing activities are illustrated in this paper by presenting examples of (pre-)operational biogeochemical systems active in Europe and North America for global to regional applications. First-order principles underlying biogeochemical modelling are briefly introduced along with the description of biogeochemical components implemented in these systems. Applications are illustrated with examples from the fields of hindcasting and monitoring ocean primary production, the assessment of the ocean carbon cycle and the management of living resources. Despite significant progress over the past 5 years in integrating biogeochemistry into (pre-)operational data-assimilation systems, a sustained research effort is still needed to assess these systems and their products with respect to their usefulness to the management of marine systems.
|
| [69] |
An OpenCL compiler for the Homegrown Heterogeneous Many-core Processor on the Sunway Taihu light [J].面向神威·太湖之光的国产异构众核处理器OpenCL 编译系统 [J]. |
| [70] |
A perspective on earth system model development [J].地球系统模式发展展望 [J].
在调研国际国内气候系统模式的基础上,给出了地球系统模式的定义和它的3个发展阶段:物理气候系统模式、地球气候系统模式和地球系统模式,阐述了未来的地球系统模式发展的战略意义,介绍了国际国内围绕地球系统模式的发展所提出的科学研究计划,并基于政府间气候变化委员会第四次评估报告的参评模式,回顾了国内外地球系统模式发展现状与动态,展望了未来的可能发展方向,希望能对国内的地球气候系统模式发展有所帮助。
|

/
| 〈 |
|
〉 |
