
李天生 , 夏军
, 夏军
1.武汉大学 水资源与水电工程国家重点实验室,湖北 武汉 430072
Li Tiansheng, Xia Jun
中图分类号: P343.1
文献标识码: A
文章编号: 1001-8166(2018)12-1248-11
通讯作者:
收稿日期: 2018-06-24
网络出版日期: 2018-12-10
版权声明: 2018 地球科学进展 编辑部
基金资助:
作者简介:
First author:Li Tiansheng(1994-),male,Baiyin City,Gansu Province,Ph.D student. Research areas include water resource and hydrology. E-mail:2012301580244@whu.edu.cn
作者简介:李天生(1994-),男,甘肃白银人,博士研究生,主要从事水文水资源研究.E-mail:2012301580244@whu.edu.cn
展开
摘要
径流作为水文循环的关键环节,在人类活动影响较小的地区受气候因素控制的同时,也受植被等陆面要素的影响。以珠江流域中上游地区为研究区域,基于Budyko理论具体分析了气候和植被变化对该区域径流的影响。首先应用TFPW-MK方法分析了1981—2013年研究区各要素的变化趋势;其次通过逐步回归拟合参数n,改进了Budyko理论框架下的傅抱璞公式,并基于改进的蒸散发模型模拟计算了区域蒸散发和径流;最后基于敏感性分析方法,分析了区域径流对气象要素和植被要素的敏感性。结果显示:1981—2013年珠江中上游地区平均温度(T)、最高温度(Tmax)和最低温度(Tmin)都存在上升趋势,而径流(Q)、降雨(P)、风速(u2)、相对湿度(RH)呈下降趋势。傅抱璞实际蒸散发计算公式中参数n同时受气候要素P、T、RH、日照时数(S)、u2和植被覆盖指数(NDVI)的制约。敏感性分析结果显示,流域径流对降雨和NDVI具有较高的敏感性,且流域降雨减少是径流减少的主导因素,而NDVI在研究时段没有显著的变化趋势,其对径流减少的贡献不显著。总体而言,气候变化对研究区域径流的影响主要是通过同时改变水文输入要素(降雨、潜在蒸散发)和表针流域特性的参数n来表现,而植被对研究区域径流的影响主要是通过改变表针流域特性的参数n来表现。
关键词:
Abstract
Runoff, which is a key component in the hydrological cycle, is mainly controlled by climate factors and land-surface elements in non-humid regions. The impacts of climate and vegetation changes on runoff based on Budyko hypothesis in the middle and upper reaches of the Pearl River Basin was analyzed in this article. First, the temporal trend of variables in the study area during 1981-2013 was examined by using the Mann-Kendall trend test with trend-free pre-whitening. Second, the relationship of the parameter n in Fu's equation with factors of climate and vegetation coverage was built to reveal the time-variation process of n. Finally, the effects of climatic factors and vegetation coverage on runoff were assessed by analyzing the sensitivity of runoff to each variable. It is found that average temperature (T), maximum temperature (Tmax) and minimum temperature (Tmin) in the study area present an increasing trend while runoff (Q), precipitation (P), wind speed (u2) and relative humid (RH) present decreasing trend. The parameter n in Fu's equation is significantly related to both climatic factors (including precipitation (P), average temperature (T), relative humid (RH), sunshine duration (S), wind speed (u2)) and vegetation coverage index (NDVI). In terms of sensitivity of Runoff (Q) to the variation of each climatic factors and NDVI in the middle and upper reaches of the Pearl River Basin, precipitation (P) and NDVI have the highest sensitivity, followed by other climatic factors. Additionally, the precipitation (P) reduction is the main driving factor to the decline in runoff, while vegetation coverage is another important factor. In general, climate change affects runoff not only by changing the hydrological inputs (precipitation (P) and potential evaporation (PET) but also by altering the watershed characteristics as represented by the parameter n, while the impacts of vegetation coverage on runoff are exerted mainly through the alteration of the watershed characteristics.
Keywords:
随着气候变化、陆面变迁(自然)和人类活动(社会)等的不断加剧,全球水循环受到了直接的影响,这导致包括径流、蒸散发、下渗等在内的水文序列在自然形成的固有规律下,又出现了新的特征[1,2]。径流作为水文循环的关键一环,其在变化环境下的演变规律一直是水文界关注的焦点。在人类活动影响较小的地区,气候和陆面植被的变化是影响区域径流的主导因子。具体而言,气候变化对降水、蒸发、土壤湿度等造成直接影响,进而导致区域径流形成及其时空格局的改变;陆面植被变化通过改变植物截留、蒸散发、下渗、地下水补给等水力学参数[3]与水文要素,直接影响区域径流的演变。因此,在受人类活动影响较小的地区,准确把握径流在气候和陆面植被变化下的演变规律显得尤为重要。
包括温度和地表辐射在内的全球气候变化直接影响陆面蒸散发,间接地影响流域径流变化,许多学者基于水文模型研究分析了气候变化对径流变化的影响。如Chiew等[4]采用SIMHYD模型定量计算了气候变化对澳大利亚东南部区域径流的影响;Mango等[5]利用SWAT模型分析了气候变化和土地利用/土地覆盖变化(Land-Use and Land-Cover Change,LUCC)对马拉河中上游区域径流的影响;冯畅等[6]应用 SWAT 模型, 探讨了气候和土地利用变化对涟水流域径流的影响等。除了气候变化的影响,在人类活动影响较小的区域,径流同时受到陆面植被变化的影响。植被变化对径流的具体影响,不同学者的结论不尽相同:石培礼等[7]和刘晓燕等[8]认为,森林植被的减少会使得绝大多数流域实际蒸散发减少,有效降雨量增加,从而径流增加;反之,植被的增加会消耗更多的水资源,使径流量减少[9]。而有学者认为林地是水源的重要涵养地,有助于流域产水,林地的减少会使得径流量相应减少[10]。由于流域径流往往同时受气候和陆面植被变化的影响,综合分析水循环对气候和陆面植被变化的响应也是许多学者关注的重点,如Liang等[11]和Shao等[12]基于Budyko理论具体探讨了包括区域径流和实际蒸散发在内的水文要素和水循环在气候和植被变化下的演变规律。综合来看,气候变化和植被变迁对区域径流演变的影响是一个相对复杂的问题,其在不同的地区和气候区具有不同的结果。虽然当前有相当数量的相关研究,但该领域的研究尚不成熟,需要进一步深入探索。
珠江流域中上游地区作为受人类活动影响相对较小的区域,气候变化和陆面植被覆盖变迁是影响其水文循环的主要因素。为具体分析该区域径流变化的具体成因和规律,本文首先依据该地区1981—2013年的气象、植被覆盖指数等数据资料,分析了区域径流、实际蒸散发、降雨等其他气象要素和植被覆盖指数在研究时段的变化趋势。其次,将几种气象要素和陆面植被覆盖指数作为自变量,应用多元逐步回归方法拟合得出了傅抱璞公式中参数n的计算式。最后,基于改进的傅抱璞实际蒸散发计算公式和水量平衡公式模拟计算了研究流域径流量,且应用敏感性分析方法具体分析了气候和植被变化对流域径流的具体影响。本研究旨在厘清气候变化和陆面植被变化下的区域径流的变化规律,为珠江流域的生态环境保护、农业合理开发利用、流域水资源的配置与管理等提供参考。
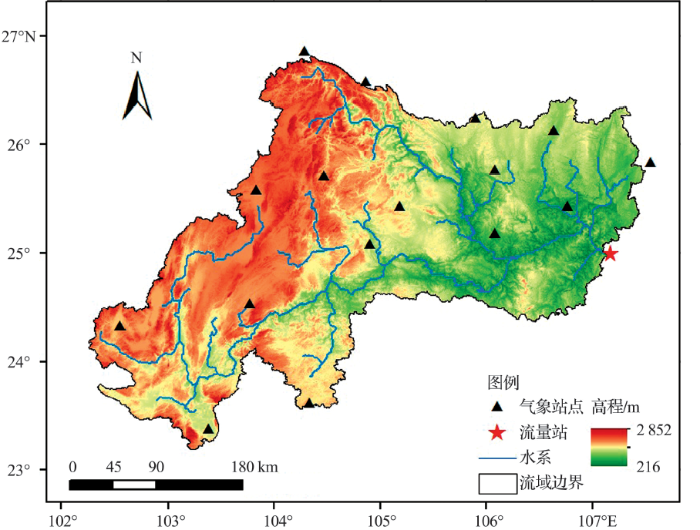
珠江流域位于我国西南部,北靠南岭,南临南海,西部为云贵高原,流域中部丘陵、盆地相间,东南部为三角洲冲积平原,地势西北高,东南低,流域总面积达453 690 km2。珠江流域地处亚热带,气候温和多雨,多年平均温度为1420 ℃,多年平均降雨量为1 2002 200 mm。流域受季风气候影响,降雨年内分配不均匀,地区差异和年际变化较大。近年来,受全球气候变化的影响,珠江流域温度等气候因子显现出明显的变化趋势[13]。这使得流域水文循环发生了一定程度的改变,从而增加了洪涝和干旱等自然灾害发生的概率。本文选取珠江天鹅水文站控制流域为研究区(图1),该区域地处珠江中上游,控制面积为102 199.63 km2。
图1 珠江流域中上游地区示意图
Fig.1 The map of middle and upper reaches of the Pearl River Basin
珠江流域中上游地区下垫面环境在1981—2010年受人类活动的影响较小。根据中国科学院资源环境科学数据中心提供的1980年、1990年、1995年、2000年、2005年和2010年这5期的LUCC数据统计结果,研究区各类土地利用类型(林地、草地、水域、建筑用地、农业用地和未利用土地)比率在1980—2010年变化幅度均很小,都在1%以内。即该区域水文循环过程受农业开发等人类活动影响很小,可以忽略不计。因此,本文主要探究研究区域径流在气候和陆面植被变化情境下的演变规律。
珠江流域中上游地区1981—2013年径流观测资料来自天鹅水文站,气象数据来自中国气象局国家气象中心(http:∥data.cma.cn/data/detail/dataCode/A.0012.0001.html),其中包括珠江中上游地区15个气象站点(分布图如图1所示)的日降雨量(P)、日平均气温(T)、日最低气温(Tmin)、日最高气温(Tmax)、平均气压(Pr)、日照时数(S)、地表平均风速(u2)以及相对湿度(RH)。分别求得所有站点各气象要素的年平均值,接着采用ArcGIS 10.1软件中泰森多边形工具将站点气象数据展布到面上,得到整个研究流域的P,T,Tmin,Tmax,Pr,S,u2和RH的年值。为分析陆面植被对实际蒸散发的影响,本文采用的植被覆盖指数(Normalized Difference Vegetation Index,NDVI)数据是由马里兰大学全球植被覆盖实验室提供的分辨率为8 km的GIMMS-NDVI数据集(https:∥ecocast.arc.nasa.gov/data/pub/gimms)。此外,采用中国科学院资源环境科学数据中心提供的分辨率为8 km的1980年、1990年、1995年、2000年、2005年和2010年5期的LUCC数据集(http:∥www.resdc.cn/data.aspx?DATAID=283)分析区域受农业开发等人类活动的影响。在ArcGIS 10.1 软件中,结合珠江中上游矢量边界,对NDVI和LUCC数据资料进行裁剪、投影等批处理,得到研究区域1981—2013年的NDVI逐年数据以及1980年、1990年、 1995年、2000年、 2005年和2010年5期的LUCC数据。
本文采用TFPW-MK检验方法,对研究区域气象要素和植被覆盖指数等序列进行趋势性检验。TFPW-MK 方法是由MK检验方法改进而来,本节将MK和TFPW-MK检验方法描述如下:
(1)MK检验方法
根据Mann[14]和Kendall[15]研究成果,设一平稳序列Xt(t=1,2,…,n;n为序列长度), MK检验统计量S定义如下:
当n≥10,则统计量S近似服从正态分布,S的均值和方差可以表示为:
由此可得检验统计量ZMK的计算公式:
在显著性水平为α时,若|ZMK|≥Z1-α/2,则零假设不成立,序列有显著变化趋势,其中Z1-α/2是标准正态分布的分位数。本文取显著性水平α=0.5,则
(2)TFPW-MK检验方法
Von Storch 1995年指出,使用MK方法进行序列趋势检验时,会放大存在正自相关性序列的趋势,使得趋势检验结果不准确,为此应在趋势检验前对序列进行预置白处理,来降低原始序列的自相关成分[16]。经过进一步研究改进,Yue 等[17,18]提出TFPW-MK检验方法,在去除序列自相关成分的基础上进行趋势检验,这一方法得到了广泛的应用[19,21],其原理描述如下:
首先,基于原始序列Xt,构建不含趋势项的新序列Yt,并计算Yt的一阶自相关系r1,
式中:β表示原始序列Xi的坡度,n表示数据序列的长度,
其次,由公式(8)判断序列Yt一阶自相关系数r1的大小,
最后,若r1在公式(8)范围内,表示序列Yt是独立的,可以直接应用MK方法对原始序列Xt进行趋势检验,否则认为序列Yt是自相关的,需要采取预置白方法去除序列Yt中的自相关系数,假设残余的序列Yt'是独立的,将趋势项βt和残余项Yt'结合起来,应用公式(9)得到最终序列Yt″,应用MK方法对Yt″进行趋势检验,得到序列趋势。
3.2.1 Budyko理论框架
流域水量平衡和能量平衡是Budyko理论的基础,其中,水量平衡的表达式为:
式中:Q为年径流量,P为年降雨量,AET为年实际蒸散发量,ΔS为区域蓄水变化量。
在多年平均尺度上,闭合流域的ΔS可以忽略不计[22](本文研究珠江中上游地区多年平均尺度上的径流变化规律及其影响,认为ΔSt≈0)。Budyko[23]在多年平均尺度上,研究发现陆面长期平均蒸散发量主要由大气对陆面的水分供应(降水量)和蒸发能力(净辐射量或潜在蒸散发量)之间的平衡决定。以降雨量P为水分供应边界,潜在蒸散发作为能量控制边界,Budyko理论模型可由下式表达:
式中:潜在蒸散发量(Potential Evapotranspiration,PET)采用FAO Penman-Monteith[24]方法求得,计算公式如下:
式中:G为土壤热通量密度,G值较小,在实际计算中可以忽略不计;Rn为陆地表面净辐射;γ为干湿计常数;es为饱和水气压;ea为实际水气压;Δ为温度—饱和水气压关系曲线T处的斜率;u2为陆地表面2 m高处风速。
Budyko理论经过多年的实践和发展,衍生出了许多改进的实际蒸散发公式。其中经量纲分析和数学推导并被广泛应用的傅抱璞公式[25]可较好地表达流域内的水热耦合状态,其数学表达式如公式(13)所示:
式中:参数n表示流域陆面特征。相较于原始的Budyko公式,傅抱璞公式引进参数n可以反映不同区域的陆面特性,提高了实际蒸散发计算公式在不同地区的适用性。因此,本文选取傅抱璞公式计算珠江流域中上游地区的实际蒸散发量。
3.2.2 滑动平均方法
由于Budyko理论框架下的傅抱璞公式计算区域实际蒸散发是基于多年平均尺度,因此,本文在应用傅抱璞公式计算珠江流域中上游地区实际蒸散发量时,各要素采用滑动平均值进行计算分析。滑动平均法是一种采用固定长度时间窗,对时间窗内所有取值做算术平均,并将平均值作为时间窗中心点值的数学滤波方法。在滑动平均法中,时间窗长度的选取尤为重要,但目前没有统一明确的选取规则[26]。本研究中,根据研究时段的历时长度,选取11年时长为滑动平均的时间窗长度进行具体计算分析。各要素滑动平均值分别表示为:径流(Qt)、实际蒸散发(AETt)、降雨(Pt)、平均温度(Tt)、最高温度(Tmaxt)、最低温度(Tmint)、相对湿度(RHt)、地表平均风速(u2t )、日照时数(St)以及陆面植被覆盖指数(NDVIt)。
3.2.3 逐步回归方法拟合参数n
在傅抱璞公式中,参数n代表研究区域特性,受包括气象要素、陆面植被、人类活动等的影响和制约[11,26]。由于珠江流域受人类活动影响较小,本文基于逐步线性回归分析方法,选取气象要素和植被覆盖指数对参数n进行拟合。逐步回归的基本思想是利用事先拟定的标准,逐一将具有显著意义的自变量引入方程,同时对方程中的每一个自变量进行检验,剔除不具有显著性意义的变量,使方程中的每一个变量都具有显著意义,即建立“最佳”方程的回归分析[27]。本研究选取气候要素P、T、Tmax、Tmin、RH、u2、S和陆面植被覆盖指数NDVI的11年滑动平均值作为自变量,选取由水量平衡公式和傅抱璞公式反算得到的参数n的11年滑动平均作为因变量,在SPSS软件中进行逐步回归分析,拟合方程形式如下所示:
为分析比较该经验公式的模拟效果,本文将计算公式(14)拟合得到的参数nt作为参数模拟值,记作nt0。将以AETt与实测Pt为输入变量,应用傅抱璞公式反算得到的参数nt作为参数的标准值,记作nt。此外,将基于水量平衡算得的实际蒸散发量作为研究区域实际蒸散发的真实值,记作AETt。将以参数拟合值nt0和其他气象要素观测值为输入量,应用傅抱璞公式求得的实际蒸散发量作为研究区域实际蒸散发的模拟值,记作AETt0。将以实测Pt与AETt0作为输入量,应用水量平衡公式计算得到的径流量作为模拟径流量,记为Qt0。
为具体分析研究区域径流对气候和陆面植被变化的响应,本文应用敏感性分析方法分析各要素对径流变化的影响。设Svi为径流模拟值
式中:vi表示各个影响要素,
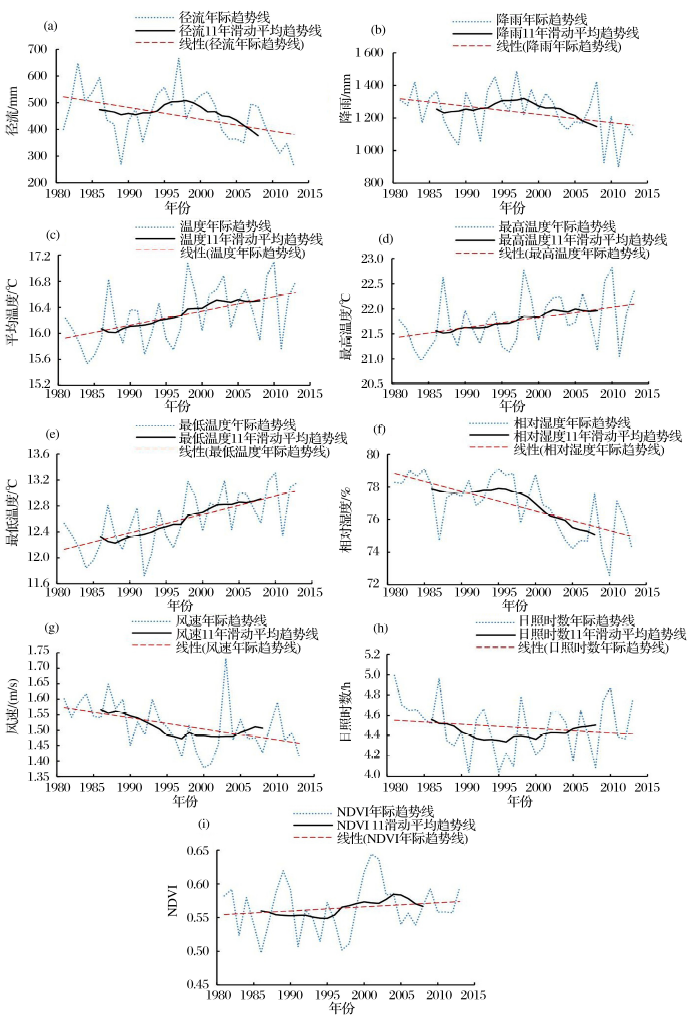
采用TFPW-MK方法对珠江中上游地区1981—2013年Q,P,T,Tmax,Tmin,RH,u2,S和NDVI序列的变化趋势进行了以显著性水平α=0.05的显著性检验,各个要素的趋势检验结果如表 1 所示,各要素变化趋势如图 2 所示。
表1 研究区域各要素趋势检验结果统计
Table 1 Results of trend analysis of the climate factors and NDVI in middle and upper reaches of the Pearl River Basin
| 要素 | ZMK | 变化趋势 |
|---|---|---|
| Q | -2.51* | 下降 |
| P | -1.97* | 下降 |
| T | 2.63* | 上升 |
| Tmax | 3.53* | 上升 |
| Tmin | 2.18* | 上升 |
| S | -0.89 | 下降 |
| u2 | -2.99* | 下降 |
| RH | -3.1* | 下降 |
| NDVI | 0.74 | 上升 |
图2 珠江中上游地区气象和植被要素变化趋势示意图
(a)径流量(Q),(b)降水量(P),(c)平均温度(T),(d)最高温度(Tmax),(e)最低温度(Tmin),(f)相对湿度(RH),(g)风速(u2),(h)日照时数(S),(i)植被覆盖指数(NDVI)
Fig.2 Changes in climatic variables and NDVI in middle and upper reaches of the Pearl River Basin
(a)Runoff(Q),(b)Precipitation(P),(c)Average temperature(T),(d)Maximum temperature(Tmax),(e)Minimum temperature(Tmin),(f)Relative Humid(RH),(g)Wind speed(u2),(h)Sunshine duration (S),(i)Normalized Difference Vegetation Index(NDVI)
根据表 2和图 1的结果,珠江流域中上游地区大部分要素具有显著的变化趋势:①T、Tmax、Tmin与NDVI在1981—2013年呈现上升趋势。其中,温度项T、Tmax和Tmin均通过显著性水平为0.05的趋势检验,表明研究区域温度有显著的上升趋势,这与Dou 等[13]得出的结果相一致。而NDVI没有通过显著性水平为0.05的趋势检验,表明研究区域陆面植被在1981—2013年虽然具有一定程度的上升趋势,但不显著;②Q、P、RH、u2与S在1981—2013年呈现下降趋势,其中Q、P、RH、u2均通过了显著性水平为0.05的趋势性检验,即Q、P、RH、u2在研究时段具有显著的下降趋势,而S未通过显著性水平为0.05的趋势检验。总体而言,珠江中上游地区在1981—2013年受全球气候变化的影响,温度上升明显,而降水、径流量和相对湿度都呈现显著的降低趋势。
4.2.1 傅抱璞公式参数n的拟合分析
本文选取Pt、Tt、Tmaxt、Tmint、RHt、
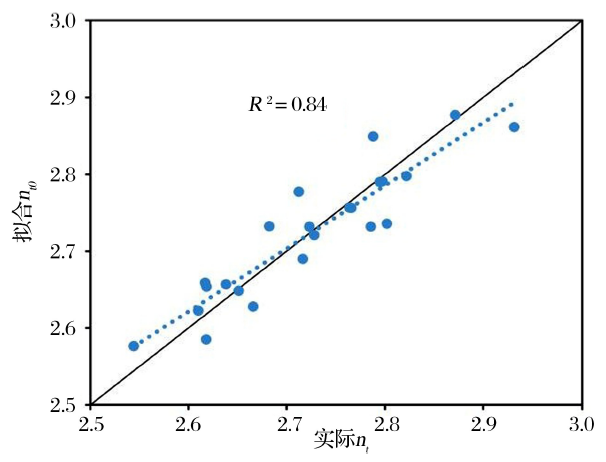
表2 研究区域参数nt逐步拟合分析结果
Table 2 Stepwise regression results of parameter nt in study catchment
| 变量 | 步数 | R2 | R2 增量 |
|---|---|---|---|
| NDVIt | 1 | 0.2 | |
| St | 2 | 0.7 | 0.5 |
| Tt | 3 | 0.77 | 0.07 |
| Pt | 4 | 0.8 | 0.03 |
| RHt | 5 | 0.82 | 0.02 |
| u2t | 6 | 0.84 | 0.02 |
根据表2,逐步回归分析中,首先引入的变量是陆面植被覆盖指数NDVIt,此时
如图3所示,采用公式(16)估算nt0的确定性系数(R2)为0.84,拟合结果较好。公式(16)表明珠江流域中上游地区傅抱璞公式参数n同时受到气候要素和陆面植被的影响,其中NDVI与参数nt0呈现负相关关系,即在该区域植被变化与实际蒸散发变化呈现负相关关系,该结论和Yang等[28]在海河流域得出的结论相一致。参数n的定量拟合,一定程度上改进和发展了傅抱璞计算公式,不仅提高了傅抱璞公式的适用性和计算精度,同时引入了陆面植被变量,将陆面植被对蒸散发的影响进行了定量表达。
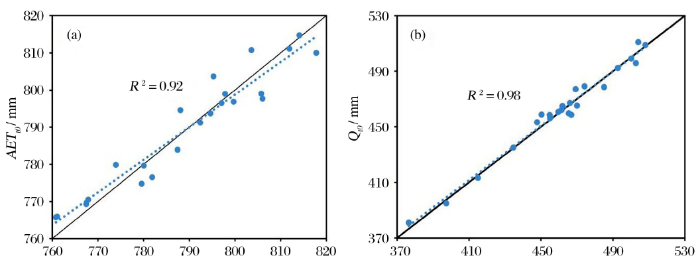
4.2.2 基于改进傅抱璞公式模拟计算AETt与Qt
为了进一步检验公式(16)对参数nt0的估算效果,结合公式(13)和参数拟合计算式(16),计算珠江中上游地区每个时间窗实际蒸散发模拟值AETt0,再以AETt0为输入项,基于水量平衡公式(10)计算研究区域每个时间窗径流量的模拟值Qt0。进而对比分析区域实际蒸散发和径流模拟值AE
图4 应用拟合参数nt0估算AETt与Qt的精度验证
(a)模拟AETt0与实际AETt比较;(b)模拟Qt0与观测Qt比较
Fig.4 Accuracy verification of AETt and Qt by fitting parameter nt0
(a) Comparison between AETt0 and AETt; (b) Comparison between Qt0 and Qt
根据图4结果模拟得到的AE
基于4.2节的分析结果,结合改进的傅抱璞计算公式与水量平衡公式能够很好地模拟流域年径流量
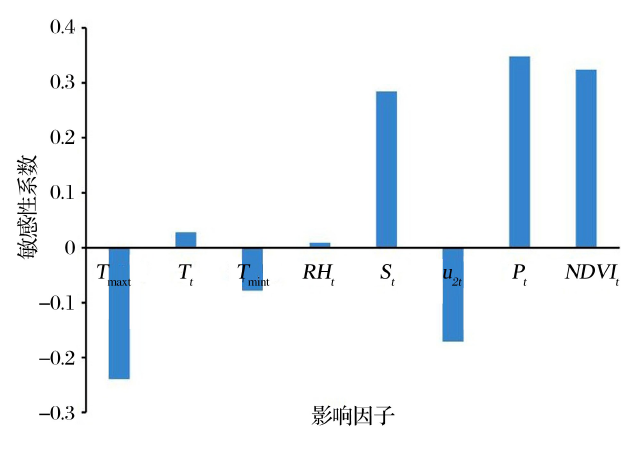
图5展示了研究区域径流Qt0对各个要素的多年平均敏感度,根据图中结果,在珠江中上游地区径流
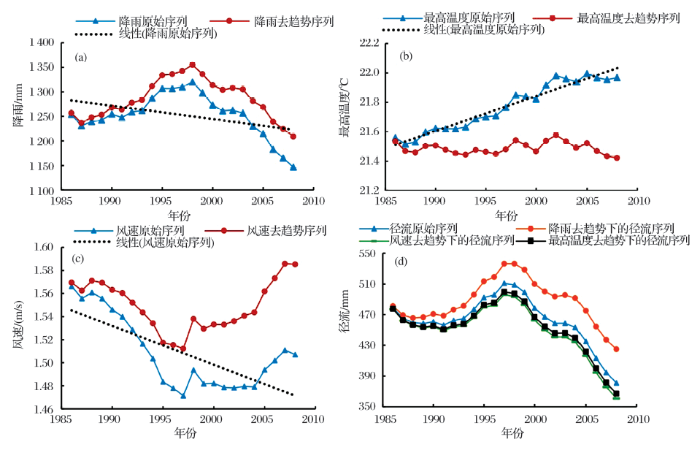
由于流域径流在1981—2013年有明显的下降趋势,且对其影响较为显著的5个要素中,Pt、Tmaxt和u2t都有着显著的变化趋势,所以本文采用去趋势法深入分析Pt、Tmaxt和u2t变化对
图6 Pt、Tmaxt和u2t变化对Qt0变化的影响
(a)、(b)、(c)分别为Pt、Tmaxt、u2t的原始序列和去趋势序列的对比图;(d)为降雨去趋势下径流序列
Fig.6 Influence of changes in Pt, Tmaxt and u2t on Qt0 changes
(a)、(b)、(c) show the comparison of the original series with detrended series of Pt、Tmaxt、u2t, respectively; (d) shows the comparison of the original runoff with the recalculated runoff. The original runoff denoted as Qt0, the runoff recalculated by detrended series of Pt、Tmaxt、u2t denoted as
综上所述,受气候变化的影响,在1981—2013年,珠江中上游地区降雨量的减少、风速的下降以及最高气温的升高对径流的减小起到主要作用,其中降雨量的减少是区域径流减少的主导因素。此外,植物作为影响和控制陆面水分蒸腾的主要途径,其对陆面水文循环有着不可忽视的影响。在本研究中,通过引入NDVI和其他气象要素拟合傅抱璞公式参数n,将研究区域植被对水文循环的影响进行了定量表达。且根据敏感性分析结果,研究流域径流对NDVI的敏感性仅次于降雨,但由于NDVI在1981—2013年没有明显的变化趋势,所以其对流域径流减少的影响不明显。
径流作为全球水循环的关键环节,对区域水资源的开发和利用、生态环境保护等具有重要影响。在变化环境的大背景下,分析径流对气候和植被变化的响应具有现实意义。本文选取珠江流域中上游为研究区域,通过定量拟合参数n,改进了Budyko理论框架下的傅抱璞公式,并以此为基础,分析了研究区域各要素变化对径流变化的影响。主要得到以下几点结论:
(1)根据TFPW-MK趋势分析结果,珠江中上游地区T、Tmax、Tmin都呈现出显著的上升趋势,NDVI有一定程度的上升趋势,但趋势不明显;而区域年Q、P、u2、RH均呈现出明显的下降趋势,S有一定程度的下降趋势,但趋势不明显。
(2)在11年滑动平均尺度上,通过逐步回归分析,表明傅抱璞实际蒸散发计算公式中参数n受气候要素P、T、RH、S、u2和植被要素NDVI的共同制约,并通过建立参数n与上述要素的函数关系式改进和发展了傅抱璞公式。
(3)气候变化对研究区域径流的影响主要是通过同时改变水文输入要素(降雨,潜在蒸散发)和表针流域特性的参数n来表现,而植被对研究区域径流的影响主要是通过改变表针流域特性的参数n来表现。根据敏感性分析结果,珠江流域中上游地区在1981—2013年降雨量的减少是其径流量减少的主导因素。此外,流域径流对NDVI的敏感性仅次于降雨,但由于NDVI在1981—2013年没有显著的变化趋势,其对流域径流减少的贡献率并不显著。
The authors have declared that no competing interests exist.
| [1] |
An overview of global climate changing in current scenario and mitigation action [J].
Climate changing is a global threat to the world. There are so many reasons behind this problem. One of the major reasons is carbon emissions in atmosphere. The causes for this global threat are many, among them GHG (green house gas emission) is one of them. Also deforestation, land use change, sulfate aerosol and black carbon are the other major reason leading to the ozone layer depletion and changing climate. Due to the carbon emission atmosphere is being polluted and also so many disasters happen routinely. Atmosphere is getting hot day by day. Due to this unnatural and sudden temperature rise, glaciers are melting, so sudden flash floods occur. Agricultural sector is also suffering due to the global warming effects. This will also affect the productivity of grains world wide. Climate changing increases land and as well as sea temperature and alters precipitation quantity and patterns. As a result increasing the global average sea level, risk of coastal erosions, etc. climate change will be an added stress for the fisheries and aquaculture sectors. Effects will also be severe on coasts and marine ecosystems. Extreme events like drought, flood may also happen due to these impacts. This paper elaborately present the current situation of climate changing and the causes of its vulnerable effects, also the mitigation action of climate changing are also discussed.
|
| [2] |
Advances in hydro-meteorological forecast under changing environment [J].变化环境下气象水文预报研究进展 [J]. |
| [3] |
Advances in researches of the effects of grassland vegetationon soil erosion in Loess Plateau [J].黄土高原草地植被对土壤侵蚀影响研究进展 [J].
黄土高原土壤侵蚀严重,草地植被具有良好的水土保持作用,能很好地改善其生态环境。学者们对草地植被盖度与土壤侵蚀的关系、草地植被对水力学参数的影响、草地植被对土壤性质的影响、草地植被减水减沙效应以及草地坡面土壤侵蚀过程等几个方面开展了大量研究;但是关于草地覆盖诱发的侵蚀作用研究较少。将前人的研究成果进行归纳总结,并补充关于草地诱发侵蚀的一些研究结果,继而指出目前研究中存在的问题以及今后需要加强的方面,旨在减少黄土高原土壤侵蚀。
|
| [4] |
Estimating climate change impact on runoff across southeast Australia: Method, results, and implications of the modeling method [J].
This paper describes the modeling of climate change impact on runoff across southeast Australia using a conceptual rainfall-runoff model SIMHYD and presents the results and assesses the robustness of the modeling approach. The future climate series is obtained by scaling the historical series, informed by 15 global climate models (GCMs), to reflect a 0.9 C increase in global average surface air temperature, using a daily scaling method that considers changes in the future mean seasonal rainfall and potential evapotranspiration as well as in the daily rainfall distribution. The majority of the modeling results indicate that there will be less runoff in southeast Australia in the future. However, there is considerable uncertainty, with the results ranging from a 17% decrease to a 7% increase in the mean annual runoff averaged across the study area for the 0.9 C global warming. The model assessments indicate that the modeling approach is generally robust and can be used to estimate the climate impact on runoff. The modeled mean annual runoff is generally within 10-20% of the observed runoff. The modeling results for an independent test period are only slightly poorer than the calibration period, indicating that a satisfactorily calibrated rainfall-runoff model can be used to estimate runoff for another climate period. The modeled impact on various runoff characteristics as estimated by two rainfall-runoff models investigated here differ by less than 10%, which is relatively small compared to the range of modeled runoff results using rainfall projections from different GCMs.
|
| [5] |
Land use and climate change impacts on the hydrology of the upper Mara River Basin, Kenya: Results of a modeling study to support better resource management [J].
Some of the most valued natural and cultural landscapes on Earth lie in river basins that are poorly gauged and have incomplete historical climate and runoff records. The Mara River Basin of East Africa is such a basin. It hosts the internationally renowned Mara-Serengeti landscape as well as a rich mixture of indigenous cultures. The Mara River is the sole source of surface water to the landscape during the dry season and periods of drought. During recent years, the flow of the Mara River has become increasingly erratic, especially in the upper reaches, and resource managers are hampered by a lack of understanding of the relative influence of different sources of flow alteration. Uncertainties about the impacts of future climate change compound the challenges. We applied the Soil Water Assessment Tool (SWAT) to investigate the response of the headwater hydrology of the Mara River to scenarios of continued land use change and projected climate change. Under the data-scarce conditions of the basin, model performance was improved using satellite-based estimated rainfall data, which may also improve the usefulness of runoff models in other parts of East Africa. The results of the analysis indicate that any further conversion of forests to agriculture and grassland in the basin headwaters is likely to reduce dry season flows and increase peak flows, leading to greater water scarcity at critical times of the year and exacerbating erosion on hillslopes. Most climate change projections for the region call for modest and seasonally variable increases in precipitation (5???10 %) accompanied by increases in temperature (2.5???3.5 ??C). Simulated runoff responses to climate change scenarios were non-linear and suggest the basin is highly vulnerable under low (???3 %) and high (+25 %) extremes of projected precipitation changes, but under median projections (+7 %) there is little impact on annual water yields or mean discharge. Modest increases in precipitation are partitioned largely to increased evapotranspiration. Overall, model results support the existing efforts of Mara water resource managers to protect headwater forests and indicate that additional emphasis should be placed on improving land management practices that enhance infiltration and aquifer recharge as part of a wider program of climate change adaptation.
|
| [6] |
Impacts of climate and land use changes on runoff in the Lianshui Basin [J].气候与土地利用变化对涟水流域径流的影响 [J].
以涟水流域为研究对象,选用1990年、2000年、2010年三期土地利用数据资料,将1985-2014年30 a气象条件相应划分为1985-1994年、1995-2004年、2005-2014年三段气象背景时期,并组合细分为7种模拟情景,应用SWAT分布式水文模型模拟不同情景下的径流量,探讨气候和土地利用变化对流域径流的影响。利用PSO粒子群优化算法,以克林效率系数为目标函数,通过湘乡站实测径流数据校准模型参数。运用、评价模拟的不确定性,采用相关系数、纳什效率系数和偏差百分比评价模型模拟效果,评价结果表明不同土地利用情景下,校准期和验证期的模拟效果均达到可信程度,模拟的不确定性较小。组合情景间模拟分析结果表明,1985-2014年30 a间,气候变化使涟水流域径流不断减少,土地利用变化使径流有所增加,年径流深总体呈现下降趋势。气候变化对涟水流域径流变化的影响贡献率在逐渐上升,从71.4%上升到了86.3%。土地利用变化对径流变化的影响贡献率则相应下降,从28.6%降低至13.7%。因此,在气候变化背景下,科学管理流域水资源还需要充分考虑流域土地资源空间配置结构和利用方式。
|
| [7] |
Influence of forest coverage change on hydrological process and watershed runoff [J].森林植被变化对水文过程和径流的影响效应 [J].
森林植被变化对水分分配和河川径流具有调节作用。对我国森林植被变化水文效应文献的综合分析表明:森林砍伐或火灾引起森林覆盖度下降会导致林冠截留率、凋落物对降水截留能力和蓄水能力、土壤的渗透和蓄水能力降低。不同地区森林植被变化对径流的影响幅度相差较大,但比较一致的结论是:除长江中上游外,森林砍伐会降低植被层的蒸发散,增加河川径流;反之,会减少河川径流量。森林火灾会导致林木蒸发散减少,河川径流增加。
|
| [8] |
Influences of shrubs-herbs-arbor vegetation coverage on the runoff based on the remote sensing data in Loess Plateau [J].基于遥感的黄土高原林草植被变化对河川径流的影响分析 [J].
从黄土高原不同地貌区降雨产流机制入手,分析了林草植被影响流域水循环的可能环节;利用20世纪70年代以来不同时期的土地利用和植被盖度解译成果,以及同期实测的降雨和径流数据、供用水数据等,引入林草植被覆盖率、径流系数、产洪系数和基流系数等概念,从流域尺度上构建了林草植被覆盖率与河川径流的定量响应关系,结果发现,在半湿润或半干旱的黄土区,径流系数和产洪系数都将随林草植被的改善而减少,气候越干旱、径流或洪量减少越多;与同气候带的黄土区相比,盖沙黄土区林草植被改善所导致的减水量更大。不过,当林草植被覆盖率大于60%后,产洪系数变化减缓;最终河川径流将稳定在大于基流的某阈值附近。
|
| [9] |
Review on montane forest eco-hydrology in arid area [J].干旱区山地森林生态水文研究进展 [J].
在全球气候变化背景下,干旱区山地森林及其与水的关系和水文功能表现出较强的敏感性,引起了学术界和管理部门的高度关注。从森林空间格局、生态水文过程及其对气候变化的响应等方面,系统阐述了干旱区山地森林生态水文的研究进展,辨析了森林斑块格局的形成与稳定机理、森林与流域产水量的关系以及森林生态水文对气候变化的响应。此外,结合目前的研究进展,提出了未来的研究重点:加强植被格局与水文过程的耦合研究;借助遥感技术和模型解决尺度问题;提升森林水文功能的认识水平;确定兼顾水文和其他生态效应的适宜森林规模。
|
| [10] |
Research on impact of vegetation change to water generation [J].植被变化对产水量影响的研究 [J].
植被变化将使其水文效益发生相应的改变,通过植被变化对产水量影响方面的研究,客观地评价了该研究领域的主要进展和存在问题.我国在这方面尚未开展过深入细致的研究,因此有一定的借鉴意义.
|
| [11] |
Quantifying the impacts of climate change and ecological restoration on streamflow changes based on a Budyko hydrological model in China's Loess Plateau [J].
Abstract <p>Understanding hydrological effects of ecological restoration (ER) is fundamental to develop effective measures guiding future ER and to adapt climate change in China's Loess Plateau (LP). Streamflow ( Q ) is an important indicator of hydrological processes that represents the combined effects of climatic and land surface conditions. Here 14 catchments located in the LP were chosen to explore the Q response to different driving factors during the period 1961–2009 by using elasticity and decomposition methods based on the Budyko framework. Our results show that (1) annual Q exhibited a decreasing trend in all catchments (610.30 65 611.71 mm yr612), with an average reduction of 610.87 mm yr612. The runoff coefficients in flood season and nonflood season were both decreasing between two periods divided by the changing point in annual Q series; (2) the precipitation ( P ) and potential evapotranspiration ( E 0) elasticity of Q are 2.75 and 611.75, respectively, indicating that Q is more sensitive to changes in P than that in E 0; (3) the two methods consistently demonstrated that, on average, ER (62%) contributing to Q reduction was much larger than that of climate change (38%). In addition, parameter n that entails catchment characteristics in the Budyko framework showed positive correlation with the relative area of ER measures in all catchments (eight of them are statistically significant with p
|
| [12] |
Nonparametric method for estimating the effects of climatic and catchment characteristics on mean annual evapotranspiration [J].
It is now well known that forested catchments have higher evapotranspiration than grassed catchments. Models for mean annual evapotranspiration have been developed to quantify catchment scale differences in mean annual evapotranspiration. Zhang et al. (2001) developed a simple, one parameter, model for the relationships between evapotranspiration and vegetation cover by evaluating the differences of model parameter values for different vegetation covers. However, other factors such as climate and catchment topography may also affect evapotranspiration and therefore the model parameter. Simple models acknowledging only categorical vegetation cover (forested, mixed, and grassed) may introduce some uncertainty, and more seriously, lead to inconsistent conclusions regarding relationships between vegetation cover and evapotranspiration. Zhang et al. (2004) investigated possible inclusion of climatic factors and catchment characteristics to improve the estimation of mean annual evapotranspiration by modeling the residuals of the model parameter via a stepwise linear regression. In this paper we propose the use of a multivariate adaptive regression spline (MARS) model for estimating the model parameter. In contrast to a simple stepwise regression, the MARS model provides not only insight into the interactions between explanatory factors but also a potential for prediction for ungauged basins as long as the values of explanatory factors are within the domain of calibration catchments. The MARS model is able to determine statistically significant factors and therefore is a powerful tool to identify important factors and their interactions. Using 241 Australian catchments where climate factors and catchment characteristics are available, we found the following significant terms affecting the mean annual evapotranspiration. (1) The functional relationship with the number of months that peak precipitation follows peak potential evapotranspiration (PfE) states that closer phase between precipitation and potential evapotranspiration results in less streamflow. (2) The interactions between coefficient of variation of precipitation and average storm depth shows that the value of the model parameter is smaller when the coefficient of variance of precipitation is larger than 2.24 and the average storm depth is less than 8.70 mm d. (3) The interaction between relief ratio and average storm depth term shows that both larger average storm depth in flat catchments and smaller average storm depth in hilly catchments result in more streamflow. (4) The interaction between relief ratio and forest coverage reveals that for flat catchments with reasonable forest cover, increasing forest cover generally results in more mean annual evapotranspiration and less mean annual streamflow. The performance of the MARS model was assessed by a calibration-testing procedure to support its usage for prediction for ungauged basins.
|
| [13] |
Climate change and its human dimensions based on GIS and meteorological statistics in Pearl River Delta, Southern China [J].
Abstract Climate change in the Pearl River Delta (PRD) has attracted growing attention along with rapid urbanization in Southern China. Annual mean temperatures in this area have increased more rapidly than the average level, which can be attributed to population expansion and land use changes in this region. In this study, temperature records from 31 weather stations in the PRD in Guangdong, China and the global dataset from the National Centres for Environmental Prediction (NCEP) Reanalysis (R-2) are analysed. Data from NCEP R-2 and temperature soundings taken at 850 hPa are used to define the background temperature. Anthropogenic temperature is then calculated according to the observed temperature and background temperature. The relationships of anthropogenic temperature to population density and area ratio of land-use types are analysed by univariate and multiple regression analysis techniques. Spatial distribution of anthropogenic temperature in the daytime is different from that at night. Model results indicate that relationships between population and anthropogenic temperature in the daytime are logarithmic or inverse but tend to be linearly related at night. Multiple regression analysis conducted on the area ratios of land-use types and anthropogenic temperature shows that a strong relationship exists between the two in spring and autumn. Positive correlations with anthropogenic temperature from arid land, water bodies and urban land, as well as a negative correlation from woodland, are detected regardless of time of day. Contrary to the paddy field, grassland and sea show a negative correlation with anthropogenic temperature in the daytime and a positive correlation at night. Copyright 2010 Royal Meteorological Society
|
| [14] |
Non-parametric tests against trend [J]. |
| [15] |
Rank Correlation Measure [M]. |
| [16] |
Long-term trend test of precipitation and runoff in the Yangtze River Basin [J].长江流域降水量和径流量长期变化趋势检验 [J].
采用TFPW-MK(Mann-Kendall test with trend-free pre-whitening)趋势检验法,对20世纪50年代以来长江流域154个气象站降水量和26个主要水文站径流量的变化趋势进行了显著性检验。结果显示:①流域年降水总量整体变化趋势不显著,但各季节和月份的降水量存在的增加或减少趋势显著,尤其是在上世纪90年代期间降水量分布存在一定的变异,在流域空间分布上不仅出现了降水显著增加的集中区(洞庭湖和鄱阳湖水系),而且还出现降水显著减少的集中区(四川盆地和汉江上游),在降水的年内时间分布上也存在着趋于集中的态势,表现在夏季降水量增加、而秋季和春季降水量减少。②流域内各主要支流径流量变化趋势与其降水量变化趋势基本一致,夏季长江中下游地区径流量增加趋势显著,而秋季长江上游和汉江地区径流量则呈减少趋势,相对而言干流径流量的变化趋势并不显著。
|
| [17] |
Power of the Mann-Kendall and Spearman's rho tests for detecting monotonic trends in hydrological series [J].
In many hydrological studies, two non-parametric rank-based statistical tests, namely the Mann endall test and Spearman's rho test are used for detecting monotonic trends in time series data. However, the power of these tests has not been well documented. This study investigates the power of the tests by Monte Carlo simulation. Simulation results indicate that their power depends on the pre-assigned significance level, magnitude of trend, sample size, and the amount of variation within a time series. That is, the bigger the absolute magnitude of trend, the more powerful are the tests; as the sample size increases, the tests become more powerful; and as the amount of variation increases within a time series, the power of the tests decrease. When a trend is present, the power is also dependent on the distribution type and skewness of the time series. The simulation results also demonstrate that these two tests have similar power in detecting a trend, to the point of being indistinguishable in practice. The two tests are implemented to assess the significance of trends in annual maximum daily streamflow data of 20 pristine basins in Ontario, Canada. Results indicate that the P-values computed by these different tests are almost identical. By the binomial distribution, the field significant downward trend was assessed at the significance level of 0.05. Results indicate that a higher number of sites show evidence of decreasing trends than one might expect due to chance alone.
|
| [18] |
Applicability of prewhitening to eliminate the influence of serial correlation on the Mann-Kendall test [J].
http://www.agu.org/pubs/crossref/2002/2001WR000861.shtml
|
| [19] |
Runoff trend detection in the Minjiang River Basin with TFPW-MK method [J].基于TFPW-MK法的闽江流域径流趋势研究 [J].
为了寻找适合闽江流域径流趋势的分析方法,并在此基础上探究其径流特征,基于闽江流域4个控制水文站近61 a(1950—2010年)的月径流资料,采用TFPW-MK法分析不同时间尺度下径流演变趋势,并与MK、PW-MK结果进行比较分析。结果表明:1)由于序列普遍存在自相关,TFPW-MK法比较适合闽江流域径流趋势检测,且序列自相关系数是影响检测结果的关键因素。2)闽江流域近61 a径流演变主要趋势为年径流呈不显著下降趋势,汛期和春季径流以下降趋势为主,非汛期、夏秋冬季径流均呈上升趋势,其中冬季趋势显著,月最大和月最小径流分别呈下降和上升趋势,且多数站点趋势显著,同时序列长度对趋势分析结果有重要影响。
|
| [20] |
The influence of nonlinear trends on the power of the trend-free pre-whitening approach [J].
ABSTRACT The Mann-Kendall test has been widely used to detect trends in agro-meteorological as well as hydrological time series. Trend-free pre-whitening (TFPW-MK) is an approach that improves the performance of this test in the presence of serial correlation. The main goal of this study was to evaluate the ability of TFPW-MK to detect nonlinear trends. As a case study, this approach was also applied to 10-day values of precipitation (P), potential evapotranspiration (PE) and the difference between P and PE (P- PE) obtained from the weather station of Ribeir o Preto, State of S o Paulo, Brazil. The results obtained from Monte Carlo simulations indicate that upward convex trends increase the power of this test, while upward concave trends decrease its power. The results obtained from the location of Ribeir o Preto reveal an increasing pressure on agricultural water management due to growing PE values. Thus, we conclude that the power of the TFPW-MK is affected by the shape of the trend and that the hypothesis of the absence of climate change in the abovementioned location cannot be accepted.
|
| [21] |
Spatial and temporal evolution of climatic factors and its impacts on potential evapotranspiration in Loess Plateau of Northern Shaanxi, China [J].
61The Loess Plateau of northern Shaanxi (LPNS) experienced a warmer and drier period.61Sensitivity and contribution rate analysis were used to explore the driving factor of ET0.61ET0showed a significant upward trend in the northern part of LPNS.61ET0was most sensitive to the variation of relative humidity in LPNS。61Maximum temperature had a higher contribution rate to the variation of ET0in LPNS
|
| [22] |
Climate and direct human contributions to changes in mean annual streamflow in the South Atlantic, USA [J].
ABSTRACT [1] Streamflow responds to changing climate patterns as well as human modifications within a basin. Understanding the contribution of these different drivers to changes in streamflow provides important information regarding how to effectively and efficiently address and anticipate changes in water availability. We used Budyko curves to ascribe changes in streamflow due to climate and human factors between two time periods in both natural and human-modified basins in the South Atlantic, USA. We extended the analysis to look at the consistency of climate and human alterations in 5 year increments within those time periods. Budyko curves were calculated for each watershed to describe the average climate control on a watershed given its land cover during the period 1934 1969. We then assessed how climate and human factors contributed to altering streamflow during the period 1970 2005. We found climate contributed to increased streamflow (average of 14%) in the South Atlantic since the 1970s. Human factors varied between basins and either amplified or minimized the effect of climate on streamflow. Human impacts were equivalent to, or greater than, climate impacts in 27% of our basins. The 5 year increments showed greater variability in climate, compared to human, contributions to streamflow change through time. Ordinations showed reservoir storage and population size negatively correlated with streamflow change, while the extent of agricultural land within basins positively correlated with streamflow change. Differentiating between the distinct effects that climate and human impacts have on streamflow is increasingly necessary for managing water resources under dynamic climate and human population scenarios.
|
| [23] |
|
| [24] |
Analysis of spatial distribution and temporal trend of reference evapotranspiration and pan evaporation in Changjiang (Yangtze River) catchment [J].
In this study the Penman onteith reference evapotranspiration, pan evaporation measured by a 20 cm pan, and pan coefficient, i.e., the ratio of Penman onteith evapotranspiration to pan evaporation, at 150 meteorological stations during 1960 2000 in the Changjiang (Yangtze River) catchment in China are calculated, compared and regionally mapped. Their spatial distributions and temporal variations are examined and the causes for the variations are discussed. The spatial distributions of temporal trends in the reference evapotranspiration as well as in the meteorological variables that determine evapotranspiration are analyzed. The contributions of various meteorological variables to the temporal trend detected in the reference evapotranspiration and pan evaporation are then determined. The results show that: (1) the spatial distributions of reference evapotranspiration and pan evaporation are roughly similar. Spatial correlation coefficients between the reference evapotranspiration and the pan evaporation are high for both the seasonal and annual values. The temporal correlation between the two estimates is higher in the lower (humid) region than in the upper (semi-arid) region. The spatial distribution pattern of the pan coefficient is significantly influenced by wind speed and relative humidity in the region. Higher values of the pan coefficient were found in the central area of the catchment with a relatively high humidity (as compared with the upper area) and a very low wind speed (as compared with other areas); (2) for the whole catchment, there is a significant decreasing trend in both the reference evapotranspiration and the pan evaporation, which is mainly caused by a significant decrease in the net total radiation and to a lesser extent by a significant decrease in the wind speed over the catchment. No temporal trend is detected for the pan coefficient; (3) sensitivity analysis shows that the reference evapotranspiration is most sensitive to the net total radiation, followed by relative humidity, air temperature and wind speed.
|
| [25] |
One the calculation of the evaporation from land surface [J].论陆面蒸发的计算 [J].
本文从蒸发E随降水的改变率E/r是剩余蒸发力E_0—E和降水r的函数,即E/r=f(E_0-E,r),而蒸发随蒸发力的改变率E/E_0是剩余水量,r—E和蒸发力E_0的函数,即E/E_0=φ(r-E,E_0)的考虑出发,利用量纲分析和微分方程理论确定了函数f和Φ的表述式,并由此得到根据蒸发力和降水计算陆面蒸发的公式。计算结果非常令人满意。
|
| [26] |
Separating the impacts of climate change and human activities on runoff using the Budyko-type equations with time-varying parameters [J].
The Budyko-type equations have begun to be widely adopted to separate the contributions of climate change and human activities to the variation of runoff over long-term periods by using the multi-year averages of hydrological variables. In this study, a two-step framework based on four single-parameter Budyko-type equations is proposed to separate the impacts of climate change and human activities on runoff. First, the relationship of the parameter w in each Budyko-type equation with climatic and human factors is built to reveal the time-variation process of w by using an 11-year moving window. Second, the impacts of climate change and human activities on runoff are separated by using both the decomposition method and the sensitivity method. This separating framework is applied to analyze the variation of the runoff during 1960 2009 in the Weihe River. It is found that the parameter w in each Budyko-type equation is significantly related to both factors of climate and human activities. The results from both the decomposition method and the sensitivity method show that climate change is the main driving factor to the decline in runoff of the Weihe River, while human activities are another important factor. In general, climate change affects runoff not only by changing the hydrological inputs (precipitation and potential evaporation) but also by altering the watershed characteristics as represented by the parameter w; while the impacts of human activities on runoff are exerted mainly through the alteration of the watershed characteristics.
|
| [27] |
Comparative study of multiple linear regression analysis and stepwise regression analysis [J].多元线性回归分析与逐步回归分析的比较研究 [J].
文章用多元线性回归分析与逐步回归分析方法的应用进行对比研究,其结果为:一是多元回归分析和逐步回归分析两种方法对方程的检验方法和步骤都相同,均可用相关性检验和方差分析两种方法中的任何一种。二是多元回归方程方差分析模型只有一种,而逐步回规方程方差分析模型可有两种或两种以上。三多元回归分析,它将假定从方程中去掉一个自变量xi后,减少的回归平方和称为该自变量的偏回归平方和pi,并对其进行显著性检验;逐步回归则是对所有自变量进行检验,依次对作用不大、无意义的变量进行剔除,并选入有效的、对因变量Y影响较大的自变量进入方程,使其得到最佳方程。
|
| [28] |
Yeh P J F, et al. Impact of vegetation coverage on regional water balance in the nonhumid regions of China [J].
The growth of vegetation is affected by water availability, while vegetation growth also feeds back to influence regional water balance. A better understanding of the relationship between vegetation state and water balance would help explain the complicated interactions between climate change, vegetation dynamics, and the water cycle. In the present study, the impact of vegetation coverage on r...
|

/
| 〈 |
|
〉 |
