
黄平 , 周士杰
, 周士杰
Huang Ping, Zhou Shijie
中图分类号: P426.6
收稿日期: 2018-06-6
修回日期: 2018-10-10
网络出版日期: 2018-11-20
版权声明: 2018 地球科学进展 编辑部
基金资助:
作者简介:
First author:Huang Ping (1982-), male, Zizhong County, Sichuan Province, Professor. Research areas include tropical air-sea interaction and climate change. E-mail: huangping@mail.iap.ac.cn
作者简介:黄平(1982-),男,四川资中人,研究员,主要从事热带海气相互作用和气候变化研究.E-mail:huangping@mail.iap.ac.cn
展开
摘要
热带降水是全球能量水份循环的重要环节。热带降水在全球变暖下的变化是目前国际上广泛关注的气候变化问题之一。回顾了近30年来关于热带降水在观测中的变化以及基于气候模式预估未来变化方面的研究进展;总结了目前在热带区域降水变化机制方面的国际前沿研究进展及研究方法;最后讨论了目前气候模式预估未来区域降水变化所遇到的模式间差异大等影响预估可信度的问题,展望未来研究中面临的主要挑战。
关键词:
Abstract
Since tropical rainfall is important in the global energy and hydrologic cycle, the tropical rainfall changes under global warming have attracted extensive attention around the world in recent decades. The advances in the observational studies and model projection for the tropical rainfall changes under global warming were reviewed here. The frontiers in the mechanism of regional tropical rainfall changes and the approaches of rainfall change research are summarized. The large intermodel spread in the multi-model projections, the sources of uncertainty and the methods to reduce the uncertainty were also introduced. Finally, the challenges about the tropical rainfall changes were discussed.
Keywords:
降水是全球能量水份循环的重要因子,是全球中受气候变化影响最重要的气候系统之一。洪涝、干旱等重大极端天气气候灾害与降水直接相关,研究表明全球变暖下洪涝和干旱发生的强度和频率都将有所增加[1,2,3]。降水的变化也会对蒸发、径流等造成直接影响,导致水资源总量和时空分布的变化,这对水资源的合理开发和利用以及社会经济的可持续发展等都有重要影响[4,5,6]。因此,检测和预估区域降水在全球变暖下的变化一直是全球变暖区域气候变化研究的重点问题[7]。
全球降水主要分布在热带地区,是全球能量水份循环中的重要环节。在全球气候中,热带地区吸收富余的太阳辐射,再通过大气和海洋环流输送到中高纬度地区,实现全球能量的再分配。在此过程中,热带地区(特别是热带海洋上)下层大气受地表加热的影响,形成对流降水,并在大气上层释放凝结潜热,这是大气环流最重要的驱动力。由此可知,热带降水的分布对全球能量的再分配有重要的作用,因此研究其在全球变暖下的变化是全球变暖区域气候动力学的重要研究方向,一直以来受到气候变化学界的重点关注[8,9,10,11]。
相关研究表明,在未来全球变暖下,热带降水将会增多[12],极端降水事件的发生频率也将提高[13,14,15]。但热带降水在不同区域对全球变暖的响应并不完全相同,这意味着热带降水的空间分布也会发生重要的变化[8,16~18]。由于动力过程认识不清、模式缺陷明显、多模式预估结果差异较大等问题,预估未来热带降水区域分布的变化一直是气候变化预估的重点和难点问题。本文将对全球变暖下热带降水变化研究进行回顾,分析总结当前的研究进展,在此基础上提出一些今后需要进一步关注的问题。
过去40年卫星观测的快速发展给我们提供了较稳定的全面研究热带降水变化的途径,如全球降水气候中心提供的全球月平均—观测降水资料(Global Precipitation Climatology Project, GPCP)[19]和美国国防卫星计划提供的SSM/I (Special Sensor Microwave/Image)数据等。尽管不同的资料中热带降水的变化呈现出差异,但总的研究表明:全球变暖下全球水循环将会增强,热带降水气候平均态呈现湿的区域降水增多、干的区域降水减少的变化特征,即“湿更湿、干更干”的变化特征[20,21,22]。在全球变暖背景下,更暖的大气可以容纳更多的水汽。在相对湿度(比湿/饱和比湿)基本不变的情况下,比湿(水汽质量与空气总质量的比值)会随着饱和比湿的增加而增加。根据Clausius-Clapeyron方程,未来水汽将以约7.5%/℃的速率增加(图1a)[18],更多的水汽将带来更多的降水。这样“湿更湿、干更干”的气候平均降水变化将同时增加全球干旱和洪涝等灾害的发生频次[15]。
图1 全球变暖背景下CMIP3模式模拟的水汽、降水、辐射、温度等变量的变化之间的关系[
(a)温度与水汽的关系;(b)温度与降水的关系;(c)地表净向下辐射与降水的关系;(d)大气净辐射冷却与降水的关系
Fig.1 The relationship between projected changes and projected temperature and rainfall changes simulated in the CMIP3 models under global warming[
(a) Temperature change vs. column-integrated water vapor change; (b)Temperature change vs. precipitation change;(c)Precipitation change vs. net downward radiation change at the surface; (d) Precipitation change vs. net radiative cooling change of the atmosphere
观测证据表明,在1987—2006年的20年中,降水总量增加速率与水汽含量增加速率相当,大约为7%/℃。然而气候模式预测的未来热带降水总量增加速率为1%/℃~3%/℃[12],远小于水汽含量的增加速率7%/℃[11]。对于观测和模式预估的降水增加速率差别产生的原因而言,目前没有明确的结论。可能的原因有以下几个[11]:①观测资料的时间长度只有20年,过短的资料时间跨度使得气候内部变率对结果造成较大的影响;②卫星资料本身的误差;③气候模式内部物理机制的错误使得模式预估的降水增加速率偏低。
降水“湿更湿、干更干”的变化特征在干、湿季节转变中表现的更为明显[20]。最近32年(1979—2010年)湿季(定义为一年中降水的3月滑动平均最大值所属的3个月,反之为干季)变得更湿,而干季更干,全球平均气温每上升1 ℃,湿季降水量增加约13.6%(10.7%~16.5%),干季降水量减少约39.0%(31.7%~46.2%),而干湿季的年降水差则增加约33.7%(27.2%~40.2%)[20]。干湿季降水差的扩大对诸如山地地区水资源的存储和利用等带来很大的威胁。
在热带区域降水变化上,“湿更湿、干更干”的变化特征并不完全适用[24]。由于人为气溶胶的排放,海洋观测资料长期变化的可靠性,以及粗糙的地面观测资料等因素的影响[25],从观测资料得出的结论并不总是符合“湿更湿、干更干”的变化特征[26,27]。全球变暖对热带区域降水变化的贡献,需要对自然变率、气溶胶排放等因素的贡献进行量化以及排除[25,28]。除了“湿更湿、干更干”的变化机制,还有其他的机制会影响降水的变化,例如海温变化分布型导致的环流变化对降水变化产生影响[16,29],但在观测方面还需要更多的证据来证明[30]。
在热带降水极端事件发生频率方面,观测证据表明,强降水事件发生频率增加速率与水汽含量约7%/℃的增加速率一致[21,31]。对于短时的强降水事件而言,未来的发生频率将会有更加显著的提升[32]。这意味着由强降水事件造成的洪涝灾害的局地受损程度可能远大于受灾地区的平均受损程度。
气候模式预估的全球变暖下未来降水变化将以1%/℃~3%/℃的速率增加,低于Clausius-Clapeyron方程决定的约7.5%/℃水汽增加的速率(图1a和1b)。早在20世纪末,已有研究分别通过数值试验和观测分析证明,水循环的整体强度变化是由大气辐射冷却和降水带来的潜热释放之间的平衡决定的[33,34]。地表和大气的辐射能量平衡中主要有以下3项[35]:①地表的净辐射加热项ΔRsfc(Δ代表未来变化,即未来气候态减去当前气候态);②大气的净辐射冷却项ΔRatm;③向上的潜热通量项LΔP(L为水的蒸发潜热,P为降水)。以上三者的平衡限制了降水的增多:
全球变暖背景下,降水的增多ΔP受制于ΔRatm以及ΔRsfc。模式中ΔRsfc的增加会有相应的蒸发冷却的增加来平衡(图1c);而ΔRatm的增加也会有相应的降水潜热释放的增加来平衡(图1d)。因此,想要深入理解全球平均降水对全球变暖的响应,必须要考虑到它与辐射能量平衡的关系。
在此研究的基础上,后续的研究对全球变暖背景下辐射变化对降水的影响进行了更加深入的分析。有研究认为,尽管降水的增多主要受制于大气晴空辐射冷却,但在此过程中另有2个重要的反馈过程:全球变暖使云的向外辐射增强,而减少了增加的水汽向降水转化的负反馈过程;以及由于大气净感热通量的减少导致的更多水汽向降水转化的正反馈过程[36]。这2个反馈过程相互抵消,最终大气晴空辐射冷却的变化,控制了增加的水汽向降水转化的能力,限制了降水的增多[36,37] 。也有研究从表面蒸发的角度,通过分析风速、海气温差和海洋表面的微弱变化,认为表面蒸发增加速率与水汽增加速率之间的差异是降水增多被限制的原因[38]。
未来水汽与降水的增加速率之间的这种差别, 将会导致大气总体的质量输送减弱[18]。在热带地区,降水主要发生在边界层以上的自由大气,我们可以简单认为降水P等于边界层混合比q与边界层自由大气之间的质量交换率M的乘积,即P=Mq。当降水增加速率低于水汽增加速率时,必然会导致降水区总体大气环流减弱[18]。从能量的角度理解,全球变暖下水汽增加,原有大气环流的强度会让更多的热带地表剩余辐射能量输送到别的地区,而由于以上辐射能量增速的限制无法维持这样的能力输送,因而原来大气环流质量输送的强度必然减弱[32,39]。从能量限制角度可以知道,这种大气中水汽输送的减弱是全球整体的限制,而非各区域都等比例减弱,各区域大气环流降水的变化受到更复杂的区域气候动力学的调制[32,39]。
在热带降水变化的研究中,水汽收支方程被广泛地使用在降水变化机制的研究中[8,10,17,40~42]。由于水循环中的水汽质量是守恒的,我们可以根据水汽收支方程,将总的降水变化与代表不同物理过程的项相联系。常用的水汽收支方程有多种不同的表达方式,其中使用最多的2种为:
方程(2)和方程(3)分别为Chou等[17]和Seager等[41]所使用的水汽收支方程。方程中的P, ρw, p,ω,q,u和E分别代表降水、水的密度、气压、垂直速度、比湿、水平风和蒸发。其中下标s和20则表示近地面项和背景气候态项。方程中的残差项包括瞬变涡项和非线性项,因为其值较小往往被略去。在水汽收支方程中,最重要的2项为“热力项”和“动力项”。热力项即为与水汽变化(Δq)相关的项,动力项为与环流变化(Δω)相关的项。Chou等[17]利用方程(2)对热带上升和下沉区域的“湿更湿”机制进行了细致的研究,而Seager等[41]则使用方程(3)研究了全球变暖背景下水汽的净通量变化。
Huang等[10]在热带降水变化的研究中,使用一种更简洁的水汽收支方程。该简化方法考虑将大气层分为2层的简化模型,上层为自由大气,下层为边界层,主要保留了热力项与动力项。简化过的水汽收支方程可由方程(2)推导而来:
式中:ω和q分别为500 hPa等压面的垂直速度和近地面比湿。与方程(2)和(3)相比,该方程中的热力项Δq·ω与动力项q·Δω更为简洁,对于复杂过程的分析更为便利。Huang等[10]通过该方程揭示了全球变暖下热带降水变化的分布是由“目前的气候平均降水分布”和“未来海温增长的分布型”2种响应机制共同决定的[16,18,28,40]。
这2种机制解释了全球变暖下引起降水变化的2个方面,共同构成了降水变化的空间和季节分布特征[10]。在全球变暖下,海温分布型将在热带赤道地区引起上升运动异常,而在两侧形成下沉运动异常,这一影响常年保持不变(图2a和2b);同时,气候平均的上升运动将更湿的大气抬升引起降水增加,而这一影响随着季节变化而南北摆动(图2c)。海温变化和气候平均环流分别控制了方程(4)中的动力和热力过程,二者叠加形成了热带降水变化的季节和空间分布型[10](图2d)。
图2 全球变暖下纬向平均的热带环流变化和热带降水各分量变化的季节循环
(a)500 hPa垂直速度变化;(b)动力项;(c)热力项;(d)两者之和[
Fig.2 Seasonal cycle of circulation change and decomposition of precipitation change under global warming
(a) Circulation change at 500 hPa; (b) Dynamic component;(c) Thermodynamic component;(d) The sum of dynamic and thermodynamic components [
从年平均的热带降水变化来看,“湿更湿”和“暖更湿”这2种机制也共同发挥着作用[8]。气候平均的上升运动将更多的水汽抬升使得降水增加,而海温增暖超过了热带平均增暖的区域未来降水增多,而增暖较少的区域则未来降水减少(图3a 和3b)。2种机制在海洋性大陆以及东印度洋的降水变化互相抵消,最终在热带太平洋区域形成了一个钩状的降水增加区域,在北印度洋形成了一个椭圆形的降水增加区域[8](图3c),而降水减少的区域较小。
图3 全球变暖下热带降水年平均变化的动力和热力分量
(a)动力项;(b)热力项;(c)两者的总和;(a)绿色曲线为热力项的-3×10⁻³ Pa/(s·102)等值线;(c)红色曲线为降水变化0.4 mm/d等值线[
Fig.3 The decomposition of annual-mean rainfall changes under global warming
(a)The dynamic component; (b) Thermodynamic components; (c) The sum of dynamic and thermodynamic components. In (a), the green curves are the -3×10⁻³ Pa/(s·102) contour of thermodynamic component; In (c), the red curves are the 0.4 mm/d contour of rainfall change[
在以上研究多模式集合平均预估热带降水变化的特征及机制基础上,针对目前研究中的主要问题,近年来发展出新的研究思路和方向。本节从以下几个方面讨论目前较为热点的方向。这些研究从以往关注降水的年平均变化到其他时间尺度、从以往关注多模式集合平均变化到追溯模式间差异及成因、进一步追溯环流变化这一降水变化中的重要因子的成因等。这些研究对提高利用模式预估未来热带降水变化的可靠性,理解热带降水变化的物理机制都有重要的作用,是未来的热点研究方向。
热带降水在年际变率尺度上的异常也对全球气候变异有着重要的影响。如在影响全球极端气候中最重要的驱动因子“厄尔尼诺事件”(亦即赤道东太平洋海温年际暖异常事件)[43]发生期间,海温异常首先引起热带太平洋对流降水的变化,通过降水加热对流层上层,再通过大气波动将影响传播到全球[44]。热带地区降水异常是厄尔尼诺等热带气候模态影响全球气候的必要途径。因此热带降水年际变率在全球变暖下的变化也在最近的研究中受到广泛的关注[43,44,45,46]。
与降水气候平均态的水汽收支展开类似,在热带降水年际变率的研究中也常利用水汽通量展开方法,常用的有[9,47~49]:
式中:上撇号代表年际变率。其中公式(4)是较完备的公式,而公式(5)为 Huang等[9]在2015年的研究中引入。在降水年际变率的水汽展开中,常将水汽变化引起的变化称为热力项,而将环流变率引起的变化称为动力项。
以上的展开公式在研究全球变暖背景下厄尔尼诺引起的降水年际异常的变化机制方面取得了较好的效果[9,47~49]。Huang等[9]利用简化过的水汽收支方程揭示了增暖环境下厄尔尼诺海温对赤道太平洋降水影响的变化机制。2个主要的机制:全球变暖下,背景态水汽的增加会增强降水对厄尔尼诺海温异常的响应;厄尔尼诺海温强度的变化则通过环流强度的变化进而影响降水强度的变化。以上2种机制相互制约,两者之和的影响近似于零。而未来气候平均态的海温在中东太平洋地区增加较多,增强该地区降水对海温异常的响应,使得未来厄尔尼诺引起的热带太平洋降水很可能在中东太平洋地区增加而在西太平洋地区减少,造成未来厄尔尼诺对全球气候的影响分布型整体向东移动(图4)。相关研究更好地回答了模式预估的厄尔尼诺海温变化和降水变化的不同这一重要问题。在前人的研究中,尽管厄尔尼诺相关的未来海温异常强度并不确定,甚至部分气候模式预估其未来有可能减弱,但模式预估的未来厄尔尼诺引起的降水极端事件在中东太平洋很可能加强[47,50]。厄尔尼诺引起的热带太平洋降水异常型在未来的变化与厄尔尼诺引起的中高纬度环流异常型的变化很一致,他们都很可能增强并东移,其中降水型的变化起着重要的桥梁作用[50,51,52]。
图4 全球变暖下,各分量对ENSO引起的热带降水异常变化贡献示意图
Fig.4 Diagram illustrating the formation mechanisms of the changes in ENSO-driven rainfall variability
以上关于热带降水变化区域分布的机制研究表明:影响热带降水变化的因子主要为通过动力项起作用的热带环流变化和通过热力项起作用的水汽变化。在数值模拟和机制分析中,由Clausius-Clapeyron方程控制的水汽变化和平均温度的变化有相当确定的关系,预估的不确定性较小。而动力项中的环流变化,在物理机制和数值模拟2个方面都有较大的不确定性[10,53],是预估热带降水变化不确定性的主要来源[54,55,56,57]。
热带环流虽在未来预估中会有整体上的减弱,但其经向和纬向环流的预估结果并不一致[58]。模式模拟的沃克环流未来将会减弱,这与理论研究和观测事实一致[39]。而哈德莱环流在全球变暖的背景下是否会减弱,观测中不同资料和不同时段的选取,对结果的影响很大,无法用于证实模式模拟的结果[58]。但全球变暖导致哈德莱环流向极地扩张,使得干旱区向北扩张的这一变化趋势,在观测和模式研究中都有一致的结论[59,60,61]。此外,哈德来环流的上升支、热带辐合带是热带的深对流区域,也是热带降水的最大值区。其未来位置的变化,也影响着热带降水的未来变化。热带辐合带的位置主要受南北半球能量输送方向的影响,南北半球之间未来的温度变化差异,以及南北半球各自的海陆增温速度的差异,都会影响南北半球之间能量的输送[62,63]。在未来,热带辐合带将向增暖更多的半球移动,与之密切联系的热带降水也将发生巨大的变化[64]。但热带辐合带位置的变化对热带区域降水变化的影响,由于模式模拟中云辐射过程的不确定性[65],模式之间对未来热带区域降水的预估依然存在着很大的不确定性[66]。
影响环流的变化的因子除海温分布型之外,海陆热力差异的变化[67]、二氧化碳浓度增加的直接效应[56]等因子也起一定的作用。海陆热力差异的变化能影响海平面气压变化,因为海陆热力差异的变化会导致相应的对流层整层温度发生变化,使得海平面气压改变[67],并且海陆热力差异主要依赖于水汽,模式预估未来较为干旱的区域增温较多,从而海平面气压降低较多,上升运动变得容易触发,引起环流的变化[67]。另一方面,二氧化碳浓度增加的直接效应可以减少大气向太空辐射能量,减弱大气的辐射冷却,从而使得大气更加稳定,进而造成大尺度的环流减弱[56]。二氧化碳的直接效应不同于第三节提到的辐射能量限制对于环流的减弱[18,38]。环流变化机制研究的不全面增加了预估的不确定性。
在气候模式预估中,各模式预估的环流变化也有较大的差距,这和模式中广泛存在的一些不确定因素有关[68]。最主要的有:①气候模式中存在多个与环流变化相关的物理参数化过程,不同的模式对这些物理参数化过程缺乏共同认识,采用的参数化方案也多有不同,这导致模式间预估的结果差异较大[69]。②观测资料的不确定性。由于目前观测资料的时间长度有限,不够完整的空间覆盖和观测误差等因素都限制了我们对气候模式的模拟能力进行评估,进而影响模式预估的结果。例如热带太平洋的海温,由不同的观测资料得出的预估结果可能呈现不同的未来海温分布型,导致不同的环流变化预估结果,最终使得降水变化预估结果产生不一致[70,71]。③气候模式的本身存在着一些偏差,也削弱了模式预估的可靠性。例如模式中长期存在的双赤道辐合带偏差,它和模式对多个海气耦合过程描述的缺陷都有直接的联系,这些偏差都可能会影响到未来南太平洋岛屿的环流与降水变化预估[72]。
除模式间预估结果差异较大之外,模式对当前气候背景态的模拟与观测相比也存在显著的系统性误差,这是影响目前气候模式对未来气候变化预估可信度的另一重要因素。特别是一些在目前的模式中普遍存在的、多模式所共有的系统性偏差,很可能造成在对未来气候的多模式集合预估中存在“虚假的”系统性偏差,影响模式预估的可信度。前人在研究极地气候平均变化中,提出“观测约束”(observational/emergent constraints)思想[73,74,75]以减弱模式间的差异并根据观测校订多模式集合预估中的“共性”偏差,提高模式预估的可信度。“观测约束”方法利用各模式模拟当前气候和预估未来气候变化的模式间差异,通过线性统计方法建立起模式中普遍存在的“当前气候—未来变化”的线性关系,再通过“观测的”当前气候“映射”预估未来气候变化[73,74,75]。
Huang等[76]针对热带海温、降水等空间非均一的气候变化预估,扩展了最初针对区域平均的“观测约束”思想和方法,提出一个“空间分布型多模式回归校订”的思路和方法(Ensemble Pattern Regression, EPR)。利用此方法Huang等[76]校订了多模式预估的热带太平洋海温增暖型和热带太平洋降水(图5)。对海温,模式中普遍存在冷舌过强、东南太平洋暖偏差、暖池较窄等系统性误差(图5a),“观测约束”校订指出这些偏差将在全球变暖背景下导致模式模拟出类似于拉尼娜型的海温增暖偏差,当把这种偏差去除之后,未来热带太平洋地区的海温增暖型将呈现为更典型的类厄尔尼诺型分布(图5c)。背景态海温的系统性误差将导致未来中东太平洋降水偏低而西太平洋降水偏高。在多模式集合的预估结果中除去这些共性偏差后,中东太平洋的降水显著增强而西太平洋降水减弱,表现为更明显的“湿更湿”的降水变化分布型,与校订后的海温变化空间分布型相匹配。
图5 模式预估的未来热带太平洋降水在修订前后的对比
(a)模式预估的未来降水(填色),1 000 hPa风和相对海温的变化;(b)利用EPR方法估计的预估的未来降水(填色),风和相对海温变化的共同偏差;(c)经过校订之后的降水(填色),1 000 hPa风和相对海温的变化[
Fig.5 The comparison between the corrected and original precipitation change
(a) Projected changes in precipitation (shaded), 1 000 hPa wind and relative SST; (b) Estimated change biases in precipitation (shaded) and 1 000 hPa wind; (c) Corrected changes in precipitation (shaded), 1 000 hPa wind (vectors), and relative SST[
本文回顾了近年来关于热带降水在全球变暖背景下变化的特征、机制及未来增暖情景下的预估等研究的最新进展。主要介绍了近几十年观测中的热带降水变化、热带降水变化的原因以及机制、区域降水变化的水汽展开研究方法、热带降水年际变率的变化、降水变化不确定性归因及模式预估不确定性的校订方法等若干方面。尽管关于热带降水变化已经开展了相当广泛的研究,但当前气候模式的未来变化预估还是面临着很多挑战[77,78]。
首先,对于环流变化这一影响区域降水变化预估不确定性的主要因子,其变化机制尚不完全清楚,各模式模拟预估的差异仍比较大,这方面的研究与探索才刚起步。热带降水、环流、海温分布变化的复杂耦合关系将是未来研究多模式集合预估可信度和模式间的不确定性的重要方向。阐述其中的机制,并通过观测进一步明确其中关键因素的协同变化,提高模式对真实海气耦合过程的再现,以缩小热带区域气候预估的不确定性[68]。
其次,大型计算机的计算能力提高可使气候模式增加其复杂程度,以及获得更高的分辨率,有利于研究的深入展开[79]。如近期有研究表明[68],在50 km网格的分辨率上,大气模式在模拟热带地区复杂的中小尺度对流降水过程的技巧上都有显著的提高,例如显著提高了对热带气旋的模拟技巧。对热带气候系统的数值模拟的提高为进一步研究全球变暖下热带降水在各时间尺度的变化提供了新的机会。但模式分辨率的提高,并不意味着气候预估中存在的问题会被自然而然地解决,将模拟和观测结合并深入揭示其中的物理过程仍将是提高预估结果的必要过程[68]。
第三,多模式集合预估已成为目前预估未来气候变化常用的手段,多模式集合预估结果的一致性是气候变化稳健性的标识,但我们也应考虑多模式在历史模拟中存在的系统偏差和较弱的观测限制对预估结果的影响。评估模式之间共存的偏差,并且最终减少它们对未来气候变化预估的影响是我们当前面临的一个巨大的挑战。我们应该利用模式设计出更多巧妙的,创新的实验来揭示模拟偏差影响预估结果的机制,并最终提高模式预估未来气候变化结果的可信度[80,81]。
The authors have declared that no competing interests exist.
| [1] |
Changes in precipitation with climate change [J]. |
| [2] |
The changing character of precipitation [J]. |
| [3] |
Changes of extreme indices over China in response to 1. 5 ℃ global warming projected by a regional climate model [J].全球1.5 ℃温升背景下中国极端事件变化的区域模式预估 [J].
利用区域海气耦合模式FROALS模拟的区域气候模式降尺度协同试验(CORDEX)的东亚区域的动力降尺度试验数据。分析了全球1.5℃温升背景下中国地区极端温度指数、极端降水指数以及民生相关指数的可能变化。结果表明,中国地区的暖事件显著增加,冷事件显著减少。高强度和中等强度极端暖事件发生风险分别为1986-2005年基准期的2.14和1.93倍,高强度和中等强度极端冷事件发生风险分别为基准期的0.58和0.63倍。分区来看,华北的高强度极端暖事件增幅最大(将为基准期的2.94倍),东北高强度极端冷事件减幅最大(将为基准期的0.38倍)。西北、青藏高原以及东北等地区的极端干旱事件发生风险略增加(分别为基准期的1.13,1.04,1.22倍)。全国大部分地区的平均降水显著增加,高强度的极端降水事件在全国普遍增加,并且在华北和东南的发生风险增幅最大(分别为基准期的1.88倍和1.85倍)。闷热日数在东部地区显著增加,并且与单一的极端高温事件相比,极端闷热日数的增加风险更大(将为基准期的5.34倍)。全国取暖度日显著减少,东部以及西北的降温度日显著增加,在人口密度较大的东部地区取暖度日的减幅(-258℃·d)大于降温度日的增幅(72℃·d),但与基准期相比,降温度日的变化比例(82%)大于取暖度日(-10%)。
|
| [4] |
Review on worldwide studies for impact of climate change on water [J].国内外关于气候变化对水的影响的研究进展 [J].
简要介绍了由WMO、UNESCO、UNDP和IAHS等一些国际组织发起并推动开展的气候变化国际合作研究计划和我国自20世纪90年代以来先后开展实施的国家科技攻关计划等重大气候变化研究项目的基本情况。综述了气候变化的事实、情景及其对水利的影响评价等方面的研究成果。最后,针对目前我国水利的实际情况,指出"十二五"期间应在8个方面进一步加强对气候变化的研究。
|
| [5] |
Studies for impact of climate change on hydrology and water resources [J].气候变化对水循环与水资源的影响研究综述 [J].
<p>以全球变暖为主的气候变化已成为当前世界最重要的环境问题之一。气候变化对水循环与水资源影响的研究越来越引起国内外学者的的高度关注和重视。简要回顾了国内外气候变化对水文水资源影响研究的发展历程,着重论述了目前气候变化对水文水资源影响的重点研究领域:水循环要素变化的检测与归因分析、气候变化与人类活动对水循环与水资源影响的定量评估、未来气候变化情景下水循环与水资源的演变趋势预估、气候变化对极端水文事件的影响研究和应对气候变化的水资源适应性管理策略;并介绍了气候变化对水文水资源影响研究中的气候变化情景、水文模拟及陆-气模型耦合等重要技术手段。最后,针对目前研究中存在的问题及薄弱环节,提出未来研究的发展趋势和亟需解决的关键问题。</p>
|
| [6] |
Water security and the countermeasures in South Asia based on the "belt and road" initiative [J].基于“一带一路”的南亚水安全与对策 [J]. |
| [7] |
Climate phenomena and their relevance for future regional climate change[M]∥Stocker T F, Qin D, Plattner G K , |
| [8] |
Regional response of annual-mean tropical rainfall to global warming [J].
Regional response of annual-mean tropical rainfall to global warming is investigated based on 18 models from the Coupled Model Intercomparison Project 5. With surface warming, the climatological ascending circulation pumps up increased surface moisture and leads to a rainfall increase over the convergence zone, while the change in ascending flow induces a rainfall increase over the region with sea surface temperature (SST) increase exceeding the tropical mean, with a concomitant modification of background surface moisture and SST. These two effects form a hook-like pattern of rainfall change over the tropical Pacific and an elliptic pattern over the northern Indian Ocean.
|
| [9] |
Mechanisms of change in ENSO-induced tropical Pacific rainfall variability in a warming climate [J].
ENSO-driven rainfall patterns are set to change as the climate warms. A moisture budget decomposition of simulations from 18 climate models reveals the mechanisms driving the shift in rainfall variability from western to central Pacific.
|
| [10] |
Patterns of the seasonal response of tropical rainfall to global warming [J].
Tropical convection is an important factor in regional climate variability and change around the globe . The response of regional precipitation to global warming is spatially variable, and state-of-the-art model projections suffer large uncertainties in the geographic distribution of precipitation changes . Two views exist regarding tropical rainfall change: one predicts increased rainfall in presently rainy regions (wet-get-wetter) , and the other suggests increased rainfall where the rise in sea surface temperature exceeds the mean surface warming in the tropics (warmer-get-wetter). Here we analyse simulations with 18 models from the Coupled Model Intercomparison Project (CMIP5), and present a unifying view for seasonal rainfall change. We find that the pattern of ocean warming induces ascending atmospheric flow at the Equator and subsidence on the flanks, anchoring a band of annual mean rainfall increase near the Equator that reflects the warmer-get-wetter view. However, this climatological ascending motion marches back and forth across the Equator with the Sun, pumping moisture upwards from the boundary layer and causing seasonal rainfall anomalies to follow a wet-get-wetter pattern. The seasonal mean rainfall, which is the sum of the annual mean and seasonal anomalies, thus combines the wet-get-wetter and warmer-get-wetter trends. Given that precipitation climatology is well observed whereas the pattern of ocean surface warming is poorly constrained , our results suggest that projections of tropical seasonal mean rainfall are more reliable than the annual mean.
|
| [11] |
How much more rain will global warming bring [J].
Climate models and satellite observations both indicate that the total amount of water in the atmosphere will increase at a rate of 7% per kelvin of surface warming. However, the climate models predict that global precipitation will increase at a much slower rate of 1 to 3% per kelvin. A recent analysis of satellite observations does not support this prediction of a muted response of precipitation to global warming. Rather, the observations suggest that precipitation and total atmospheric water have increased at about the same rate over the past two decades.
|
| [12] |
Long-term climate change: Projections, commitments and irreversibility[M]∥Stocker T F, Qin D, Plattner G K , |
| [13] |
A canonical response of precipitation characteristics to global warming from CMIP5 models [J].
In this study, we find from analyses of projections of 14 CMIP5 models a robust, canonical global response in rainfall characteristics to a warming climate. Under a scenario of 1% increase per year of CO2 emission, the model ensemble projects globally more heavy precipitation (+7 +/- 2.4%K-1), less moderate precipitation (-2.5 +/- 0.6%K-1), more light precipitation (+1.8 +/- 1.3%K-1), and increased length of dry (no-rain) periods (+4.7 +/- 2.1%K-1). Regionally, a majority of the models project a consistent response with more heavy precipitation over climatologically wet regions of the deep tropics, especially the equatorial Pacific Ocean and the Asian monsoon regions, and more dry periods over the land areas of the subtropics and the tropical marginal convective zones. Our results suggest that increased CO2 emissions induce a global adjustment in circulation and moisture availability manifested in basic changes in global precipitation characteristics, including increasing risks of severe floods and droughts in preferred geographic locations worldwide.
|
| [14] |
Future changes to the intensity and frequency of short-duration extreme rainfall [J].
Abstract Evidence that extreme rainfall intensity is increasing at the global scale has strengthened considerably in recent years. Research now indicates that the greatest increases are likely to occur in short-duration storms lasting less than a day, potentially leading to an increase in the magnitude and frequency of flash floods. This review examines the evidence for subdaily extreme rainfall intensification due to anthropogenic climate change and describes our current physical understanding of the association between subdaily extreme rainfall intensity and atmospheric temperature. We also examine the nature, quality, and quantity of information needed to allow society to adapt successfully to predicted future changes, and discuss the roles of observational and modeling studies in helping us to better understand the physical processes that can influence subdaily extreme rainfall characteristics. We conclude by describing the types of research required to produce a more thorough understanding of the relationships between local-scale thermodynamic effects, large-scale atmospheric circulation, and subdaily extreme rainfall intensity.
|
| [15] |
Mechanisms for global warming impacts on precipitation frequency and intensity [J].
ABSTRACT Global warming mechanisms that cause changes in frequency and intensity of precipitation in the tropics are examined in climate model simulations. Under global warming, tropical precipitation tends to be more frequent and intense for heavy precipitation but becomes less frequent and weaker for light precipitation. Changes in precipitation frequency and intensity are both controlled by thermodynamic and dynamic components. The thermodynamic component is induced by changes in atmospheric water vapor, while the dynamic component is associated with changes in vertical motion. A set of equations is derived to estimate both thermodynamic and dynamic contributions to changes in frequency and intensity of precipitation, especially for heavy precipitation. In the thermodynamic contribution, increased water vapor reduces the magnitude of the required vertical motion to generate the same strength of precipitation, so precipitation frequency increases. Increased water vapor also intensifies precipitation due to the enhancement of water vapor availability in the atmosphere. In the dynamic contribution, the more stable atmosphere tends to reduce the frequency and intensity of precipitation, except for the heaviest precipitation. The dynamic component strengthens the heaviest precipitation in most climate model simulations, possibly due to a positive convective feedback.
|
| [16] |
Global warming pattern formation: Sea surface temperature and rainfall [J].
Spatial variations in sea surface temperature (SST) and rainfall changes over the tropics are investigated based on ensemble simulations for the first half of the twenty-first century under the greenhouse gas (GHG) emission scenario A1B with coupled ocean09“atmosphere general circulation models of the Geophysical Fluid Dynamics Laboratory (GFDL) and National Center for Atmospheric Research (NCAR). Despite a GHG increase that is nearly uniform in space, pronounced patterns emerge in both SST and precipitation. Regional differences in SST warming can be as large as the tropical-mean warming. Specifically, the tropical Pacific warming features a conspicuous maximum along the equator and a minimum in the southeast subtropics. The former is associated with westerly wind anomalies whereas the latter is linked to intensified southeast trade winds, suggestive of wind09“evaporation09“SST feedback. There is a tendency for a greater warming in the northern subtropics than in the southern subtropics in accordance with asymmetries in trade wind changes. Over the equatorial Indian Ocean, surface wind anomalies are easterly, the thermocline shoals, and the warming is reduced in the east, indicative of Bjerknes feedback. In the midlatitudes, ocean circulation changes generate narrow banded structures in SST warming. The warming is negatively correlated with wind speed change over the tropics and positively correlated with ocean heat transport change in the northern extratropics. A diagnostic method based on the ocean mixed layer heat budget is developed to investigate mechanisms for SST pattern formation. Tropical precipitation changes are positively correlated with spatial deviations of SST warming from the tropical mean. In particular, the equatorial maximum in SST warming over the Pacific anchors a band of pronounced rainfall increase. The gross moist instability follows closely relative SST change as equatorial wave adjustments flatten upper-tropospheric warming. The comparison with atmospheric simulations in response to a spatially uniform SST warming illustrates the importance of SST patterns for rainfall change, an effect overlooked in current discussion of precipitation response to global warming. Implications for the global and regional response of tropical cyclones are discussed.
|
| [17] |
Evaluating the "rich-get-richer" mechanism in tropical precipitation change under global warming [J].
Examining tropical regional precipitation anomalies under global warming in 10 coupled global climate models, several mechanisms are consistently found. The tendency of rainfall to increase in convergence zones with large climatological precipitation and to decrease in subsidence regions - the rich-get-richer mechanism - has previously been examined in different approximations by Chou and Neeli...
|
| [18] |
Robust responses of the hydrological cycle to global warming [J]. |
| [19] |
The version-2 Global Precipitation Climatology Project (GPCP) monthly precipitation analysis (1979-present) [J].
The Global Precipitation Climatology Project (GPCP) Version-2 Monthly Precipitation Analysis is described. This globally complete, monthly analysis of surface precipitation at 2.5 latitude 2.5 longitude resolution is available from January 1979 to the present. It is a merged analysis that incorporates precipitation estimates from low-orbit satellite microwave data, geosynchronous-orbit satellite infrared data, and surface rain gauge observations. The merging approach utilizes the higher accuracy of the low-orbit microwave observations to calibrate, or adjust, the more frequent geosynchronous infrared observations. The dataset is extended back into the premicrowave era (before mid-1987) by using infrared-only observations calibrated to the microwave-based analysis of the later years. The combined satellite-based product is adjusted by the rain gauge analysis. The dataset archive also contains the individual input fields, a combined satellite estimate, and error estimates for each field. This monthly analysis is the foundation for the GPCP suite of products, including those at finer temporal resolution. The 23-yr GPCP climatology is characterized, along with time and space variations of precipitation.
|
| [20] |
Increase in the range between wet and dry season precipitation [J].
Global temperatures have risen over the past few decades. The water vapour content of the atmosphere has increased as a result, strengthening the global hydrological cycle(1-4). This, in turn, has led to wet regions getting wetter, and dry regions drier(1-6). Climate model simulations suggest that a similar intensification of existing patterns may also apply to the seasonal cycle of rainfall(7). Here, we analyse regional and global trends in seasonal precipitation extremes over the past three decades, using a number of global and land-alone observational data sets. We show that globally the annual range of precipitation has increased, largely because wet seasons have become wetter. Although the magnitude of the shift is uncertain, largely owing to limitations inherent in the data sets used, the sign of the tendency is robust. On a regional scale, the tendency for wet seasons to get wetter occurs over climatologically rainier regions. Similarly, the tendency for dry season to get drier is seen in drier regions. Even if the total amount of annual rainfall does not change significantly, the enhancement in the seasonal precipitation cycle could have marked consequences for the frequency of droughts and floods.
|
| [21] |
Current changes in tropical precipitation [J].
Current changes in tropical precipitation from satellite data and climate models are assessed. Wet and dry regions of the tropics are defined as the highest 30% and lowest 70% of monthly precipitation values. Observed tropical ocean trends in the wet regime (1.8%/decade) and the dry regions (-2.6%/decade) according to the Global Precipitation Climatology Project (GPCP) over the period including Special Sensor Microwave Imager (SSM/I) data (1988-2008), where GPCP is believed to be more reliable, are of smaller magnitude than when including the entire time series (1979-2008) and closer to model simulations than previous comparisons. Analysing changes in extreme precipitation using daily data within the wet regions, an increase in the frequency of the heaviest 6% of events with warming for the SSM/I observations and model ensemble mean is identified. The SSM/I data indicate an increased frequency of the heaviest events with warming, several times larger than the expected Clausius-Clapeyron scaling and at the upper limit of the substantial range in responses in the model simulations.
|
| [22] |
Identifying external influences on global precipitation [J].
Changes in global (ocean and land) precipitation are among the most important and least well-understood consequences of climate change. Increasing greenhouse gas concentrations are thought to affect the zonal-mean distribution of precipitation through two basic mechanisms. First, increasing temperatures will lead to an intensification of the hydrological cycle ("thermodynamic" changes). Second, changes in atmospheric circulation patterns will lead to poleward displacement of the storm tracks and subtropical dry zones and to a widening of the tropical belt ("dynamic" changes). We demonstrate that both these changes are occurring simultaneously in global precipitation, that this behavior cannot be explained by internal variability alone, and that external influences are responsible for the observed precipitation changes. Whereas existing model experiments are not of sufficient length to differentiate between natural and anthropogenic forcing terms at the 95% confidence level, we present evidence that the observed trends result from human activities.
|
| [23] |
Global warming and the weakening of the tropical circulation [J].
We explore the impact of CO2-induced reduction in the intensity of large-scale atmospheric circulation, resulting from global energetic constraints, on the tropical Pacific atmospheric and oceanic structure and circulation. We examine the projected 21^s^t Century response of the tropical circulation using a set of 22 climate model experiments performed for the IPCC-AR4. In all models there is a robust decrease in the strength of the atmospheric overturning circulation decreases as the climate warms; the circulation weakens in a manner consistent with simple thermodynamic arguments. The weakening occurs preferentially in the zonally-asymmetric (i.e., Walker) rather than zonal-mean (i.e., Hadley) component of the tropical circulation, and results in a weakening the near-equatorial easterlies in the Pacific Ocean. These wind changes induce substantial changes to the thermal structure and circulation of the tropical oceans. As climate warms, features of the changes in both the atmospheric and ocean circulation over the tropical Pacific Ocean resemble "El Nio-like" conditions; however, the mechanisms are shown to be distinct from those of El Nio and are reproduced in both mixed-layer and full ocean dynamics coupled climate models. Even though the mechanisms and structure differ from El Nio, aspects of climate teleconnections resemble those associated with El Nio. Changes seen in the consensus of models presented here are also consistent with recently detected changes in the tropical circulation during the 20^t^h Century.
|
| [24] |
Global assessment of trends in wetting and drying over land [J].
Changes in the hydrological conditions of the land surface have substantial impacts on society1, 2. Yet assessments of observed continental dryness trends yield contradicting results3, 4, 5, 6, 7. The concept that dry regions dry out further, whereas wet regions become wetter as the climate warms has been proposed as a simplified summary of expected8, 9, 10 as well as observed10, 11, 12, 13, 14 changes over land, although this concept is mostly based on oceanic data8, 10. Here we present an analysis of more than 300 combinations of various hydrological data sets of historical land dryness changes covering the period from 1948 to 2005. Each combination of data sets is benchmarked against an empirical relationship between evaporation, precipitation and aridity. Those combinations that perform well are used for trend analysis. We find that over about three-quarters of the global land area, robust dryness changes cannot be detected. Only 10.8% of the global land area shows a robustry gets drier, wet gets wetter pattern, compared to 9.5% of global land area with the opposite pattern, that is, dry gets wetter, and wet gets drier. We conclude that aridity changes over land, where the potential for direct socio-economic consequences is highest, have not followed a simple intensification of existing patterns.
|
| [25] |
Challenges in quantifying changes in the global water cycle [J]. |
| [26] |
Tropical drying trends in global warming models and observations [J].
Anthropogenic changes in tropical rainfall are evaluated in a multimodel ensemble of global warming simulations. Major discrepancies on the spatial distribution of these precipitation changes remain in the latest-generation models analyzed here. Despite this uncertainty, we find a number of measures, both global and local, on which reasonable agreement is obtained, notably for the regions of drying trend (negative precipitation anomalies). Models agree on the overall amplitude of the precipitation decreases that occur at the margins of the convective zones, with percent error bars of magnitude similar to those for the tropical warming. Similar agreement is found on a precipitation climate sensitivity defined here and on differential moisture increase inside and outside convection zones, a step in a hypothesized causal path leading to precipitation changes. A measure of local intermodel agreement on significant trends indicates consistent predictions for particular regions. Observed rainfall trends in several data sets show a significant summer drying trend in a main region of intermodel agreement: the Caribbean/Central-American region.
|
| [27] |
Large rainfall changes consistently projected over substantial areas of tropical land [J].
Many tropical countries are exceptionally vulnerable to changes in rainfall patterns, with floods or droughts often severely affecting human life and health, food and water supplies, ecosystems and infrastructure. There is widespread disagreement among climate model projections of how and where rainfall will change over tropical land at the regional scales relevant to impacts, with different models predicting the position of current tropical wet and dry regions to shift in different ways. Here we show that despite uncertainty in the location of future rainfall shifts, climate models consistently project that large rainfall changes will occur for a considerable proportion of tropical land over the twenty-first century. The area of semi-arid land affected by large changes under a higher emissions scenario is likely to be greater than during even the most extreme regional wet or dry periods of the twentieth century, such as the Sahel drought of the late 1960s to 1990s. Substantial changes are projected to occur by mid-century--earlier than previously expected--and to intensify in line with global temperature rise. Therefore, current climate projections contain quantitative, decision-relevant information on future regional rainfall changes, particularly with regard to climate change mitigation policy.
|
| [28] |
Detection of human influence on twentieth-century precipitation trends [J].
Abstract Human influence on climate has been detected in surface air temperature, sea level pressure, free atmospheric temperature, tropopause height and ocean heat content. Human-induced changes have not, however, previously been detected in precipitation at the global scale, partly because changes in precipitation in different regions cancel each other out and thereby reduce the strength of the global average signal. Models suggest that anthropogenic forcing should have caused a small increase in global mean precipitation and a latitudinal redistribution of precipitation, increasing precipitation at high latitudes, decreasing precipitation at sub-tropical latitudes, and possibly changing the distribution of precipitation within the tropics by shifting the position of the Intertropical Convergence Zone. Here we compare observed changes in land precipitation during the twentieth century averaged over latitudinal bands with changes simulated by fourteen climate models. We show that anthropogenic forcing has had a detectable influence on observed changes in average precipitation within latitudinal bands, and that these changes cannot be explained by internal climate variability or natural forcing. We estimate that anthropogenic forcing contributed significantly to observed increases in precipitation in the Northern Hemisphere mid-latitudes, drying in the Northern Hemisphere subtropics and tropics, and moistening in the Southern Hemisphere subtropics and deep tropics. The observed changes, which are larger than estimated from model simulations, may have already had significant effects on ecosystems, agriculture and human health in regions that are sensitive to changes in precipitation, such as the Sahel.
|
| [29] |
Regional patterns of sea surface temperature change: A source of uncertainty in future projections of precipitation and atmospheric circulation [J]. |
| [30] |
Responses of the tropical atmospheric circulation to climate change and connection to the hydrological cycle [J].
Projected changes in regional seasonal precipitation due to climate change are highly uncertain, with model disagreement on even the sign of change in many regions. Using a 20-member CMIP5 ensemble under the RCP8.5 scenario, the intermodel uncertainty of the spatial patterns of projected end-of-twenty-first-century change in precipitation is found not to be strongly influenced by uncertainty... [Show full abstract]
|
| [31] |
Atmospheric warming and the amplification of precipitation extremes [J].
Climate models suggest that extreme precipitation events will become more common in an anthropogenically warmed climate. However, observational limitations have hindered a direct evaluation of model-projected changes in extreme precipitation. We used satellite observations and model simulations to examine the response of tropical precipitation events to naturally driven changes in surface temperature and atmospheric moisture content. These observations reveal a distinct link between rainfall extremes and temperature, with heavy rain events increasing during warm periods and decreasing during cold periods. Furthermore, the observed amplification of rainfall extremes is found to be larger than that predicted by models, implying that projections of future changes in rainfall extremes in response to anthropogenic global warming may be underestimated.
|
| [32] |
Increase in hourly precipitation extremes beyond expectations from temperature changes [J].
Changes in precipitation extremes under greenhouse warming are commonly assumed to be constrained by changes in the amounts of precipitable water in the atmosphere. Global climate models generally predict only marginal changes in relative humidity, implying that the actual amount of atmospheric precipitable water scales with the water vapour content of saturation, which is governed by the Clausius-Clapeyron relation. Indeed, changes in daily precipitation extremes in global climate models seem to be consistent with the 7% increase per degree of warming given by the Clausius-Clapeyron relation, but it is uncertain how general this scaling behaviour is across timescales. Here, we analyse a 99-year record of hourly precipitation observations from De Bilt, the Netherlands, and find that one-hour precipitation extremes increase twice as fast with rising temperatures as expected from the Clausius-Clapeyron relation when daily mean temperatures exceed 12C. In addition, simulations with a high-resolution regional climate model show that one-hour precipitation extremes increase at a rate close to 14% per degree of warming in large parts of Europe. Our results demonstrate that changes in short-duration precipitation extremes may well exceed expectations from the Clausius-Clapeyron relation. These short-duration extreme events can have significant impacts, such as local flooding, erosion and water damage.
|
| [33] |
Atmospheric moisture residence times and cycling: Implications for rainfall rates and climate change [J].
New estimates of the moistening of the atmosphere through evaporation at the surface and of the drying through precipitation are computed. Overall, the e-folding residence time of atmospheric moisture is just over 8 days. New estimates are also made of how much moisture that precipitates out comes from horizontal transport versus local evaporation, referred to as ecycling. The results depend greatly on the scale of the domain under consideration and global maps of the recycling for annual means are produced for 500 km scales for which global recycling is 9.6%, consisting of 8.9% over land and 9.9% over the oceans. Even for 1000 km scales, less than 20% of the annual precipitation typically comes from evaporation within the domain. While average overall atmospheric moisture depletion and restoration must balance, precipitation falls only a small fraction of the time. Thus precipitation rates are also examined. Over the United States, one hour intervals with 0.1 mm or more are used to show that the frequency of precipitation ranges from over 30% in the Northwest, to about 20% in the Southeast and less than 4% just east of the continental divide in winter, and from less than 2% in California to over 20% in the Southeast in summer. In midlatitudes precipitation typically falls about 10% of the time, and so rainfall rates, conditional on when rain is falling, are much larger than evaporation rates. The mismatches in the rates of rainfall versus evaporation imply that precipitating systems of all kinds feed mostly on the moisture already in the atmosphere. Over North America, much of the precipitation originates from moisture advected from the Gulf of Mexico and subtropical Atlantic or Pacific a day or so earlier. Increases in greenhouse gases in the atmosphere produce global warming through an increase in downwelling infrared radiation, and thus not only increase surface temperatures but also enhance the hydrological cycle, as much of the heating at the surface goes into evaporating surface moisture. Global temperature increases signify that the water-holding capacity of the atmosphere increases and, together with enhanced evaporation, this means that the actual atmospheric moisture should increase. It follows that naturally-occurring droughts are likely to be exacerbated by enhanced potential evapotranspiration. Further, globally there must be an increase in precipitation to balance the enhanced evaporation but the processes by which precipitation is altered locally are not well understood. Observations confirm that atmospheric moisture is increasing in many places, for example at a rate of about 5% per decade over the United States. Based on the above results, we argue that increased moisture content of the atmosphere therefore favors stronger rainfall or snowfall events, thus increasing risk of flooding, which is a pattern observed to be happening in many parts of the world. Moreover, because there is a disparity between the rates of increase of atmospheric moisture and precipitation, there are implied changes in the frequency of precipitation and/or efficiency of precipitation (related to how much moisture is left behind in a storm). However, an analysis of linear trends in the frequency of precipitation events for the United States corresponding to thresholds of 0.1 and 1 mm/h shows that the most notable statistically significant trends are for increases in the southern United States in winter and decreases in the Pacific Northwest from November through January, which may be related to changes in atmospheric circulation and storm tracks associated with El Nio outhern Oscillation trends. It is suggested that as the physical constraints on precipitation apply only globally, more attention should be paid to rates in both observations and models as well as the frequency of occurrence.
|
| [34] |
Climate change and the regulation of the surface moisture and energy budgets [J].
The increase in the vigor of the hydrological cycle simulated in a 2 CO 2 experiment with the Canadian Climate Centre general circulation model is smaller than that obtained by other models which have similar increases in mean surface temperature. The surface energy budget, which encompasses also the moisture budget for the oceans, is analyzed. Changes in the net radiative input to and sensible heat flux from the surface act to warm it. This is balanced, at the new equilibrium, by a change in the latent heat flux which acts to cool it. Although this same general behavior is seen in other models, the increase in radiative input to the surface in the CCC GCM is smaller than in other models while the change in the sensible heat flux is of similar size. As a consequence, the latent heat flux required for balance is smaller. The comparatively small increase in the net radiative input at the surface occurs because of a decrease in the solar component. On average the decrease in solar input in the tropical region outweighs the higher latitude increase associated with the snow/ice albedo feedback. The notable tropical decrease in solar input occurs because the albedo of the clouds increase enough in this region to outweigh a small decrease in cloud amount. The increase in cloud albedo in the warmer and moister tropical atmosphere is a consequence of the parameterized cloud optical properties in the model which play an important role in the regulation of the surface energy and moisture budgets. The results demonstrate some of the consequences of the negative feedback mechanism associated with increasing cloud albedo in the model. They also suggest that the simulated change in the vigor of the hydrological cycle is not a simple function of the average increase in surface temperature but is a consequence of all of the processes in the model which control the available energy at the surface as a function of latitude.
|
| [35] |
Constraints on future changes in climate and the hydrologic cycle [J].
Abstract What can we say about changes in the hydrologic cycle on 50-year timescales when we cannot predict rainfall next week? Eventually, perhaps, a great deal: the overall climate response to increasing atmospheric concentrations of greenhouse gases may prove much simpler and more predictable than the chaos of short-term weather. Quantifying the diversity of possible responses is essential for any objective, probability-based climate forecast, and this task will require a new generation of climate modelling experiments, systematically exploring the range of model behaviour that is consistent with observations. It will be substantially harder to quantify the range of possible changes in the hydrologic cycle than in global-mean temperature, both because the observations are less complete and because the physical constraints are weaker.
|
| [36] |
Controls of global-mean precipitation increases in global warming gcm experiments [J].
The main findings of this paper are threefold. First, increases in the global precipitation track increase atmospheric radiative energy loss and the ratio of precipitation sensitivity to water vapor sensitivity is primarily determined by changes to this atmospheric column energy loss. A reference limit to this ratio is introduced as the rate at which the emission of radiation from the clear-sky atmosphere increases as water vapor increases. It is shown that the derived efficiency based on the simple ratio of precipitation to water vapor sensitivities of models in fact closely matches the sensitivity derived from simple energy balance arguments involving changes to water vapor emission alone. Second, although the rate of increase of clear-sky emission is the dominant factor in the change to the energy balance of the atmosphere, there are two important and offsetting processes that contribute to in the model simulations studied: One involves a negative feedback through cloud radiative heating that acts to reduce the efficiency; the other is the global reduction in sensible heating that counteracts the effects of the cloud feedback and increases the efficiency. These counteracting feedbacks only apply on the global scale. Third, the negative cloud radiative heating feedback occurs through reductions of cloud amount in the middle troposphere, defined as the layer between 680 and 440 hPa, and by slight global cloud decreases in the lower troposphere. These changes act in a manner to expose the warmer atmosphere below to high clouds, thus resulting in a net warming of the atmospheric column by clouds and a negative feedback on the precipitation.
|
| [37] |
An update on Earth's energy balance in light of the latest global observations [J].
Climate change is governed by changes to the global energy balance. At the top of the atmosphere, this balance is monitored globally by satellite sensors that provide measurements of energy flowing to and from Earth. By contrast, observations at the surface are limited mostly to land areas. As a result, the global balance of energy fluxes within the atmosphere or at Earth's surface cannot be derived directly from measured fluxes, and is therefore uncertain. This lack of precise knowledge of surface energy fluxes profoundly affects our ability to understand how Earth's climate responds to increasing concentrations of greenhouse gases. In light of compilations of up-to-date surface and satellite data, the surface energy balance needs to be revised. Specifically, the longwave radiation received at the surface is estimated to be significantly larger, by between 10 and 17 Wm612, than earlier model-based estimates. Moreover, the latest satellite observations of global precipitation indicate that more precipitation is generated than previously thought. This additional precipitation is sustained by more energy leaving the surface by evaporation — that is, in the form of latent heat flux — and thereby offsets much of the increase in longwave flux to the surface.
|
| [38] |
Muted precipitation increase in global warming simulations: A surface evaporation perspective [J].
[1] Atmospheric moisture content is expected to rise in response to global warming, but climate models predict a much slower rate of precipitation increase. This muted response of the hydrological cycle is investigated from a surface evaporation perspective, using a multimodel ensemble of simulations under the A1B forcing scenario. A 90-year analysis of surface evaporation based on a standard bulk formula reveals that the following atmospheric changes act to slow down the increase in surface evaporation over ice-free oceans: surface relative humidity increases by 1.0%, surface stability, as measured by air-sea temperature difference, increases by 0.2 K, and surface wind speed decreases by 0.02 m/s. As a result of these changes, surface evaporation increases by only 2% per Kelvin of surface warming, rather than the 7%/K rate simulated for atmospheric moisture. The increased surface stability and relative humidity are robust across models. The former is nearly uniform over ice-free oceans while the latter features a subtropical peak on either side of the equator. While relative humidity changes are positive almost everywhere in a thin surface layer, changes aloft show positive trends in the deep tropics and negative ones in the subtropics. The surface-trapped structure suggests the following mechanism: owing to its thermal inertia, the ocean lags behind the atmospheric warming, and this retarding effect causes an increase in surface stability and relative humidity, analogously to advection fog. Our results call for observational efforts to monitor and detect changes in surface relative humidity and stability over the world ocean.
|
| [39] |
Weakening of tropical Pacific atmospheric circulation due to anthropogenic forcing [J].
Abstract Since the mid-nineteenth century the Earth's surface has warmed, and models indicate that human activities have caused part of the warming by altering the radiative balance of the atmosphere. Simple theories suggest that global warming will reduce the strength of the mean tropical atmospheric circulation. An important aspect of this tropical circulation is a large-scale zonal (east-west) overturning of air across the equatorial Pacific Ocean--driven by convection to the west and subsidence to the east--known as the Walker circulation. Here we explore changes in tropical Pacific circulation since the mid-nineteenth century using observations and a suite of global climate model experiments. Observed Indo-Pacific sea level pressure reveals a weakening of the Walker circulation. The size of this trend is consistent with theoretical predictions, is accurately reproduced by climate model simulations and, within the climate models, is largely due to anthropogenic forcing. The climate model indicates that the weakened surface winds have altered the thermal structure and circulation of the tropical Pacific Ocean. These results support model projections of further weakening of tropical atmospheric circulation during the twenty-first century.
|
| [40] |
Mechanisms of global warming impacts on regional tropical precipitation [J].
Mechanisms that determine the tropical precipitation anomalies under global warming are examined in an intermediate atmospheric model coupled with a simple land surface and a mixed layer ocean. To compensate for the warm tropospheric temperature, atmospheric boundary layer (ABL) moisture must increase to maintain positive convective available potential energy (CAPE) in convective regions. In nonconvective regions, ABL moisture is controlled by different balances and does not increase as much, creating a spatial gradient of ABL moisture anomalies. Associated with this spatial pattern of the ABL moisture anomalies are two main mechanisms responsible for the anomalous tropical precipitation. In the “upped-ante mechanism,” increases in ABL moisture are opposed by imported dry air wherever inflow from nonconvective regions over margins of convective regions occurs. The ABL moisture is not enough to meet the higher “convective ante” induced by the warmer tropospheric temperature, so precipitation is decreased. In the “anomalous gross moist stability mechanism,” gross moist stability is reduced due to increased ABL moisture. As a result, convection is enhanced and precipitation becomes heavier over convective regions. While the upped-ante mechanism induces negative precipitation anomalies over the margins of convective regions, the anomalous gross moist stability mechanism induces positive precipitation anomalies within convective regions. The importance of variation in gross moist stability, which is likely to differ among climate models, is suggested as a potential factor causing discrepancies in the predicted regional tropical precipitation changes.<HR ALIGN="center" WIDTH="30%">
|
| [41] |
Thermodynamic and dynamic mechanisms for large-scale changes in the hydrological cycle in response to global warming [J].
The mechanisms of changes in the large-scale hydrological cycle projected by 15 models participating in the Coupled Model Intercomparison Project phase 3 and used for the Intergovernmental Panel on Climate Change0964s Fourth Assessment Report are analyzed by computing differences between 2046 and 2065 and 1961 and 2000. The contributions to changes in precipitation minus evaporation, P 0903’ E, caused thermodynamically by changes in specific humidity, dynamically by changes in circulation, and by changes in moisture transports by transient eddies are evaluated. The thermodynamic and dynamic contributions are further separated into advective and divergent components. The nonthermodynamic contributions are then related to changes in the mean and transient circulation. The projected change in P 0903’ E involves an intensification of the existing pattern of P 0903’ E with wet areas [the intertropical convergence zone (ITCZ) and mid- to high latitudes] getting wetter and arid and semiarid regions of the subtropics getting drier. In addition, the subtropical dry zones expand poleward. The accentuation of the twentieth-century pattern of P 0903’ E is in part explained by increases in specific humidity via both advection and divergence terms. Weakening of the tropical divergent circulation partially opposes the thermodynamic contribution by creating a tendency to decreased P 0903’ E in the ITCZ and to increased P 0903’ E in the descending branches of the Walker and Hadley cells. The changing mean circulation also causes decreased P 0903’ E on the poleward flanks of the subtropics because the descending branch of the Hadley Cell expands and the midlatitude meridional circulation cell shifts poleward. Subtropical drying and poleward moistening are also contributed to by an increase in poleward moisture transport by transient eddies. The thermodynamic contribution to changing P 0903’ E, arising from increased specific humidity, is almost entirely accounted for by atmospheric warming under fixed relative humidity.
|
| [42] |
Intermodel variations in projected precipitation change over the North Atlantic: Sea surface temperature effect [J].
Abstract Intermodel variations in future precipitation projection in the North Atlantic are studied using 23 state-of-art models from Phase 5 of the Coupled Model Intercomparison Project. Model uncertainty in annual mean rainfall change is locally enhanced along the Gulf Stream. The moisture budget analysis reveals that much of the model uncertainty in rainfall change can be traced back to the discrepancies in surface evaporation change and transient eddy effect among models. Results of the intermodel Singular Value Decomposition (SVD) analysis show that intermodel variations in local sea surface temperature (SST) pattern exert a strong control over the spread of rainfall projection among models through the modulation of evaporation change. The first three SVD modes explain more than 60% of the intermodel variance of rainfall projection and show distinct SST patterns with mode water-induced banded structures, reduced subpolar warming due to ocean dynamical cooling, and the Gulf Stream shift, respectively.
|
| [43] |
ENSO theory [J]. |
| [44] |
The atmospheric bridge: The influence of ENSO teleconnections on air-sea interaction over the global oceans [J].
During El Nio-Southern Oscillation (ENSO) events, the atmospheric response to sea surface temperature (SST) anomalies in the equatorial Pacific influences ocean conditions over the remainder of the globe. This connection between ocean basins via the `atmospheric bridge' is reviewed through an examination of previous work augmented by analyses of 50 years of data from the National Centers for Environmental Prediction-National Center for Atmospheric Research (NCEP-NCAR) reanalysis project and coupled atmospheric general circulation (AGCM)-mixed layer ocean model experiments. Observational and modeling studies have now established a clear link between SST anomalies in the equatorial Pacific with those in the North Pacific, north tropical Atlantic, and Indian Oceans in boreal winter and spring. ENSO-related SST anomalies also appear to be robust in the western North Pacific during summer and in the Indian Ocean during fall. While surface heat fluxes are the key component of the atmospheric bridge driving SST anomalies, Ekman transport also creates SST anomalies in the central North Pacific although the full extent of its impact requires further study. The atmospheric bridge not only influences SSTs on interannual timescales but also affects mixed layer depth (MLD), salinity, the seasonal evolution of upper-ocean temperatures, and North Pacific SST variability at lower frequencies. The model results indicate that a significant fraction of the dominant pattern of low-frequency (>10 yr) SST variability in the North Pacific is associated with tropical forcing. AGCM experiments suggest that the oceanic feedback on the extratropical response to ENSO is complex, but of modest amplitude. Atmosphere-ocean coupling outside of the tropical Pacific slightly modifies the atmospheric circulation anomalies in the Pacific-North America (PNA) region but these modifications appear to depend on the seasonal cycle and air-sea interactions both within and beyond the North Pacific Ocean.
|
| [45] |
Sea surface temperature variability: Patterns and mechanisms [J].
Patterns of sea surface temperature (SST) variability on interannual and longer timescales result from a combination of atmospheric and oceanic processes. These SST anomaly patterns may be due to intrinsic modes of atmospheric circulation variability that imprint themselves upon the SST field mainly via Surface energy fluxes. Examples include SST fluctuations in the Southern Ocean associated with the Southern Annular Mode, a tripolar pattern of SST anomalies in the North Atlantic associated with the North Atlantic Oscillation, and a pan-Pacific mode known as the Pacific Decadal Oscillation (with additional contributions from oceanic processes). They may also result from coupled ocean-atmosphere interactions, such as the El Nino-Southern Oscillation phenomenon in the tropical Indo-Pacific, the tropical Atlantic Nino, and the cross-equatorial meridional modes ill the tropical Pacific and Atlantic. Finally, patterns of SST variability may arise from intrinsic oceanic modes, notably the Atlantic Multidecadal Oscillation.
|
| [46] |
ENSO as an integrating concept in earth science [J]. |
| [47] |
Robust twenty-first-century projections of El Niño and related precipitation variability [J].
The El Nino-Southern Oscillation (ENSO) drives substantial variability in rainfall(1-3), severe weather(4,5), agricultural production(3,6), ecosystems(7) and disease(8) in many parts of the world. Given that further human-forced changes in the Earth's climate system seem inevitable(9,10), the possibility exists that the character of ENSO and its impacts might change over the coming century. Although this issue has been investigated many times during the past 20 years, there is very little consensus on future changes in ENSO, apart from an expectation that ENSO will continue to be a dominant source of year-to-year variability(9,11,12). Here we show that there are in fact robust projected changes in the spatial patterns of year-to-year ENSO-driven variability in both surface temperature and precipitation. These changes are evident in the two most recent generations of climate models(13,14), using four different scenarios for CO2 and other radiatively active gases(14-17). By the mid- to late twenty-first century, the projections include an intensification of both El-Nino-driven drying in the western Pacific Ocean and rainfall increases in the central and eastern equatorial Pacific. Experiments with an Atmospheric General Circulation Model reveal that robust projected changes in precipitation anomalies during El Nino years are primarily determined by a nonlinear response to surface global warming. Uncertain projected changes in the amplitude of ENSO-driven surface temperature variability have only a secondary role. Projected changes in key characteristics of ENSO are consequently much clearer than previously realized.
|
| [48] |
Nonlinear precipitation response to El Niño and global warming in the Indo-Pacific [J].
|
| [49] |
Does global warming cause intensified interannual hydroclimate variability? [J]. |
| [50] |
Increasing frequency of extreme El Niño events due to greenhouse warming [J].
El Nio events are a prominent feature of climate variability with global climatic impacts. The 1997/98 episode, often referred to as 'the climate event of the twentieth century', and the 1982/83 extreme El Nio, featured a pronounced eastward extension of the west Pacific warm pool and development of atmospheric convection, and hence a huge rainfall increase, in the usually cold and dry equatorial eastern Pacific. Such a massive reorganization of atmospheric convection, which we define as an extreme El Nio, severely disrupted global weather patterns, affecting ecosystems, agriculture, tropical cyclones, drought, bushfires, floods and other extreme weather events worldwide. Potential future changes in such extreme El Nio occurrences could have profound socio-economic consequences. Here we present climate modelling evidence for a doubling in the occurrences in the future in response to greenhouse warming. We estimate the change by aggregating results from climate models in the Coupled Model Intercomparison Project phases 3 (CMIP3; ref. ) and 5 (CMIP5; ref. ) multi-model databases, and a perturbed physics ensemble. The increased frequency arises from a projected surface warming over the eastern equatorial Pacific that occurs faster than in the surrounding ocean waters, facilitating more occurrences of atmospheric convection in the eastern equatorial region.
|
| [51] |
Global warming-induced changes in El Niño teleconnections over the North Pacific and North America [J].
Abstract El Nio-Southern Oscillation (ENSO) induces climate anomalies around the globe. Atmospheric general circulation model simulations are used to investigate how ENSO-induced teleconnection patterns during boreal winter might change in response to global warming in the Pacific-North American sector. As models disagree on changes in the amplitude and spatial pattern of ENSO in response to global warming, for simplicity the same sea surface temperature (SST) pattern of ENSO is prescribed before and after the climate warming. In a warmer climate, precipitation anomalies intensify and move eastward over the equatorial Pacific during El Nio because the enhanced mean SST warming reduces the barrier to deep convection in the eastern basin. Associated with the eastward shift of tropical convective anomalies, the ENSO-forced Pacific-North American (PNA) teleconnection pattern moves eastward and intensifies under the climate warming. By contrast, the PNA mode of atmospheric internal variability remains largely unchanged in pattern, suggesting the importance of tropical convection in shifting atmospheric teleconnections. As the ENSO-induced PNA pattern shifts eastward, rainfall anomalies are expected to intensify on the west coast of North America, and the El Nio-induced surface warming to expand eastward and occupy all of northern North America. The spatial pattern of the mean SST warming affects changes in ENSO teleconnections. The teleconnection changes are larger with patterned mean warming than in an idealized case where the spatially uniform warming is prescribed in the mean state. The results herein suggest that the eastward-shifted PNA pattern is a robust change to be expected in the future, independent of the uncertainty in changes of ENSO itself.
|
| [52] |
Changes in El Niño and La Niña teleconnections over North Pacific-America in the global warming simulations [J].
The change in the teleconnections of both El Ni09o and La Ni09a over the North Pacific and American regions due to a future greenhouse warming has been analyzed herein by means of diagnostics of the Intergovernmental Panel on Climate Change-Fourth Assessment Report (IPCC-AR4) coupled general circulation models (CGCMs). Among the IPCC-AR4 CGCM simulations, the composites of the eight-member multimodel ensemble are analyzed. In most CGCMs, the tropical Pacific warming due to the increase of CO 2 concentration in the atmosphere promotes the main convection centers in the equatorial Pacific associated with both El Ni09o and La Ni09a to the east. The eastward shift of the convection center causes a systematic eastward shift of not only El Ni09o but also La Ni09a teleconnection patterns over the North Pacific and America, which is demonstrated in the composite maps of 50002hPa circulation, surface temperature, and the precipitation against El Ni09o and La Ni09a, as observed in a comparison between the pre-industrial and CO 2 doubling experiments. Thus, a systematic eastward migration of convection centers in the tropical Pacific associated with both El Ni09o and La Ni09a due to a future global warming commonly causes the eastward shift of the atmospheric teleconnection patterns over the Northern Hemisphere.
|
| [53] |
Climate response of the equatorial Pacific to global warming [J].
The climate response of the equatorial Pacific to increased greenhouse gases is investigated using numerical experiments from 11 climate models participating in the Intergovernmental Panel on Climate Change0964s Fourth Assessment Report. Multimodel mean climate responses to CO2 doubling are identified and related to changes in the heat budget of the surface layer. Weaker ocean surface currents driven by a slowing down of the Walker circulation reduce ocean dynamical cooling throughout the equatorial Pacific. The combined anomalous ocean dynamical plus radiative heating from CO2 is balanced by different processes in the western and eastern basins: Cloud cover feedbacks and evaporation balance the heating over the warm pool, while increased cooling by ocean vertical heat transport balances the warming over the cold tongue. This increased cooling by vertical ocean heat transport arises from increased near-surface thermal stratification, despite a reduction in vertical velocity. The stratification response is found to be a permanent feature of the equilibrium climate potentially linked to both thermodynamical and dynamical changes within the equatorial Pacific. Briefly stated, ocean dynamical changes act to reduce (enhance) the net heating in the east (west). This explains why the models simulate enhanced equatorial warming, rather than El Ni01±o09“like warming, in response to a weaker Walker circulation. To conclude, the implications for detecting these signals in the modern observational record are discussed.
|
| [54] |
Understanding uncertainties in future projections of seasonal tropical precipitation [J].
ABSTRACT Projected changes in regional seasonal precipitation due to climate change are highly uncertain, with model disagreement on even the sign of change in many regions. Using a 20-member CMIP5 ensemble under the RCP8.5 scenario, the intermodel uncertainty of the spatial patterns of projected end-of-twenty-first-century change in precipitation is found not to be strongly influenced by uncertainty in global mean temperature change. In the tropics, both the ensemble mean and intermodel uncertainty of regional precipitation change are found to be predominantly related to spatial shifts in convection and convergence, associated with processes such as sea surface temperature (SST) pattern change and land-sea thermal contrast change. The authors hypothesize that the zonal-mean seasonal migration of these shifts is driven by 1) the nonlinear spatial response of convection to SST changes and 2) a general movement of convection from land to ocean in response to SST increases. Assessment of tropical precipitation model projections over East Africa highlights the complexity of regional rainfall changes. Thermodynamically driven moisture increases determine the magnitude of the long rains (March-May) ensemble mean precipitation change in this region, whereas model uncertainty in spatial shifts of convection accounts for almost all of the intermodel uncertainty. Moderate correlations are found across models between the long rains precipitation change and patterns of SST change in the Pacific and Indian Oceans. Further analysis of the capability of models to represent present-day SST-rainfall links, and any relationship with model projections, may contribute to constraining the uncertainty in projected East Africa long rains precipitation.
|
| [55] |
Atmospheric circulation as a source of uncertainty in climate change projections [J].
The evidence for anthropogenic climate change continues to strengthen, and concerns about severe weather events are increasing. As a result, scientific interest is rapidly shifting from detection and attribution of global climate change to prediction of its impacts at the regional scale. However, nearly everything we have any confidence in when it comes to climate change is related to global patterns of surface temperature, which are primarily controlled by thermodynamics. In contrast, we have much less confidence in atmospheric circulation aspects of climate change, which are primarily controlled by dynamics and exert a strong control on regional climate. Model projections of circulation-related fields, including precipitation, show a wide range of possible outcomes, even on centennial timescales. Sources of uncertainty include low-frequency chaotic variability and the sensitivity to model error of the circulation response to climate forcing. As the circulation response to external forcing appears to project strongly onto existing patterns of variability, knowledge of errors in the dynamics of variability may provide some constraints on model projections. Nevertheless, higher scientific confidence in circulation-related aspects of climate change will be difficult to obtain. For effective decision-making, it is necessary to move to a more explicitly probabilistic, risk-based approach.
|
| [56] |
Robust direct effect of carbon dioxide on tropical circulation and regional precipitation [J].
Predicting the response of tropical rainfall to climate change remains a challenge(1). Rising concentrations of carbon dioxide are expected to affect the hydrological cycle through increases in global mean temperature and the water vapour content of the atmosphere(2-4). However, regional precipitation changes also closely depend on the atmospheric circulation, which is expected to weaken in a warmer world(4-6). Here, we assess the effect of a rise in atmospheric carbon dioxide concentrations on tropical circulation and precipitation by analysing results from a suite of simulations from multiple state-of-the-art climate models, and an operational numerical weather prediction model. In a scenario in which humans continue to use fossil fuels unabated, about half the tropical circulation change projected by the end of the twenty-first century, and consequently a large fraction of the regional precipitation change, is independent of global surfacewarming. Instead, these robust circulation and precipitation changes are a consequence of the weaker net radiative cooling of the atmosphere associated with higher atmospheric carbon dioxide levels, which affects the strength of atmospheric vertical motions. This implies that geo-engineering schemes aimed at reducing global warming without removing carbon dioxide from the atmosphere would fail to fully mitigate precipitation changes in the tropics. Strategies that may help constrain rainfall projections are suggested.
|
| [57] |
The potential to narrow uncertainty in projections of regional precipitation change [J].
We separate and quantify the sources of uncertainty in projections of regional (2,500km) precipitation changes for the twenty-first century using the CMIP3 multi-model ensemble, allowing a direct comparison with a similar analysis for regional temperature changes. For decadal means of seasonal mean precipitation, internal variability is the dominant uncertainty for predictions of the first decade everywhere, and for many regions until the third decade ahead. Model uncertainty is generally the dominant source of uncertainty for longer lead times. Scenario uncertainty is found to be small or negligible for all regions and lead times, apart from close to the poles at the end of the century. For the global mean, model uncertainty dominates at all lead times. The signal-to-noise ratio (S/N) of the precipitation projections is highest at the poles but less than 1 almost everywhere else, and is far lower than for temperature projections. In particular, the tropics have the highest S/N for temperature, but the lowest for precipitation. We also estimate a otential S/N by assuming that model uncertainty could be reduced to zero, and show that, for regional precipitation, the gains in S/N are fairly modest, especially for predictions of the next few decades. This finding suggests that adaptation decisions will need to be made in the context of high uncertainty concerning regional changes in precipitation. The potential to narrow uncertainty in regional temperature projections is far greater. These conclusions on S/N are for the current generation of models; the real signal may be larger or smaller than the CMIP3 multi-model mean. Also note that the S/N for extreme precipitation, which is more relevant for many climate impacts, may be larger than for the seasonal mean precipitation considered here.
|
| [58] |
Robust Hadley circulation changes and increasing global dryness due to CO2 warming from CMIP5 model projections [J].
Erratum for Proc Natl Acad Sci U S A. 2013 Jul 2;110(27):E2518-27. doi: 10.1073/pnas.1306832110. Epub 2013 Jun 17..
|
| [59] |
Anthropogenic forcing on the Hadley circulation in CMIP5 simulations [J].
Poleward expansion of the Hadley circulation has been an important topic in climate change studies in the past few years, and one of the critically important issues is how it is related to anthropogenic forcings. Using simulations from the coupled model intercomparison projection phase 5 (CMIP5), we study influences of anthropogenic forcings on the width and strength of the Hadley circulation. It is found that significant poleward expansion of the Hadley circulation can be reproduced in CMIP5 historical all-forcing simulations although the magnitude of trends is much weaker than observations. Simulations with individual forcings demonstrate that among three major types of anthropogenic forcings, increasing greenhouse gases (GHGs) and stratospheric ozone depletion all cause poleward expansion of the Hadley circulation, whereas anthropogenic aerosols do not have significant influences on the Hadley circulation. Increasing GHGs cause significant poleward expansion in both hemispheres, with the largest widening of the northern cell in boreal autumn. Stratospheric ozone depletion forces significant poleward expansion of the Hadley circulation for the southern cell in austral spring and summer and for the northern cell in boreal spring. In CMIP5 projection simulations for the twenty-first century, the magnitude of poleward expansion of the Hadley circulation increases with GHG forcing. On the other hand, ozone recovery competes with increasing GHGs in determining the width of the Hadley circulation, especially in austral summer. In both historical and projection simulations, the strength of the Hadley circulation shows significant weakening in winter in both hemispheres.
|
| [60] |
Observed poleward expansion of the Hadley circulation since 1979 [J]. |
| [61] |
Enhanced mid-latitude tropospheric warming in satellite measurements [J]. |
| [62] |
Migrations and dynamics of the intertropical convergence zone [J].
Rainfall on Earth is most intense in the intertropical convergence zone (ITCZ), a narrow belt of clouds centred on average around six degrees north of the Equator. The mean position of the ITCZ north of the Equator arises primarily because the Atlantic Ocean transports energy northward across the Equator, rendering the Northern Hemisphere warmer than the Southern Hemisphere. On seasonal and longer timescales, the ITCZ migrates, typically towards a warming hemisphere but with exceptions, such as during El Nio events. An emerging framework links the ITCZ to the atmospheric energy balance and may account for ITCZ variations on timescales from years to geological epochs.
|
| [63] |
Abrupt seasonal variation of the ITCZ and the Hadley circulation [J].
Using Global Precipitation Climatology Project (GPCP) daily data, we show that the seasonal migration of the global zonal-mean intertropical convergence zone (ITCZ) is not smooth, but jumps from the winter hemisphere to the summer hemisphere. The abrupt migration is within 10 days. Detailed analyses reveal that the phenomenon of the abrupt seasonal migration of the ITCZ mainly exists over particular tropical domains, such as Indian Ocean, western and central Pacific, and South America, which gives the rise of the jump of the global zonal-mean ITCZ. Because the ITCZ constitutes the ascending branch of the Hadley circulation, we also examine whether there exists such an abrupt seasonal change in the Hadley circulation. It is found that the intensity of the Hadley cells evolves smoothly with time. However, the horizontal scales of the Hadley cells demonstrate abrupt seasonal changes, corresponding to the abrupt seasonal migration of the global ITCZ. The winter cell extends rapidly across the equator, while the summer cell rapidly narrows. This suggests that the solsticial cell is the dominant component of the Hadley circulation, and that the equinoctial symmetric pattern is ephemeral.
|
| [64] |
Spatial patterns of precipitation change in CMIP5: Why the rich do not get richer in the tropics [J]. |
| [65] |
Weakening and strengthening structures in the Hadley circulation change under global warming and implications for cloud response and climate sensitivity [J].
AbstractIt has long been recognized that differences in climate model-simulated cloud feedbacks are a primary source of uncertainties for the model-predicted surface temperature change induced by increasing greenhouse gases such as CO2. Large-scale circulation broadly determines when and where clouds form and how they evolve. However, the linkage between large-scale circulation change and cloud radiative effect (CRE) change under global warming has not been thoroughly studied. By analyzing 15 climate models, we show that the change of the Hadley Circulation exhibits meridionally varying weakening and strengthening structures, physically consistent with the cloud changes in distinct cloud regimes. The regions that experience a weakening (strengthening) of the zonal-mean circulation account for 54% (46%) of the multimodel-mean top-of-atmosphere (TOA) CRE change integrated over 45°S–40°N. The simulated Hadley Circulation structure changes per degree of surface warming differ greatly between the models, and the intermodel spread in the Hadley Circulation change is well correlated with the intermodel spread in the TOA CRE change. This correlation underscores the close interactions between large-scale circulation and clouds and suggests that the uncertainties of cloud feedbacks and climate sensitivity reside in the intimate coupling between large-scale circulation and clouds. New model performance metrics proposed in this work, which emphasize how models reproduce satellite-observed spatial variations of zonal-mean cloud fraction and relative humidity associated with the Hadley Circulation, indicate that the models closer to the satellite observations tend to have equilibrium climate sensitivity higher than the multimodel mean.
|
| [66] |
The double-ITCZ problem in IPCC AR4 coupled GCMs: Ocean-atmosphere feedback analysis [J]. |
| [67] |
The tropospheric land-sea warming contrast as the driver of tropical sea level pressure changes [J].
This article addresses the causes of the large-scale tropical sea level pressure (SLP) changes during climate change. The analysis presented here is based on model simulations, observed trends, and the seasonal cycle. In all three cases the regional changes of tropospheric temperature (T-tropos) and SLP are strongly related to each other [considerably more strongly than (sea) surface temperature and SLP]. This relationship basically follows the Bjerknes circulation theorem, with relatively low regional SLP where there is relatively high T-tropos and vice versa. A simple physical model suggests a tropical SLP response to horizontally inhomogeneous warming in the tropical T-tropos, with a sensitivity coefficient of about-1.7 hPa K-1. This relationship explains a large fraction of observed and predicted changes in the tropical SLP.It is shown that in climate change model simulations the tropospheric land-sea warming contrast is the most significant structure in the regional T-tropos changes relative to the tropical mean changes. Since the land-sea warming contrast exists in the absence of any atmospheric circulation changes, it can be argued that the large-scale response of tropical SLP changes is to first order a response to the tropical land-sea warming contrast. Furthermore, as the land-sea warming contrast is mostly moisture dependent, the models predict a stronger warming and decreasing SLP in the drier regions from South America to Africa and a weaker warming and increasing SLP over the wetter Indo-Pacific warm pool region. This suggests an increase in the potential for deep convection conditions over the Atlantic sector and a decrease over the Indo-Pacific warm pool region in the future.
|
| [68] |
Towards predictive understanding of regional climate change [J].
This Review considers recent advances in our understanding of regional climate change, critically discusses outstanding issues, and recommends targets for future research.
|
| [69] |
|
| [70] |
A verification framework for interannual-to-decadal predictions experiments [J].
Decadal predictions have a high profile in the climate science community and beyond, yet very little is known about their skill. Nor is there any agreed protocol for estimating their skill. This paper proposes a sound and coordinated framework for verification of decadal hindcast experiments. The framework is illustrated for decadal hindcasts tailored to meet the requirements and specifications of CMIP5 (Coupled Model Intercomparison Project phase 5). The chosen metrics address key questions about the information content in initialized decadal hindcasts. These questions are: (1) Do the initial conditions in the hindcasts lead to more accurate predictions of the climate, compared to un-initialized climate change projections? and (2) Is the prediction model ensemble spread an appropriate representation of forecast uncertainty on average? The first question is addressed through deterministic metrics that compare the initialized and uninitialized hindcasts. The second question is addressed through a probabilistic metric applied to the initialized hindcasts and comparing different ways to ascribe forecast uncertainty. Verification is advocated at smoothed regional scales that can illuminate broad areas of predictability, as well as at the grid scale, since many users of the decadal prediction experiments who feed the climate data into applications or decision models will use the data at grid scale, or downscale it to even higher resolution. An overall statement on skill of CMIP5 decadal hindcasts is not the aim of this paper. The results presented are only illustrative of the framework, which would enable such studies. However, broad conclusions that are beginning to emerge from the CMIP5 results include (1) Most predictability at the interannual-to-decadal scale, relative to climatological averages, comes from external forcing, particularly for temperature; (2) though moderate, additional skill is added by the initial conditions over what is imparted by external forcing alone; however, the impact of initialization may result in overall worse predictions in some regions than provided by uninitialized climate change projections; (3) limited hindcast records and the dearth of climate-quality observational data impede our ability to quantify expected skill as well as model biases; and (4) as is common to seasonal-to-interannual model predictions, the spread of the ensemble members is not necessarily a good representation of forecast uncertainty. The authors recommend that this framework be adopted to serve as a starting point to compare prediction quality across prediction systems. The framework can provide a baseline against which future improvements can be quantified. The framework also provides guidance on the use of these model predictions, which differ in fundamental ways from the climate change projections that much of the community has become familiar with, including adjustment of mean and conditional biases, and consideration of how to best approach forecast uncertainty.
|
| [71] |
Twentieth century tropical sea surface temperature trends revisited [J].
This study compares the global distribution of 20th century SST and marine air temperature trends from a wide variety of data sets including un-interpolated archives as well as globally-complete reconstructions. Apart from the eastern equatorial Pacific, all datasets show consistency in their statistically significant trends, with warming everywhere except the far northwestern Atlantic; the largest warming trends are found in the middle latitudes of both hemispheres. Two of the SST reconstructions exhibit statistically significant cooling trends over the eastern equatorial Pacific, in disagreement with the un-interpolated SST and marine air temperature datasets which show statistically significant warming in this region. Twentieth century trends in tropical marine cloudiness, precipitation and SLP from independent data sets provide physically consistent evidence for a reduction in the strength of the atmospheric Walker Circulation accompanied by an eastward shift of deep convection from the western to the central equatorial Pacific.
|
| [72] |
Implications of CMIP3 model biases and uncertainties for climate projections in the western tropical Pacific [J].
Regional climate projections in the Pacific region are potentially sensitive to a range of existing model biases. This study examines the implications of coupled model biases on regional climate projections in the tropical western Pacific. Model biases appear in the simulation of the El Nino Southern Oscillation, the location and movement of the South Pacific Convergence Zone, rainfall patterns, and the mean state of the ocean-atmosphere system including the cold tongue bias and erroneous location of the edge of the Western Pacific warm pool. These biases are examined in the CMIP3 20th century climate models and used to provide some context to the uncertainty in interpretations of regional-scale climate projections for the 21st century. To demonstrate, we provide examples for two island nations that are located in different climate zones and so are affected by different biases: Nauru and Palau. We discuss some of the common approaches to analyze climate projections and whether they are effective in reducing the effect of model biases. These approaches include model selection, calculating multi model means, downscaling and bias correcting.
|
| [73] |
Sensitivity of tropical carbon to climate change constrained by carbon dioxide variability [J]. |
| [74] |
On the robustness of emergent constraints used in multimodel climate change projections of Arctic warming [J].
Statistical relationships between future and historical model runs in multimodel ensembles (MMEs) are increasingly exploited to make more constrained projections of climate change. However, such emergent constraints may be spurious and can arise because of shared (common) errors in a particular MME or because of overly influential models. This study assesses the robustness of emergent constraints used for Arctic warming by comparison of such constraints in ensembles generated by the two most recent Coupled Model Intercomparison Project (CMIP) experiments: CMIP3 and CMIP5. An ensemble regression approach is used to estimate emergent constraints in Arctic wintertime surface air temperature change over the twenty-first century under the Special Report on Emission Scenarios (SRES) A1B scenario in CMIP3 and the Representative Concentration Pathway (RCP) 4.5 scenario in CMIP5. To take account of different scenarios, this study focuses on polar amplification by using temperature responses at each grid point that are scaled by the global mean temperature response for each climate model. In most locations, the estimated emergent constraints are reassuringly similar in CMIP3 and CMIP5 and differences could have easily arisen from sampling variation. However, there is some indication that the emergent constraint and polar amplification is substantially larger in CMIP5 over the Sea of Okhotsk and the Bering Sea. Residual diagnostics identify one climate model in CMIP5 that has a notable influence on estimated emergent constraints over the Bering Sea and one in CMIP3 that that has a notable influence more widely along the sea ice edge and into midlatitudes over the western North Atlantic.
|
| [75] |
Quantifying future climate change [J]. |
| [76] |
A multimodel ensemble pattern regression method to correct the tropical Pacific SST change patterns under global warming [J].
ABSTRACT This study develops a new observational constraint method, called multimodel ensemble pattern regression (EPR), to correct the projections of regional climate change by the conventional unweighted multimodel mean (MMM). The EPR method first extracts leading modes of historical bias using intermodel EOF analysis, then builds up the linear correlated modes between historical bias and change bias using multivariant linear regression, and finally estimates the common change bias induced by common historical bias. Along with correcting common change bias, the EPR method implicitly removes the intermodel uncertainty in the change projection deriving from the intermodel diversity in background simulation. The EPR method is applied to correct the patterns of tropical Pacific SST changes using the historical and representative concentration pathway 8.5 (RCP8.5) runs in 30 models from phase 5 of CMIP (CMIP5) and observed SSTs. The common bias patterns of the tropical Pacific SSTs in historical runs, including the excessive cold tongue, the southeastern warm bias, and the narrower warm pool, are estimated to induce La Ni09a–like change biases. After the estimated common change biases are removed, the corrected SST changes display a pronounced El Ni09o–like pattern and have much greater zonal gradients. The bias correction decreases by around half of the intermodel uncertainties in the MMM SST projections. The patterns of corrected tropical precipitation and circulation change are dominated by the enhanced SST change patterns, displaying a pro- nounced warmer-get-wetter pattern and a decreased Walker circulation with decreased uncertainties.
|
| [77] |
Projecting regional change [J]. |
| [78] |
Challenges and opportunities for improved understanding of regional climate dynamics [J].
Dynamical processes in the atmosphere and ocean are central to determining the large-scale drivers of regional climate change, yet their predictive understanding is poor. Here, we identify three frontline challenges in climate dynamics where significant progress can be made to inform adaptation: response of storms, blocks and jet streams to external forcing; basin-to-basin and tropical-extratropical teleconnections; and the development of non-linear predictive theory. We highlight opportunities and techniques for making immediate progress in these areas, which critically involve the development of high-resolution coupled model simulations, partial coupling or pacemaker experiments, as well as the development and use of dynamical metrics and exploitation of hierarchies of models.
|
| [79] |
Review of development and application of high resolution global climate system model [J].全球高分辨率气候系统模式研究进展 [J].
气候模式是定量研究气候演变规律、预测或预估未来气候变化的重要工具。提高气候模式空间分辨率并改进相应的物理参数化过程,是改善模式性能的重要途径之一, 对于认识气候变化规律、提高气候预测能力具有重要作用。在阐述发展全球高分辨率气候系统模式重要性的基础上,对当今国内外高分辨率气候系统模式的研究进展进行总结,介绍全球高分辨率气候系统模式研发和评估的现状及其存在的问题,并着重讨论了制约当前高分辨率气候系统模式发展的关键科学问题和技术瓶颈,其中包括高分辨率海洋和大气模式动力框架的研制和大规模高性能并行计算、次网格物理参数化过程的改进,以及中尺度海气相互作用等。同时,还介绍了国际耦合模式比较计划第六阶段中的高分辨率模式比较子计划的科学目标及其试验设计方案。最后对未来我国全球高分辨率气候系统模式的发展和评估进行了展望。
|
| [80] |
Cloud-radiation feedback as a leading source of uncertainty in the tropical Pacific SST warming pattern in CMIP5 models [J].
Abstract The role of the intermodel spread of cloud-radiation feedback in the uncertainty in the tropical Pacific SST warming (TPSW) pattern under global warming is investigated based on the historical and RCP8.5 runs from 32 models participating in CMIP5. The large intermodel discrepancies in cloud-radiation feedback contribute 24% of the intermodel uncertainty in the TPSW pattern over the central Pacific. The mechanism by which the cloud-radiation feedback influences the TPSW pattern is revealed based on an analysis of the surface heat budget. A relatively weak negative cloud-radiation feedback over the central Pacific cannot suppress the surface warming as greatly as in the multimodel ensemble and thus induces a warm SST deviation over the central Pacific, producing a low-level convergence that suppresses (enhances) the evaporative cooling and zonal cold advection in the western (eastern) Pacific. With these processes, the original positive SST deviation over the central Pacific will move westward to the western and central Pacific, with a negative SST deviation in the eastern Pacific. Compared with the observed cloud-radiation feedback from six sets of reanalysis and satellite-observed data, the negative cloud-radiation feedback in the models is underestimated in general. It implies that the TPSW pattern should be closer to an El Nino-like pattern based on the concept of observational constraint. However, the observed cloud-radiation feedback from the various datasets also demonstrates large discrepancies in magnitude. Therefore, the authors suggest that more effort should be made to improve the precision of shortwave radiation observations and the description of cloud-radiation feedback in models for a more reliable projection of the TPSW pattern in future.
|
| [81] |
Effects of climatological model biases on the projection of tropical climate change [J].
Climate models suffer from long-standing biases including the double intertropical convergence zone (ITCZ) problem and the excessive westward extension of the equatorial Pacific cold tongue. An atmospheric general circulation model is used to investigate how model biases in the mean state affect the projection of tropical climate change. The model is forced with a pattern of sea surface temperature (SST) increase derived from a coupled simulation of global warming but uses an SST climatology derived from either observations or a coupled historical simulation. The comparison of the experiments reveals that the climatological biases have important impacts on projected changes in the tropics. Specifically, during February-April when the climatological ITCZ displaces spuriously into the Southern Hemisphere, the model overestimates (underestimates) the projected rainfall increase in the warmer climate south (north) of the equator over the eastern Pacific. Furthermore, the global warming-induced Walker circulation slowdown is biased weak in the projection using coupled model climatology, suggesting that the projection of the reduced equatorial Pacific trades may also be under-estimated. This is related to the bias that the climatological Walker circulation is too weak in the model, which is in turn due to too weak mean SST gradient in the zonal direction. Our results highlight the importance of improving the climatological simulation for more reliable projections of regional climate change.
|

/
| 〈 |
|
〉 |

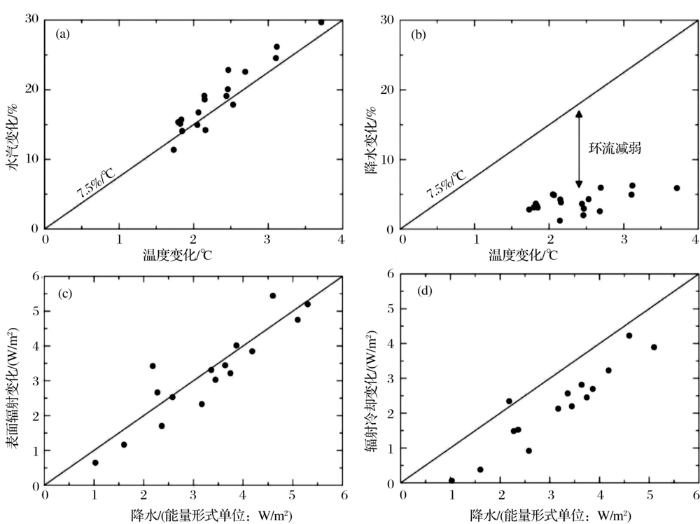
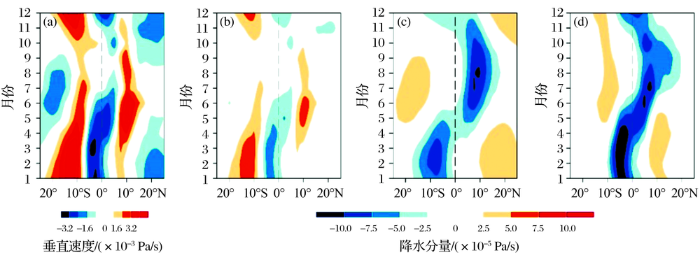
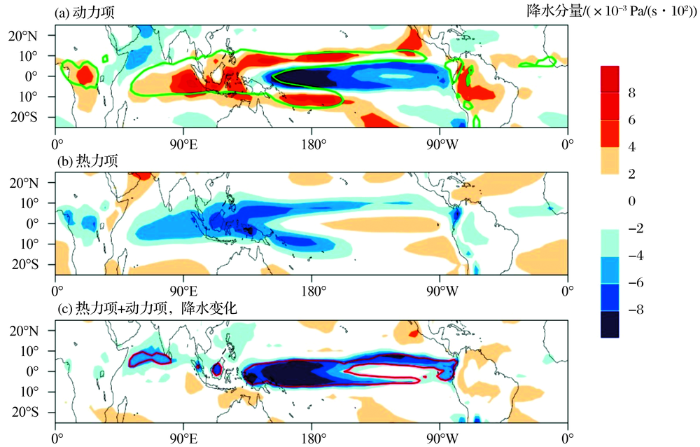
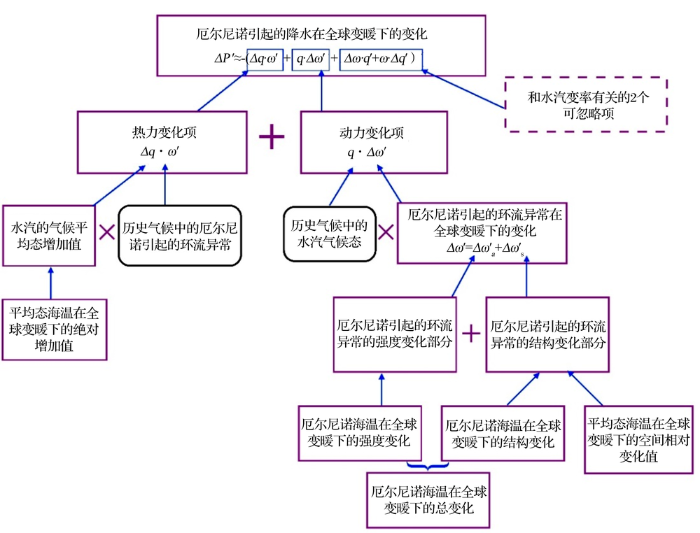
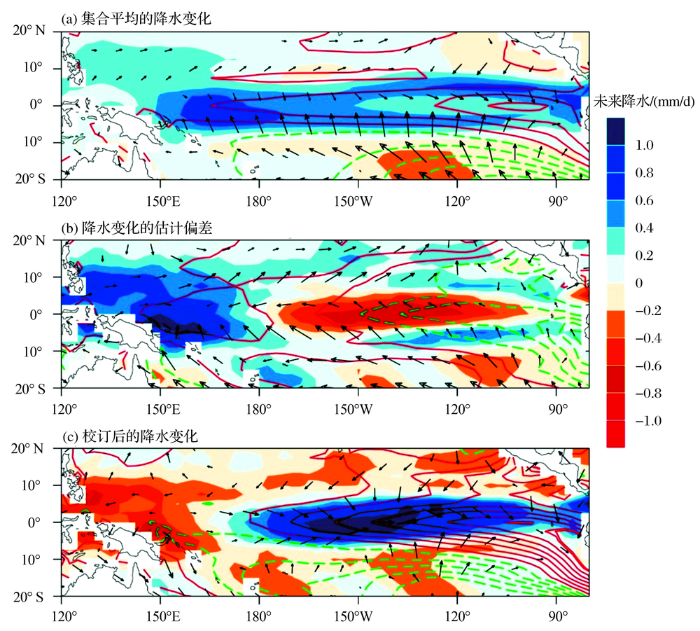