
王建 , 车涛
, 车涛
Wang Jian, Che Tao
中图分类号: P426.635
文献标识码: A
文章编号: 1001-8166(2018)01-0012-15
收稿日期: 2017-10-25
修回日期: 2017-12-11
网络出版日期: 2018-01-10
版权声明: 2018 地球科学进展 编辑部
基金资助:
作者简介:
First author:Wang Jian(1963-),male,Xiuning County,Anhui Province,Professor. Research areas include remote sensing of snow and modeling of snowmelt runoff.E-mail:wjian@lzb.ac.cn
作者简介:王建(1963-),男,安徽休宁人,研究员,主要从事积雪遥感和融雪径流模拟模型研究.E-mail:wjian@lzb.ac.cn
展开
摘要
介绍了“中国积雪特性及分布调查”的背景、科学目标、调查内容及方案。调查的总体目标是建立中国全面而系统的积雪特性数据库,服务于气候变化、水资源调查和积雪灾害的数据需求。调查将从历史资料整编、典型积雪区积雪特性地面调查以及积雪遥感调查等方面展开。历史资料的整编包括收集气象站以及各单位已开展的积雪特性观测资料,并按照一定的规范进行整编;典型积雪区地面调查主要是在东北地区、新疆地区和青藏高原开展不同季节的积雪特性调查,以点、线、面3种方式开展,观测内容包括雪深、雪密度、雪水当量、积雪形态、表层硬度、液态水含量、雪粒径、雪层温度、雪土界面温度、介电常数以及积雪的若干化学特性;遥感积雪调查将利用地面调查的积雪特性信息改进已有的积雪参数反演算法,建立中国长序列的积雪面积、反照率以及雪水当量数据集。最终,利用地面和遥感调查所获取的积雪特性及分布数据集对中国进行积雪类型划分,并生产系列积雪特性及专题分布图。
关键词:
Abstract
The background, scientific objective, investigation contents and scheme of project “Investigation on snow characteristics and their distribution in China” was introduced in this paper. The general objective of the investigation is to build comprehensive and systematic database of snow characteristics in China, at the service of providing data for the climate change, water resource and snow disaster studies. The investigation will be performed on the three fields including the compilation of historical data, in situ measurement of snow characteristics in the typical regions, and investigation of snow characteristics using remote sensing methods. For the compilation of historical data, the historical snow data from the meteorological stations and research institutes will be firstly collected, and then they will be compiled based on a standard rule. In situ observation will be performed at point, line and area-scale on the typical regions which include Northeast region, Xinjiang Degion, and Qinghai-Tibet Plateau. The observation content will contain snow depth, snow density, snow water equivalent, snow particle shape, hardness of snowpack surface, liquid water content, grain size, snow temperature, snow/soil temperature, dielectric constant, and some chemical parameters. These snow characteristics are the priority information used for the modification of retrieval algorithm on snow parameters. Remote sensing methods will be used to build long-time series of snow cover, snow albedo and snow water equivalent datasets based on these modified algorithms. Finally, the snow characteristics from both in situ and remote sensing investigation will be used to classify snow types in China, and produce distribution maps of snow characteristic and other thematic maps.
Keywords:
积雪是全球气候变化的指示器,对气候系统具有显著的正反馈作用,是全球气候变化研究的关键变量[1,2];同时,积雪是重要的淡水资源,是我国主要河流的重要补给[3,4];但是,过量或非适时的积雪也会引发积雪灾害,导致大量的生命财产损失[5,6]。目前,我国尚缺乏科学规范的积雪地面调查和可靠的积雪遥感产品,难以满足科研和行业应用的需求。因此,在国家科技基础资源调查专项的支持下,“中国积雪特性及分布调查”项目联合多家科研机构,开展中国积雪特性及分布调查,建立统一、规范的积雪特性数据集和时空动态变化数据库,为冰冻圈与气候变化研究、水资源评估、积雪灾害监测和预警提供基础数据。
国际上积雪监测始于19世纪俄罗斯、加拿大、美国和欧洲利用测雪尺记录积雪厚度,目前已经积累了100多年的历史数据,观测点密度不断增大,观测参数也从开始的雪深扩展到雪水当量、密度、硬度、类型等其他物理参数[7,8]。中国积雪大范围观测研究始于20世纪50年代的气象观测系统。中国气象局在全国765个气象基准站实施了雪深观测[9,10],部分站点也观测雪压(仅省级气象主管机构指定气象站开展测量),此后近2 400个气象站陆续启动雪深雪压观测业务,至1979年形成统一的地面气象观测规范[11]。此外,中国科学院建立多个野外台站,包括天山冰川研究站、玉龙雪山研究站、黑河遥感站、净月潭遥感站等,也开始了积雪特性的相关观测。这些持续观测的站点数据为长时间的气候变化和水文、水资源研究提供了宝贵的数据。
仅仅依靠人工观测和站点自动化定点观测获得的有限的积雪参数不能满足水文、气候、生态的定量研究。而且,站点观测范围有限,不能全面反映我国积雪的整体空间分布特征;许多分布式积雪表面能量平衡模型还需要雪层温度剖面、雪粒径等自动站无法获取的积雪参数[12~15]。因此,国内外针对相关科研领域的积雪参数需求,开展了大量的积雪综合观测试验。其中规模最大的为2002年美国国家航空航天局(National Aeronautics and Space Administration ,NASA)开展的寒区陆面过程试验(Cold Land Processes Experiment,CLPX)。该试验根据不同的尺度观测了雪深、雪密度、雪粒径及形状、雪层结构、雪表面粗糙度以及雪下土壤的一些属性,这是首次大规模的积雪遥感同步观测试验[16,17]。我国分别于2007—2009年、2012—2015年开展了黑河综合遥感联合试验和黑河生态水文遥感试验,这是我国首次开展的地面—航空积雪参数遥感同步观测试验,获取了黑河上游的积雪数据集,对理解积雪对流域生态和水文过程的研究提供了强有力的数据支持[18~20]。
卫星遥感技术可以提供大范围的积雪信息面上监测。自1966年以来,美国海洋和大气管理局(National Oceanic and Atmospheric Administration, NOAA)持续提供基于NOAA/AVHRR(Advanced Very High Resolution Radiometer)的北半球每周积雪覆盖产品,空间分辨率较低,约为190 km[21]。1995年至今,美国国家雪冰数据中心(National Snow and Ice Data Center, NSIDC)向全球发布每日近实时雪冰范围产品,该产品主要采用被动微波数据SSM/I(Special Sensor Microwave Imager)生成,空间分辨率为25 km。2000年以来,利用SNOWMAP等算法生成的MODIS(Moderate-resolution Imaging Spectroradiometer)积雪产品因其具有较高的时空分辨率得到广泛应用。近年来,我国的卫星数据在积雪面积制图中也得到广泛应用,如中国气象局制作了1996—2010年中国FY-1/MVISR(多通道可见红外扫描辐射仪)与NOAA/AVHRR积雪面积旬产品,空间分辨率为5 km;2008年至今,采用FY-3 MERSI(中分辨率光谱成像仪)和VIRR(可见光红外扫描辐射计)积雪产品融合生成全球MULSS日/旬/月积雪面积业务化产品,空间分辨率为1 km。
雪水当量遥感产品最早可追溯至1978年,美国国家冰雪数据中心利用SMMR(Scanning Multi-channel Microwave Radiometer)微波亮温数据生产了全球0.5°空间分辨率的逐月雪深产品。1987年8月起,性能更好的SSM/I和之后的SSMI/S(Special Sensor Microwave Imager/Sounder)替代了SMMR,用于生产半球和全球尺度的雪深产品。Aqua卫星上搭载的AMSR-E(Advanced Microwave Scanning Radiometer-EOS)微波辐射计于2002年开始使用,2011年停止运行,并由GCOM卫星搭载的AMSR-2传感器代替,NSIDC和日本宇宙航空研究开发机构(Janpan Aerospace Exploration Agency, JAXA)分别利用AMSR-E和AMSR-2的微波亮温数据生产制作了全球范围不同时间分辨率的雪水当量产品,空间分辨率(10~25 km)较早期SMMR雪深产品有所提高。欧洲空间局(Europe Space Agency, ESA)利用SMMR,SSM/I和SSMI/S生产了全球1979年以来25 km分率的雪水当量产品Globsnow。我国雪水当量/雪深产品主要包括利用FY-3生产的逐日雪水当量产品[22],以及利用SMMR,SSM/I和SSMI/S生产的长序列逐日雪深产品[23,24]。
美国2000年开始发布基于MODIS数据的全球地表反照率产品MCD43,是首个能够准实时提供高时空分辨率地表反照率的业务化产品[25,26],但是在高原地区的精度验证仍然仅限于有限的地面观测资料的比较[27],而且16天合成的产品并不适用于监测积雪反照率的快速变化[28]。我国研发的GLASS地表反照率产品是目前国际上时间序列最长的全球地表反照率产品[29],其在高原积雪地区的精度仍有待进一步验证。针对积雪,美国2002年发展了首个全球逐日积雪反照率算法[30],并将其作为MODIS积雪产品的一个数据集(Snow Albedo Daily,SAD)。SAD产品有效地弥补了地表反照率数据时间分辨率低的劣势,更准确地反映季节性积雪的变化特征,但对于森林积雪简单假设为朗伯体[31],可能导致在森林地区精度偏低。
随着积雪观测手段的不断进步,对积雪特性及其变化在水文过程、数值模拟、农业生产、气候变化和防灾减灾等领域的作用和影响的理解进一步提升,积雪特性基础数据的缺乏也越发凸显。IPCC评估了过去50年来北半球积雪范围变化[32],但是由于缺乏可靠的地面和遥感观测以及模型模拟雪深、雪水当量和反照率数据产品,难以对这些参数进行系统评估。其原因在于:①现有地面观测积雪数据空间分布不均、代表性不强、观测参数有限,而且不同国家和地区积雪观测规范不一致,难以形成全球标准的、系统的地面积雪观测数据;②遥感反演算法由于缺乏可靠的积雪特性信息作为输入,遥感产品精度有待改进,例如,因为缺乏准确的积雪粒径和密度时空变化信息,导致雪深和雪水当量遥感反演产品误差较大[23,33],而雪粒径和雪层杂质(如黑碳)等时空分布对归一化积雪指数的影响,导致积雪面积和反照率遥感产品不确定性增加[34];③全球气候模式中积雪过程模拟精度不高,除了积雪的反照率反馈机制和辐射强迫估算具有很大不确定性以外,积雪密实化和融雪等关键过程中的参数化方案还需要地面和遥感观测数据标定和改进[35]。
目前,我国许多地区积雪对区域水资源的贡献仍不清楚,主要原因之一是长序列积雪特性分布数据的缺失和不统一,具体表现在2个方面:①在积雪储量的评估上,缺乏时空连续的雪水当量数据,其精度也有待提高;②在融雪水资源的评估上,用于模拟融雪径流的水文模型依赖于积雪属性的地面调查,如积雪面积、雪水当量、密度、粒径及反照率等参数。这些变量实测数据的缺乏,使得融雪水资源的评估在许多地区都存在极大的不确定性。
同时,积雪灾害具有区域性、时间性特点,无论是认识雪灾发生的机理、掌握雪灾发展动向,还是估测雪灾影响程度都依赖于准确的积雪特性数据。以牧区雪灾为例,积雪范围和深度、持续时间、积雪形态参数和温度是牧区雪灾预警和损失评估的重要指标,及时获取这些积雪调查数据可对一场降雪能否成灾及时做出判别,客观准确地反映灾情等级,为地方政府和民政部门的抗灾救灾工作提供科学依据。然而,目前针对积雪灾害的基础参数调查仍然无法满足灾害监测和评估的数据需求。
综上所述,我国尚未开展全面、系统的积雪特性地面调查工作,积雪观测参数和流程缺乏统一标准,大量历史性数据亟需整理;在积雪遥感调查方面,由于在复杂地形和森林地区的积雪产品误差较大,无法满足相关科学研究与行业应用的需求;在积雪分类方面,国际上流行的积雪分类体系在中国地区偏差很大,中国典型积雪区和主要流域缺乏完整的专题图件。“中国积雪特性及分布调查”将针对这些问题开展系统调查,提供全面的中国积雪特性数据集,服务于我国相关科学研究和行业应用。
“中国积雪特性及分布调查”的总体目标是:制定中国积雪野外测量规范,开展积雪特性地面与遥感调查,获取1980年以来中国区域积雪空间分布及其变化数据集,编制新的中国积雪类型图和系列专题图集,建立积雪特性综合数据库并实现共享,满足气候变化研究、水资源评估和防灾减灾的基础数据需求。具体目标包括:
(1) 完成中国典型积雪区标准积雪剖面特征及测量规范建设。规范不同类型积雪的测量方法。
(2) 建立中国主要典型积雪区不同积雪时间积雪特性综合数据集,包含不同积雪期的积雪分层、密度、雪深、雪水当量乃至积雪化学成分等信息。包括2个数据库:①积雪地面观测历史资料整编数据集,包括各类积雪地面观测站点历史资料以及不同科研团队在我国典型积雪区开展的积雪观测数据;②主要典型积雪区积雪特性综合数据库,包含不同时期积雪雪深、雪水当量、雪密度、雪粒径、含水量、雪层温度、积雪形态、雪分层以及杂质(黑碳)、阴阳离子和pH值等理化参数。
(3) 建立1980年以来我国积雪逐日的时空变化序列数据库。形成一套完整的我国积雪空间分布及变化的数据,具体内容包括:①中国1980—2020年空间分辨率为25 km的逐日雪水当量产品,包括雪水当量数据、产品手册、精度评估报告;②中国1980—2020年空间分辨率为5 km的逐日积雪面积产品,2000—2020年空间分辨率为500 m的逐日积雪面积产品,包括积雪面积数据、产品手册、精度评估报告;③中国2000—2020年空间分辨率为1 km的逐日积雪反照率产品,包括积雪反照率数据、产品手册、精度评估报告。
(4) 基于地面调查的积雪特性库和遥感反演的时间序列积雪数据集,制作积雪类型图。包括考虑气候带因素的Sturm-Holmgren体系分类图以及积雪稳定性分类图; 制作中国积雪专题图,包括积雪持续日数图、积雪初日和终日图、雪水当量分布图以及积雪密度分布图。
(5) 基于地面调查的积雪特性库和遥感反演的时间序列积雪数据集,制作中国典型积雪区系列应用专题图。包括东北典型农田区积雪水热效应系列专题图、新疆天山中段融雪性洪水灾害系列专题图、青藏高原牧区雪灾系列专题图和西北地区典型流域积雪水资源系列专题图。
(6) 建立中国积雪特性及分布调查数据库。包括地面调查数据、遥感调查数据和典型积雪区积雪特征专题信息,具备入库、出库、查询、分析、统计、制图等主要功能。
“中国积雪特性及分布调查”最终目标是获取积雪特性数据集,数据集由3个部分组成:历史资料整编数据集、典型积雪区积雪地面调查数据集以及遥感反演的积雪数据集。历史资料和地面调查数据为积雪参数遥感反演提供基础输入数据,遥感反演的积雪分布为地面调查方案的设计提供参考信息,两者共同服务于积雪类型的划分和积雪专题图的制作。
3.1.1 历史资料整编
通过对地面积雪观测资料的收集、整理和评估,建立地面积雪观测历史资料整编数据集。历史资料包括气象站点资料以及各单位野外考察资料。以中国科学院西北生态环境资源研究院、中国科学院新疆生态与地理研究所、中国科学院东北地理与农业生态研究所、西藏高原大气环境科学研究所、青海省气象科学研究所和中国气象局乌鲁木齐沙漠气象研究所等参与单位的固定站点及野外考察积雪观测资料为主要数据源,兼顾其他参与单位提供的观测资料,整编形成历史资料数据集。
3.1.2 积雪特性地面调查
在中国典型积雪区——东北地区、新疆地区以及青藏高原地区,通过点、线、面3种方式开展积雪野外调查,获取积雪特性地面调查数据。“点”是指利用国家气象站和研究单位合作建立的积雪观测站,观测固定点的积雪参数,获取积雪特性数据集;“线”是指在我国主要积雪区选择有代表性的测雪线路,通过沿途观测积雪剖面,获取主要积雪区的积雪特性数据集;“面”是指在我国典型积雪区选择有代表性的积雪观测区域,在观测区内不同尺度上设计调查样方,获取准确描述积雪时空变化的积雪参数数据集。
3.1.3 积雪特性遥感调查
利用可评估积雪面积、雪水当量和反照率产品的地面实测数据,针对不同传感器、时间段、分辨率的中国积雪遥感产品,通过空间误差分布、反演有效性对比等方法进行各类产品的系统评估。以典型积雪区积雪特性地面调查数据为基础,考虑积雪的区域变化、分布差异以及地形影响,改进现有遥感反演算法,生产长序列中国积雪面积、雪水当量和积雪反照率产品。结合满足要求的地面观测台站数据、地形数据、土地利用数据以及其他卫星遥感产品数据,开展新产品的精度及有效性验证,建立多源数据综合的积雪遥感产品数据集。
3.1.4 积雪分类及专题图制作
在地面调查与遥感调查数据基础上开展中国积雪类型划分,划分标准为Sturm-Holmgren分类体系和稳定性方法,其中特别注重不同气候带积雪类型的划分标准。在已有的调查数据基础上,制作一系列典型积雪区的积雪专题图,完成积雪地面和遥感调查数据以及专题图的收集与入库。
地面调查包括点、线、面观测,点观测的参数涉及较广,包括积雪的物理参数和化学参数,观测方法包括人工观测和自动化观测(表1);线观测以剖面观测为主,主要是积雪物理参数观测,观测方法为人工观测(表2);面观测的参数较少,主要观测雪深。遥感调查的积雪参数包括积雪面积、雪水当量以及反照率,积雪面积和反照率均采用可见光遥感反演,雪水当量采用微波遥感反演。
表1 积雪“点”观测内容及仪器
Table 1 Snow parameters observed at point scale and equipments
| 剖面测量内容 | 仪器 |
|---|---|
| 雪深 | SR50A超声波 |
| 雪水当量 | GMON3,人工 |
| 雪反照率 | 四分量表 |
| 表层温度 | 红外温度计 |
| 雪液态水含量、介电常数、积雪密度 | 雪特性分析仪(SPA) |
| 风速,风向,大气压空气温度、相对 湿度 | 风温湿压传感器 |
| 积雪形态 | 形状卡片 |
| 积雪硬度 | 硬度计 |
| 积雪粒径(分层) | 手持拍照显微镜、ICECUBE |
| 雪层温度(分层) | 温度计 |
| 雪土界面温度 | 温度计 |
| 雪压 | 雪压计 |
| 黑碳 | 采集雪样室内分析 |
| 阴阳离子 | 采集雪样室内分析 |
| pH值 | 采集雪样室内分析 |
表2 积雪“线”观测内容及仪器
Table 2 Snow parameters observed at line scale and equipments
| 剖面测量内容 | 仪器 |
|---|---|
| 雪深(分层) | 刻度尺 |
| 雪密度(分层) | 雪特性分析仪(Snowfork),雪铲 |
| 雪水当量 | 雪压计 |
| 表层硬度 | 硬度计 |
| 雪液态水含量(分层) | 雪特性分析仪(Snowfork) |
| 雪粒径(分层) | 手持拍照显微镜、ICECUBE |
| 雪层温度(分层) | 温度计 |
| 雪土界面温度 | 温度计 |
| 雪介电常数(分层) | 雪特性分析仪(Snowfork) |
| 雪样采集(分层) | 采集袋或采集器 |
| 积雪形态 | 形状卡片 |
历史资料整编和典型区积雪特性观测都需要规范的积雪观测手册。根据中国气象行业标准《地面气象观测规范第9部分:雪深与雪压观测》(QX/T53-2007)、中国气象局发布的《积雪遥感监测技术导则》(QX/T96-2008)、《综合气象观测》以及联合国教科文组织国际水文学计划(United Nations Educational Scientific and Cultural Organization-International Hydrology Program,UNESCO-IHP)和国际冰冻圈科学协会(International Association of Cryospheric Sciences,IACS)联合编制的《季节性积雪国际分类》,综合考虑我国积雪时空分布状况,编制适用于我国积雪特性的调查观测规范。
涉及的积雪观测参数包括:雪深、雪水当量、雪密度、雪粒径、积雪形态、雪分层以及杂质(黑碳)、雪层温度、含水量、阴阳离子和pH值等理化参数。同时需记录环境参数,如地形、气温、天气状况等。规范需要对每一个参数进行统一的定义,并推荐各参数测量所需的仪器设备,以及利用该仪器设备测量时的操作步骤和注意事项,最后还需要提供观测记录的精度和仪器标定等信息。为便于数据在国内外共享和对比分析,还将推荐积雪剖面观测结果的记录表格和图示范本,并考虑野外现场观测记录的便利性,设计统一的符号表达形式。
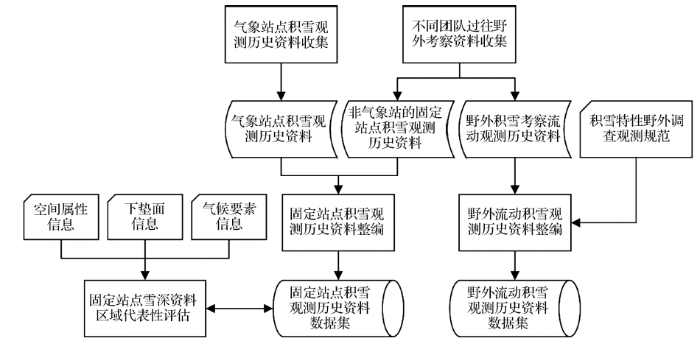
通过对地面积雪观测资料的收集、整理和评估,建立地面积雪观测历史资料整编数据集。具体工作流程见图1。首先对国家气象局数据以及各单位多年的野外观测数据进行收集,然后按固定观测和流动观测2种观测体系分别整编。①固定观测包括气象站点和非气象固定站点2类,参照气象站的观测资料格式和辅助说明形式,根据观测地点、观测时段及其连续性、观测时间、观测参数、观测仪器和方式、观测频率、天气和环境状况、贡献团队等信息,分别建立归类属性信息,通过查验,对缺失的属性信息尽力完善,对特殊信息进行备注,最后综合上述信息形成统一格式的元数据。②流动观测即野外考察观测,根据制定的积雪特性野外调查观测规范,整编各单位的历史观测资料,形成统一格式的元数据,对缺失项应做必要的标识或补充说明。
图1 地面积雪观测历史资料整编数据集构建流程
Fig.1 Flowchart of recompiling historical in situ snow data
新疆北部、青藏高原和内蒙古—东北地区是我国主要的稳定积雪分布区,也是本次调查最主要的3个积雪观测典型区,将在这3个典型区开展点、线、面观测。
4.3.1 “点”观测
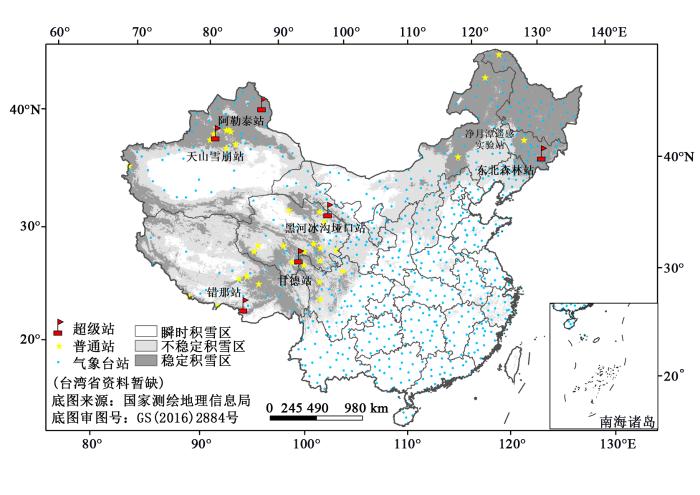
根据积雪调查的需要,将目前已有的积雪观测站分为超级站、普通站和气象台站3个级别(图2)。这些观测站分布在不同积雪区,特别是超级站和普通站,具有很好的区域代表性。①超级站6个,分别是阿勒泰站、天山雪崩站、黑河冰沟垭口站、甘德站、错那站和东北森林站,其中北疆积雪区2个、青藏高原积雪区3个、内蒙古—东北积雪区1个。超级站拥有自动积雪观测仪器,可以获取大部分积雪物理参数,同时也常年驻守人员,进行人工积雪采样以分析化学参数。②普通站35个,其中北疆积雪区10个、青藏高原积雪区21个、内蒙古—东北积雪区4个。普通站仅可自动测量积雪深度,部分有气象要素观测。③收集753个气象基准站和基本站获取的积雪和部分雪压历史资料,并将收集整编一般气象站的积雪观测资料,作为对超级站和普通站观测数据的补充。
4.3.2 “线”观测
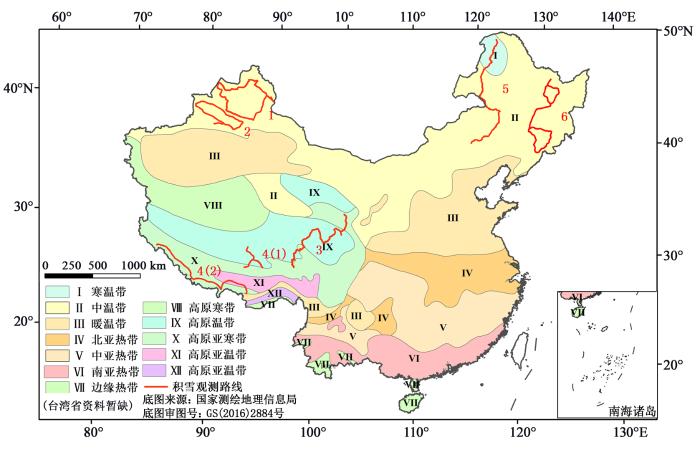
根据我国积雪分布特征,在3个主要积雪区设计6条线路进行剖面调查(图3)。主要包括测量雪深、雪密度、雪水当量、积雪形态、表层硬度、液态水含量、雪粒径、雪层温度、雪土界面温度、介电常数,并进行样本采集,用于化学成分的观测(黑碳、阴阳离子、pH值等)。①新疆积雪区设计2条环线——1号线和2号线,1号线围绕北疆古尔班通古特盆地开展;2号线围绕天山中段南北坡和伊犁河谷开展测量。②青藏高原积雪区设计2条路线——3号线和4号线,3号线是青藏高原中东部地区,黑河站—甘德—那曲;4号线是青藏高原南部积雪区,错那—拉萨—日喀则—普兰。③内蒙古—东北积雪区设计2条路线——5号线和6号线,5号线为锡林郭勒—大兴安岭—漠河;6号线包含2个环线,一个是环长白山线路,另一个是环小兴安岭线路。选择的线路均覆盖了典型积雪区和重要气候带,具有较好的代表性。在每一条线路采集积雪剖面数据不少于20个,并记录每个剖面观测点的坐标。观测周期为1个积雪期观测3次,在北方稳定积雪区分为积雪积累期、积雪稳定期、积雪消融期,在青藏高原不稳定积雪区分为秋季、冬季和春季3个观测期,每条线路至少获得6组时间序列数据集。
图2 积雪观测超级站、普通站以及气象台站分布图
Fig.2 Distribution of super stations, common stations and meteorological stations
4.3.3 “面”观测(样方观测)
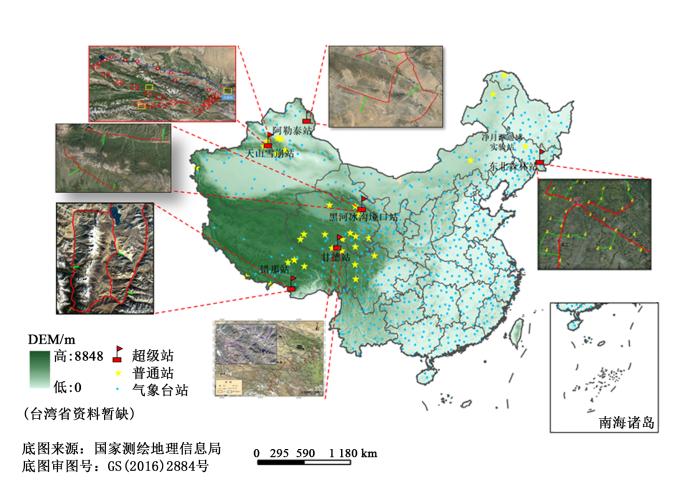
在天山雪崩站、东北森林站、阿勒泰站、黑河站、甘德站以及错那站6个超级站周围开展样方观测(图4),样方设计包括500 m和25 km 2个尺度。①500 m样方观测:以超级站中心,向南、北、东、西4个方向开展雪深观测。每个方向按直线走1 km,每隔50 m采集雪深、雪水当量以及经纬度,使用仪器为雪秤。一次观测覆盖4个500 m×500 m的区域。在4个方向各选择1个50 m×50 m的网格进行加密观测,每隔10 m记录雪深。在积累期、稳定期和消融期各观测一次,查看不同尺度上雪深的分布特点。②25 km样方观测:在超级站附近选择一个25 km×25 km的范围,通过在样方内选择主线和测雪线路开展雪深和雪水当量观测。
图4 超级站样方设计示意图
红线为主干线,绿线为测雪线路
Fig.4 Distribution of measurement routes of samples
Red line is main obeserving route, green line is snow course
(1) 天山雪崩站样方的下垫面主要是草原,样方观测以2条主线展开,同时包含4条测雪线路。主干线上每隔2 km观测1次雪深和雪水当量。测雪线路长度为2~3 km,每隔50 m观测1次。该区域属于稳定积雪区,选择积累期、稳定期和消融期各观测一次。
(2) 净月潭站样方包含农田和森林,以4条主线分别开展观测,每隔2 km记录1次雪深和雪水当量,并在每一条主线上开展测雪线路观测。测雪线路长度为2~3 km,每隔50 m观测1次,共6条测雪线路,2条测量森林雪深,2条测量农田,2条测量森林农田混合。该区域属于稳定积雪区,观测时间同天山雪崩站。
(3) 阿勒泰站样方选择阿勒泰南边的荒漠开展观测,在25 km×25 km范围内分别以3条主线为基准开展观测,每隔2 km记录1次雪深和雪水当量。垂直每条主干线,开展测雪线路观测,测雪线路长度2 km,每隔50 m观测1次,总共观测4条测雪线路。阿勒泰属于稳定积雪区,观测时间同天山雪崩站。
(4) 黑河站样方观测包括2条主干线,4条测雪线路。主干线上每隔2 km观测1次雪深和雪水当量,测雪线路观测长度为500 m,每隔10 m观测1次,总共4条测雪线路,覆盖不同的坡向。受地形的影响,该区域积雪分布极其不均匀,消融速度也存在较大的空间差异,因此,需要在3次连续降雪的积累期和消融期开展观测。
(5) 甘德站样方观测包括3条主干线,4条测雪线路观测。主干线上每隔2 km观测1次雪深和雪水当量,测雪线路长度约为1 km,每隔10 m观测1次,每条主干线上1条测雪线路,共4条测雪线路。观测时间同黑河站。
(6) 错那站样方观测包括3条主干线,3条测雪线路。主干线每隔2 km观测1次雪深和雪水当量,测雪线路长度约为500 m,每隔10 m观测1次,共3条测雪线路。观测时间同黑河站。
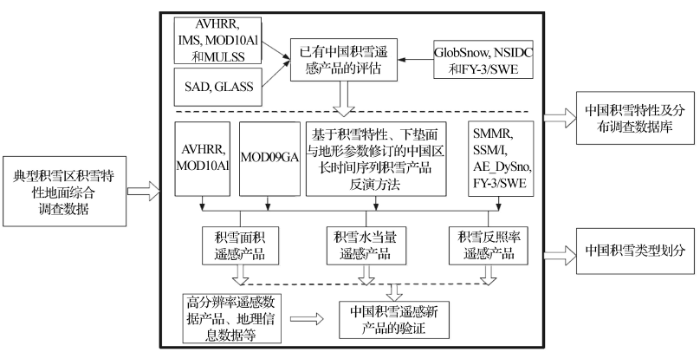
遥感调查补充地面调查的站点分布不均一性和点面测量不一致性,主要开展3个方面的工作(图5):针对已有的积雪遥感产品,开展中国区域综合评估与适用性分析;结合地面调查的积雪特性数据,生产中国区域长序列关键积雪参数遥感产品反演与产品;开展遥感产品的精度验证与误差分析。
图5 中国积雪特性遥感调查技术路线图
Fig.5 Technical flowchart of investigating snow characteristics in China
4.4.1 已有积雪遥感产品的中国区域综合评估
利用积雪地面调查数据和历史观测资料,对国内外发布的积雪面积、雪水当量和积雪反照率遥感产品从空间分布、季节分布、时间序列、反演精度等方面开展综合评估:①针对IMS和MOD10A1等积雪面积产品,在典型区域利用地面调查和高分辨率遥感数据,对其进行误差评估;②针对Globsnow,NSIDC/SMMR & SSM/I SWE和NSIDC/AMSR-E SWE等雪水当量产品,对其在中国区域总体精度以及不同雪况的误差进行评价;③针对SAD和GLASS等积雪反照率产品,利用已有的地面辐射观测数据以及多源遥感反照率产品对其进行直接和间接评估。考虑典型区域评估样本的数量选择、质量控制以及抽样设计方案,分析各类产品的优缺点和适用性,重点评估多源遥感产品在中国内陆森林和草原、青藏高原和山地环境下的积雪时空分布特征和精度差异。
4.4.2 积雪面积遥感反演与产品生产
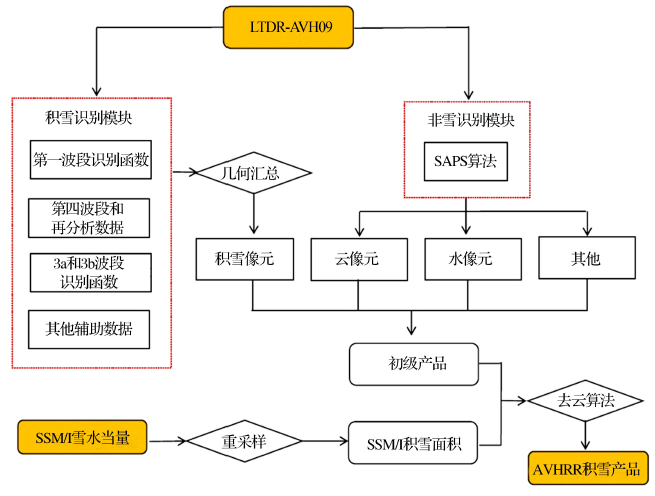
结合气象站地面观测数据、DEM和相关再分析数据,基于NASA-LTDR AVHRR地表反射率数据AVH09,发展决策树分类和融合算法,形成积雪像元识别模块和非雪像元识别模块,通过与微波雪深数据融合进行去云处理,制备一套空间分辨率5 km的1980—2020年逐日无云AVHRR积雪面积产品(图6)。
图6 基于AVHRR的积雪面积产品制备流程图
Fig.6 Flowchart of producing snow extent dataset based on AVHRR
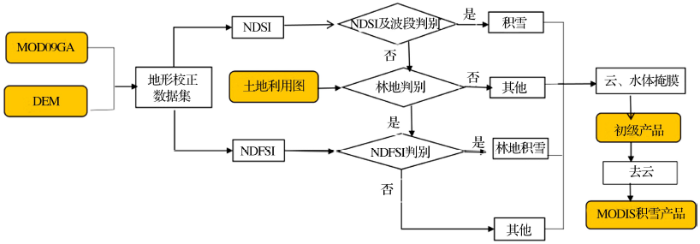
结合山区和林区的积雪野外调查数据、DEM、土地利用图和MODIS地表反射率数据MOD09GA,发展一套决策树分类算法,首先进行地形校正及NDSI辅助积雪判别,然后基于地面调查资料进一步获取林区积雪识别指数NDFSI阈值,最后通过融合方法去云,生成一套500 m空间分辨率的2000—2020年逐日无云MODIS积雪面积产品(图7)。
图7 基于MODIS的积雪面积产品制备流程图
Fig.7 Flowchart of producing snow extent dataset based on MODIS
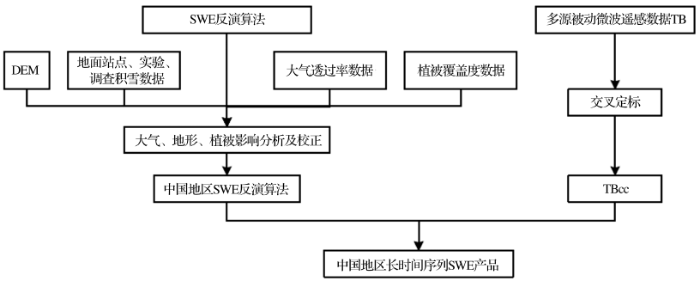
4.4.3 雪水当量遥感反演与产品生产
针对现有雪水当量遥感产品存在的不足,选择新疆天山区域和东北森林区域作为典型研究区,结合积雪地面调查和台站数据资料,分析山区地形、林区植被覆盖及大气对雪水当量反演的影响,发展中国区域雪水当量半经验反演算法(图8)。利用国内外已有的星载微波辐射计数据,分析多源被动微波遥感数据在传感器性能、观测条件等方面的差异,交叉验证长序列遥感产品生产过程中的数据一致性,对多源遥感数据进行交叉订正,生成长序列星载微波亮温观测数据集。利用在典型区发展的雪水当量反演算法,生成中国1980—2020年空间分辨率为25 km的逐日雪水当量产品。
4.4.4 积雪反照率遥感反演与产品生产
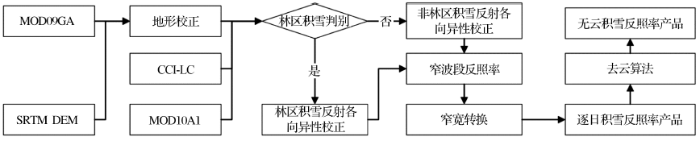
利用MODIS地表反射率产品MOD09GA、积雪面积产品MOD10A1、ESA土地覆盖产品CCI-LC、数字地形产品SRTM DEM、发展适合中国积雪特征的积雪反照率反演算法,制备中国2000年以来逐日积雪反照率产品,并对产品精度进行验证和评估。首先使用SRTM DEM对MODIS地表反射率产品MOD09GA进行地形校正,基于MODIS积雪面积产品MOD10A1获得积雪范围,利用ESA土地覆盖产品CCI-LC提取林地区域;然后对非林区积雪使用ART模型进行积雪反射各向异性校正,获得窄波段反照率;对林区积雪使用混合反照率模型进行积雪反射各向异性校正,获得窄波段反照率;进一步经过窄宽转换,得到宽波段逐日积雪反照率产品,最后研发有效的数据合成去云算法,获得无云积雪反照率产品。
4.4.5 中国积雪关键参数遥感产品验证
以典型积雪区积雪特性地面调查为基础,结合地面观测和已有积雪遥感产品数据,对积雪面积、雪水当量和积雪反照率产品开展精度验证与误差分析。考虑不同下垫面与地形差异设计空间采样验证方案,分析地形和环境对各类积雪产品精度的影响, 形成反演算法的反馈方案,提高遥感产品精度,最终在空间分布和时间序列二维尺度上综合验证积雪遥感产品的精度,形成一套完整的产品数据集。
积雪面积产品将利用30 m分辨率TM数据结合站点观测、地面调查结果开展直接验证,得到积雪覆盖产品的时间、空间误差分布特征,对比新产品与IMS和MOD10A1等产品的误差改进情况,在典型区分析积雪面积误差的影响因素。雪水当量产品因其分辨率较低,分析典型区内积雪的空间异质性,为野外调查的样方设计提供依据,采用逐级验证法在典型区获取雪水当量的采样观测,利用水平插值、相关系数、回归分析等多种分析手段,得到反演精度及误差分布,量化新产品相对于Globsnow等雪水当量产品的精度提高水平。积雪反照率产品的验证将基于同质像元时间尺度匹配的验证方法,利用地面调查的积雪反照率同步观测数据开展直接验证,得到积雪反照率产品的时空误差分布,比较与现有MODIS反照率产品的精度差异及原因。
在国内外已有的积雪类型划分基础上,使用遥感与地面积雪调查的最新成果,改进并更新中国地区积雪类型划分。以Sturm-Holmgren分类体系为基础,通过地面调查获得的积雪特性信息,结合气候带特征、气象要素与最新的土地利用数据进行综合分析,构建分类流程,获得中国积雪类型分类图。结合遥感调查获得的长序列积雪分布数据,按稳定性对积雪类型进行划分,并结合气候带特点,获得中国积雪稳定性分类图。
在已有的国内外积雪分类和中国积雪特性多年变化情况统计基础上,进行适合我国积雪特性的类型划分。划分依据主要考虑气候因素和积雪物理属性2个方面:
(1) 沿用Sturm-Holmgren 的分类方法,基于积雪特性调查数据和主要气候变量(温度、风速、降水等)进行积雪分类。积雪类型包括:泰加林型积雪(taiga)、高山型积雪(alpine)、海洋型积雪(maritime)、草原型积雪(prairie)、苔原型积雪(Tundra)和瞬时型积雪(ephemeral)。3个气候变量直接影响积雪的性质,阈值的确定会在各区域有所差别,数据来源的精度也将影响分类结果。
(2) 将基于Sturm-Holmgren方法的积雪分类结果与气候分区图、土地覆盖图、地形图等进行叠加分析,结合积雪特性调查数据,利用多变量分析方法确定中国积雪类型的主要影响因素及分类阈值,确立适合中国积雪特性的分类体系,形成更准确细致的中国积雪类型图。
利用积雪特性调查数据,在已有的中国积雪稳定性划分的基础上进行改进。依据多年平均连续积雪天数(d)和积雪年际变率(CV)2项指标,对中国的稳定和不稳定积雪区进行重新划分,即在原有连续积雪天数划分标准基础上,同时引入积雪年际变率,形成划分综合指标。
以1∶ 100万地形图为基础底图,根据需要叠置中国气候区划图或土地覆盖图作为背景图层,使用最新的国家2000大地坐标系,制定积雪类型、密度、日数、深度/雪水当量和反照率的分级与制图符号表示方法,并设计相应的积雪特性专题图层,编制1∶ 100万中国积雪系列专题图件。
(1) 积雪类型图:在积雪调查和积雪类型划分所获取数据的基础上,编制1980年以来基于2种不同划分方法(Sturm-Holmgren方法、稳定性积雪划分方法)的积雪类型图。
(2) 积雪密度图:基于地面观测获得的积雪密度数据,经质量控制和统计分析,编制多年平均的逐月(9月到翌年5月)积雪密度图和标准偏差图。
(3) 积雪日数图:以遥感积雪面积长序列数据集为基础,编制1980年以来积雪持续日数图、积雪初日和终日图;编制积雪覆盖日数的多年变率图。
(4) 积雪深度/雪水当量图:以积雪深度/雪水当量长序列遥感数据集为基础,编制1980年以来多年平均逐月积雪深度/雪水当量图、积雪深度/雪水当量变率图。
(5) 积雪反照率图:以逐日积雪反照率遥感产品为基础,编制2000年以来逐月积雪反照率图、多年平均逐月(9月到翌年5月)积雪反照率图和标准偏差图。
在地面与遥感调查的基础上,进一步深化并制作与行业应用密切相关的典型积雪区和主要流域积雪专题图,涵盖农业生产、牧区雪灾、积雪水资源以及融雪洪水灾害等多个方面。
(1) 以吉林省农业区和黑龙江省农场为典型区,制作积雪区农田土壤墒情专题图。利用长序列积雪数据产品(积雪面积、雪水当量、融雪时间等)和定位观测数据(气象观测数据、积雪分层温度、不同深度土壤温湿度等),在考虑农田区高程分布、土壤类型、作物种植类型等综合因素的基础上,建立多年来农田区积雪与土壤水热的相关关系并构建农田区积雪—土壤水热模型,生成东北典型农田区积雪水热效应专题图,包括:东北典型农田区积雪—土壤水热地面观测数据集、农田雪水潜在供应量专题图以及春季土壤温度预报数据集、积雪影响下的春季农田土壤墒情专题图。
(2) 以新疆天山中段的开都河流域(以高山草甸类型为主)和北坡的玛纳斯流域(以森林草甸类型为主)为典型区,制作融雪洪水灾害专题图。利用长序列积雪数据产品(积雪面积、雪水当量、融雪时间),对该地区融雪型洪水发生过程各时段气象因子(气温、降水、冻土、500 hPa环流形势基本特征和0 ℃层高度等)、流域积雪分布(积雪面积、雪深、雪水当量及反照率)、流域出山口径流、地形(海拔高度、坡度、坡向)和地貌特征数据(土壤类型、植被覆盖度)进行综合分析,制作典型流域融雪型洪水爆发影响范围专题图、融雪型洪水强弱等级专题图和致灾(高温或强降雨)类型专题图。
(3) 以青藏高原牧区为典型区,制作青藏高原牧区雪灾专题图。在考虑牧区高程分布、草地类型、草层高度、社会经济数据等综合因素的基础上,根据灾情资料(主要为牲畜死亡率),依据易损性模型,确定不同等级雪灾条件下牲畜死亡率临界值,根据临界值进行各地承灾体易损性区划,在致灾因子危险性分析基础上制作青藏高原牧区雪灾时空分布和风险性专题图。
(4) 以河西内陆河黑河流域为典型区,制作西北干旱内陆河流域积雪水资源专题图。针对分布式寒区水文模型和遥感参数标定方法,利用遥感调查获得的长序列高空间分辨率积雪遥感数据,为模型提供标定的目标函数以及驱动数据;利用地面调查获得的积雪属性数据,为模拟系统提供更为准确的参数信息,进而准确估算公里尺度上的雪水当量分布以及融雪水资源对河川径流的贡献,制作西北地区典型流域积雪储量和融雪径流专题图。
本文对“中国积雪特性及分布调查”项目的背景、内容、目标以及实施方案进行了介绍。该项目将利用历史资料整编、地面实测以及遥感反演的手段对中国地区的积雪特性时空分布进行系统且全面的调查,发展积雪特性调查规范,获取完整的中国积雪特性数据集,并基于调查数据对中国地区积雪进行分类。
地面调查将总结以往观测试验,借鉴国内外观测规范,建立中国积雪特性野外调查观测规范。收集气象站点的积雪观测历史资料和各参加单位固定站点及野外考察积雪观测资料,通过规范化的分类整编,查验和完善基础属性信息,形成元数据,并对固定站点雪深资料的区域代表性进行评估,建立积雪地面观测历史资料整编数据集。综合考虑我国积雪时空分布特征和气候带等基础信息,在已有观测基础上设计有代表性的点、线、面积雪观测方案,在积雪积累期、积雪稳定期和积雪消融期开展详细的积雪特性地面调查工作,建立中国典型积雪区积雪特性地面调查综合数据库。
积雪遥感调查将在评价和评估已有产品的基础上,开展中国区域关键积雪参数长时间序列遥感产品反演算法研究与产品生产。利用地面调查获取野外实验数据与地面台站实测数据,改进中国区域已有遥感产品在时间序列不全面、区域精度差异较大等问题,形成1980—2020年高时空分辨率、长序列积雪遥感调查数据集,并对数据集进行验证。新的积雪遥感数据集将成为我国首个自1980年以来逐日连续、高精度的积雪数据集,满足我国水文、气候、生态、灾害等方面的应用需求,并为全球变化研究提供数据基础。
在积雪地面调查与遥感调查完整而规范的信息基础上,开展中国积雪类型划分,改进中国区域已有的积雪类型划分不准确的问题,并进一步制作与行业需求和科学研究紧密结合的积雪调查专题图。更新后的成果将体现中国区域积雪调查数据在积雪类型划分中的作用,填补我国科学家在积雪类型划分工作中的空白。针对农田水利、积雪水资源、融雪洪水灾害以及牧区雪灾等方面的积雪专题图,是即将开展的积雪调查、已有的科学研究与国家需求紧密结合的科学产出,是科学调查数据在民生应用中的具体体现。
我们相信通过该调查的实施,将获得一套完整且规范的积雪特性资料,弥补目前积雪特性信息库的不足,为气候变化研究、水文水资源管理以及积雪相关灾害的预警预测等提供有力的数据支撑。
致 谢:整编的历史观测资料来自各野外台站以及气象站多年的辛苦工作。项目参加单位包括中国科学院遥感与数字地球研究所、中国科学院东北地理与农业生态研究所、中国科学院新疆生态与地理研究所、国家卫星气象中心、北京师范大学、兰州大学、南京大学、西藏高原大气环境科学研究所、中国气象局乌鲁木齐沙漠气象研究所、青海省气象科学研究所、西北大学。除了文中列出的作者以外,还有众多的贡献者,特致谢忱。
The authors have declared that no competing interests exist.
| [1] |
Updated understanding of climate change sciences [J].气候变化科学的最新认知 [J].
政府间气候变化专门委员会(IPCC)第一工作组于2007年2月2日发布的第四次评估报告明确指出,近100 a(1906-2005年)地球表面平均温度上升了0.74℃,近50 a的线性增温速率为0.13℃/10 a,1850年以来最暖的12个年份中有11个出现在近期的1995-2006年。全球变暖已经是不争的科学事实,报告认为人类活动是近50 a全球气候系统变暖的主要原因。 IPCC评估报告是国际科学界对气候变化问题最权威、最全面的认识,代表了目前全球气候变化研究的科学认识水平,是国际上制定相关政策的重要依据。
|
| [2] |
Changing northern hemisphere snow seasons [J].
Abstract Spatial and temporal patterns in the onset, offset, and length of the snow season across Northern Hemisphere continents are examined for the period from 1967 to 2008. Full snow seasons (FSS) and core snow seasons (CSS) are defined based on the consistency of snow cover within a location over the course of the cold season. Climatologically, the seasonal onsets of FSS and CSS progress more rapidly across the continents than the slower spring northward offset. Average Northern Hemisphere FSS duration has decreased at a rate of 0.8 week decade 611 (5.3 days decade 611 ) between the winters of 1972/73 and 2007/08, while there is no significant hemispheric change in CSS duration. Changes in the FSS duration are attributed primarily to a progressively earlier offset, which has advanced poleward at a rate of 5.5 days decade 611 . A major change in the trends of FSS offset and duration occurred in the late 1980s. Earlier FSS offsets, ranging from 5 to 25 days, and resultant abbreviated durations are observed in western Europe, central and East Asia, and the mountainous western United States. Where regional changes in CSS were observed, most commonly there were shifts in both onset and offset dates toward earlier dates. Results indicate that it is important to pay close attention to spring snowmelt as an indicator of hemispheric climate variability and change.
|
| [3] |
Spatial distribution and temporal variation of snow water resources in China during 1993-2002 [J].1993—2002年中国积雪水资源时空分布与变化特征 [J].
利用1993—2002年SSM/I被动微波逐日积雪深度反演结果,研究了我国积雪水资源的分布与变化.结果表明:积雪储量近10a来没有明显的减少或增加趋势,但是存在年际间的波动;我国冬季积雪储量主要分布在东北、北疆、青藏高原东部和其边缘地区,以及华北地区;东北、北疆和青藏高原地区为我国的稳定积雪地区;青藏高原地区积雪储量小于东北地区,但年积雪日数大于东北地区.近10a最大积雪水资源量平均约为102.79km<sup>3</sup>,其中最大年份为1999/2000年度,约为131.34km<sup>3</sup>.
|
| [4] |
Influence of climate change on the runoff of melting snow in the arid mountainous areas in China [J].气候变化对中国内陆干旱区山区融雪径流的影响 [J].
气候变化对中纬度山区积雪具有极强的影响,同时雪盖时空变化和融 雪径流的波动被认为是气候变化的指示器.本研究选择祁连山黑河流域作为中国西北地区山区积雪流域的典型区域,分析了自1956~2001年近40余年以来 气温、降水、累计降雪变化的状况和特点以及春季融雪径流的波动趋势.结果表明:黑河上游山区积雪流域的气候变化主要表现在年平均气温的缓慢上升而年降水基 本平稳,累积降雪量也处于波动变化之中.年内气温的上升幅度以1~2月份比较强烈而其他月份气温上升幅度较小.利用基于度-日因子算法的融雪径流模型 SRM(SnowmeltRunoff Model)模拟气温上升框架下的融雪径流变化情势结果表明山区积雪流域融雪期在时间上的前移,同时春季融雪径流量呈显著增加趋势且受径流周期变化控制.
|
| [5] |
|
| [6] |
Study on monitoring snow disaster in tibet using remote sensing [J].西藏那曲雪灾的遥感监测研究 [J]. |
| [7] |
Interannual climate variability and snowpack in the western United States [J]. |
| [8] |
Estimating winter evaporation in boreal forests with operational snow course data [J].
Abstract Snow course measurements from 11 sites located in eastern and northern Finland were used to estimate the total interception evaporation of a winter season for different forest categories. We categorized the sites based on forest density and tree species. Results showed that interception loss from gross precipitation increased with forest density and approached 30% for a forest with the highest density class. Interception loss for the most common forest density class was 11%. Interception losses were slightly larger in spruce forests than in pine, deciduous, or mixed forests. We provide suggestions as to how to design snow surveys to estimate wintertime interception evaporation better. Rough terrain and transition zones between forest and open areas should be avoided. Since evaporation fraction was strongly dependent on tree crown characteristics, snow course data should include direct estimates of canopy closure. Qualitative observations made by different observers should be given a reference frame to ensure comparability of records from different sites. Copyright 漏 2003 John Wiley & Sons, Ltd.
|
| [9] |
Spatial-temporal characteristics of observed key parameters for snow cover in China during 1957-2009 [J].1957—2009年中国台站观测的关键积雪参数时空变化特征 [J].
利用1957-2009年中国地面气象台站观测积雪资料分析表明, 中国年平均雪深、雪水当量、积雪密度分别为0.49 cm、0.7 mm、0.14 g·cm<sup>-3</sup>. 平均来说, 三者在青藏高原地区都是最小的, 在西北地区均较大; 空间上, 中国年平均雪深和雪水当量大值区位于东北和新疆北部, 以及青藏高原西南部的小部分区域; 中国大部分地区年平均积雪密度在0.14 g·cm<sup>-3</sup>以下, 3大稳定积雪区积雪密度略高. 1957-2009年, 中国及各区域年平均雪深和雪水当量均表现为波动增加趋势, 但不显著; 空间上雪深的显著正趋势主要位于内蒙古东部、东北北部、新疆西北部和青藏高原东北部; 雪水当量与雪深类似, 但正趋势范围不如前者广, 负趋势范围则较大.
|
| [10] |
Snow cover of China during the last 40 years: Spatial distribution and interannual variation [J].40余年来中国地区季节性积雪的空间分布及年际变化特征 [J].
<FONT face=Verdana>利用全国700余个气象站的地面积雪观测资料,分析了中国地区季节性积雪年际的时空变化特征. 结果表明:新疆北部,东北-内蒙古地区和青藏高原西南和南部地区为我国季节性积雪的3个高值区,也是积雪年际变化变化大的地区,也即为中国积雪年际异常变化的敏感区. 综合积雪深度和积雪日数的变化趋势,可大致分为3种变化类型:1) 增加和减小同步,主要在新疆天山以北、青藏高原东部地区、内蒙古高原中东部到大兴安岭以西的地区,减少区大体在内蒙古西部、黄土高原和长江中下游地区;2)积雪深度增加但积雪日数减少,主要在东北平原东部的部分地区,长江上游的部分地区;3)积雪深度减小而积雪日数增加,主要位于青藏高原中部的部分地区. 中国地区积雪总体上呈现出平缓的增长趋势,积雪深度和积雪日数的年代际变化趋势在20世纪60年代呈现为稍有增加,70年代有所下降,80年代又增加,90年代又有略有增加的趋势. </FONT>
|
| [11] |
|
| [12] |
Scale effects in a distributed snow water equivalence and snowmelt model for mountain basins [J]. |
| [13] |
Estimating the spatial distribution of snow in mountain basins using remote sensing and energy balance modeling [J].
We present a modeling approach that couples information about snow cover duration from remote sensing with a distributed energy balance model to calculate the spatial distribution of snow water equivalence (SWE) in a 1.2 kmmountain basin at the peak of the accumulation season. In situ measurements of incident solar radiation, incident longwave radiation, air temperature, relative humidity, and wind speed were distributed around the basin on the basis of topography. Snow surface albedo was assumed to be spatially constant and to decrease with time. Distributed snow surface temperature was estimated as a function of modeled air temperature. We computed the energy balance for each pixel at hourly intervals using the estimated radiative fluxes and bulk-aerodynamic turbulent-energy flux algorithms from a snowpack energy and mass balance model. Fractional snow cover within each pixel was estimated from three multispectral images (Landsat thematic mapper), one at peak accumulation and two during snowmelt, using decision trees and a spectral mixture model; from these we computed snow cover duration at subpixel resolution. The total cumulative energy for snowmelt at each remote sensing date was weighted by the fraction of each pixel's area that lost its snow cover by that date to determine an initial SWE for each pixel. We tested the modeling approach in the well-studied Emerald Lake basin in the southern Sierra Nevada. With no parameter fitting the modeled spatial pattern of SWE and the mean basin SWE agreed with intensive field survey data. As the modeling approach requires only a remote sensing time series and an ability to estimate the energy balance over the model domain, it should prove useful for computing SWE distributions at peak accumulation over larger areas, where extensive field measurements of SWE are not practical.
|
| [14] |
The influence of the spatial distribution of snow on basin-averaged snowmelt [J]. |
| [15] |
Multispectral and hyperspectral remote sensing of alpine snow properties [J]. |
| [16] |
CLPX LSOS snow pit measurements [M] |
| [17] |
CLPX GBMR snow pit measurements [M] |
| [18] |
HiWATER: An integrated remote sensing experiment on hydrological andecological processes in the Heihe River Basin [J].黑河流域生态—水文过程综合遥感观测联合试验总体设计 [J].
介绍了“黑河流域生态—水文过程综合遥感观测联合试验”的背景、科学目标、试验组成和试验方案。试验的总体目标是显著提升对流域生态和水文过程的观测能力,建立国际领先的流域观测系统,提高遥感在流域生态—水文集成研究和水资源管理中的应用能力。由基础试验、专题试验、应用试验、产品与方法研究和信息系统组成。其中,①基础试验:搭载微波辐射计、成像光谱仪、热像仪、激光雷达等航空遥感设备,开展一系列关键生态和水文参量的观测;发展遥感正向模型及反演和估算方法。形成覆盖全流域的水文气象综合观测网,为流域生态—水文模型研究提供更有代表性的模型参数、驱动数据及更高精度的验证数据。构建无线传感器网络,度量生态水文模型所需的若干关键的驱动、参数和模型状态的空间异质性。开展航空遥感定标和地基遥感试验。依托传感器网络,并辅之以地面同步和加密观测,开展遥感产品真实性检验。②专题试验:开展“非均匀下垫面多尺度地表蒸散发观测试验”,采用密集的涡动相关仪、大孔径闪烁仪与自动气象站的观测矩阵,为揭示地表蒸散发的空间异质性,实现非均匀下垫面地表蒸散发的尺度扩展,发展和验证蒸散发模型提供基础数据。③应用试验:在流域上、中、下游分别开展针对积雪和冻土水文、灌溉水平衡和作物生长、生态耗水的综合观测试验,将观测数据和遥感产品用于上游分布式水文模型、中游地表水—地下水—农作物生长耦合模型、下游生态耗水模型,通过实证研究提升遥感在流域生态—水文集成研究和水资源管理中的应用能力。加强试验将在2012年5月起按中游、上游、下游的顺序展开,全流域持续观测期为2013—2015年。在各类试验的支持下,开展全流域生态—水文关键参量遥感产品生产,发展尺度转换方法,建立多源遥感数据同化系统。
|
| [19] |
Heihe Watershed Allied Telemetry Experimental Research (HiWATER): Scientific objectives and experimental design [J]. |
| [20] |
The cold regions hydrological remote sensing and ground-based synchronous observation experiment in the upper reaches of Heihe River [J].黑河流域上游寒区水文遥感—地面同步观测试验 [J].
<FONT face=Verdana>介绍了黑河流域上游寒区水文遥感-地面同步观测试验,论述了试验目标与研究内容、试验区的选择设计以及寒区水文长期观测试验.上游试验以理解寒区水文过程、提高寒区定量遥感水平为主旨,以积雪和冻土为主要研究对象,开展了微波辐射计、高光谱成像仪航空遥感和地面同步观测,并选择典型小流域进行长期寒区水文过程观测与研究. 试验集中在冰沟积雪小流域、阿柔草场和扁都口裸露耕地3个不同地表覆盖区,以积雪和冻土变量与参数的测量为主. 同步试验在流域尺度、重点试验区、加密观测区和观测小区4个尺度上展开,分别布置了加密的地面同步观测、通量和气象水文观测、降雨、径流及其它水文要素观测网络;航空飞行传感器分别采用微波辐射计、高光谱成像仪、热红外成像仪和多光谱CCD相机,收集获取了试验区丰富的可见光/近红外、热红外、主被动微波等卫星数据. 通过试验,初步构建了上游寒区航空-卫星-地面综合数据集,可以应用于改进和验证寒区陆面/水文过程模型. </FONT>
|
| [21] |
Prospects for the interactive multisensor snow and Ice Mapping System (IMS) [ |
| [22] |
Improvement of snow depth retrieval for FY3B-MWRI in China [J].
The primary objective of this work is to develop an operational snow depth retrieval algorithm for the FengYun3B Microwave Radiation Imager (FY3B-MWRI) in China. Based on 7-year (2002-2009) observations of brightness temperature by the Advanced Microwave Scanning Radiometer-EOS (AMSR-E) and snow depth from Chinese meteorological stations, we develop a semi-empirical snow depth retrieval algorithm. When its land cover fraction is larger than 85%, we regard a pixel as pure at the satellite passive microwave remote-sensing scale. A 1-km resolution land use/land cover (LULC) map from the Data Center for Resources and Environmental Sciences, Chinese Academy of Sciences, is used to determine fractions of four main land cover types (grass, farmland, bare soil, and forest). Land cover sensitivity snow depth retrieval algorithms are initially developed using AMSR-E brightness temperature data. Each grid-cell snow depth was estimated as the sum of snow depths from each land cover algorithm weighted by percentages of land cover types within each grid cell. Through evaluation of this algorithm using station measurements from 2006, the root mean square error (RMSE) of snow depth retrieval is about 5.6 cm. In forest regions, snow depth is underestimated relative to ground observation, because stem volume and canopy closure are ignored in current algorithms. In addition, comparison between snow cover derived from AMSR-E and FY3B-MWRI with Moderate-resolution Imaging Spectroradiometer (MODIS) snow cover products (MYD10C1) in January 2010 showed that algorithm accuracy in snow cover monitoring can reach 84%. Finally, we compared snow water equivalence (SWE) derived using FY3B-MWRI with AMSR-E SWE products in the Northern Hemisphere. The results show that AMSR-E overestimated SWE in China, which agrees with other validations.
|
| [23] |
Estimation of snow depth from passive microwave brightness temperature data in forest regions of northeast China [J].
Snow depth is an important factor in water resources management in Northeast China. Forest covers 40% of Northeast China, and the presence of forests influences the accuracy of snow depth retrievals from passive microwave remote sensing data. An optimal iteration method was used to retrieve the forest transmissivities at 18 and 36聽GHz based on the snow and forest microwave radiative transfer models and the snow properties measured in field experiments. The transmissivities at 18 and 36聽GHz are 0.895 and 0.656 in the horizontal polarization, and 0.821 and 0.615 in the vertical polarization, respectively. Furthermore, the forest transmissivity and snow properties were input into the Microwave Emission Model of Layered Snowpacks (MEMLS) to establish a dynamic look-up table (LUT). Snow depths were retrieved from satellite passive microwave remote sensing data based on the LUT method, and these retrievals were verified by snow depth observations at 103 meteorological stations. The results showed that the bias between the retrieved and measured snow depths is very small, with root mean square errors (RMSEs) of approximately 6聽cm in forest regions and 4聽cm in non-forest regions. When compared with the existing snow products, the snow depth retrieved in this work presented the highest level of accuracy. The regional snow depth product in China is superior to the GlobSnow and NASA AMSR-E standard SWE products in non-forest regions, whereas the GlobSnow estimate is superior to the regional snow depth product in China and NASA AMSR-E standard SWE product estimates in forest regions. Therefore, we conclude that 1) the influence of forest on snow depth retrieval is important, and the appropriate forest parameters should be considered in the estimation of snow depth from passive microwave brightness temperature data; and 2) the snow depth retrieval algorithm based on the dynamic LUT method proved to be efficient in Northeast China.
|
| [24] |
Snow depth derived from passive microwave remote-sensing data in China [J].
In this study, we report on the spatial and temporal distribution of seasonal snow depth derived from passive microwave satellite remote-sensing data (e.g. SMMR from 1978 to 1987 and SMM/I from 1987 to 2006) in China. We first modified the Chang algorithm and then validated it using meteorological observation data, considering the influences from vegetation, wet snow, precipitation, cold desert and frozen ground. Furthermore, the modified algorithm is dynamically adjusted based on the seasonal variation of grain size and snow density. Snow-depth distribution is indirectly validated by MODIS snow-cover products by comparing the snow-extent area from this work. The final snow-depth datasets from 1978 to 2006 show that the interannual snow-depth variation is very significant. The spatial and temporal distribution of snow depth is illustrated and discussed, including the steady snow-cover regions in China and snow-mass trend in these regions. Though the areal extent of seasonal snow cover in the Northern Hemisphere indicates a weak decrease over a long period, there is no clear trend in change of snow-cover area extent in China. However, snow mass over the Qinghai-Tibetan Plateau and northwestern China has increased, while it has weakly decreased in northeastern China. Overall, snow depth in China during the past three decades shows significant interannual variation, with a weak increasing trend.
|
| [25] |
First operational BRDF, albedo nadir reflectance products from MODIS [J].
With the launch of NASA's Terra satellite and the MODerate Resolution Imaging Spectroradiometer (MODIS), operational Bidirectional Reflectance Distribution Function (BRDF) and albedo products are now being made available to the scientific community. The MODIS BRDF/Albedo algorithm makes use of a semiempirical kernel-driven bidirectional reflectance model and multidate, multispectral data to provide global 1-km gridded and tiled products of the land surface every 16 days. These products include directional hemispherical albedo (black-sky albedo), bihemispherical albedo (white-sky albedo), Nadir BRDF-Adjusted surface Reflectances (NBAR), model parameters describing the BRDF, and extensive quality assurance information. The algorithm has been consistently producing albedo and NBAR for the public since July 2000. Initial evaluations indicate a stable BRDF/Albedo Product, where, for example, the spatial and temporal progression of phenological characteristics is easily detected in the NBAR and albedo results. These early beta and provisional products auger well for the routine production of stable MODIS-derived BRDF parameters, nadir reflectances, and albedos for use by the global observation and modeling communities.
|
| [26] |
Commentary on Wang and Zender—MODIS snow albedo bias at high solar zenith angles relative to theory and to in situ observations in Greenland [J].
The recent paper by Wang and Zender [Wang, X., & Zender, C. S. (2010). MODIS snow albedo bias at high solar zenith angles relative to theory and to in situ observations in Greenland. Remote Sensing of Environment.] draws erroneous conclusions about solar zenith angle biases at high latitudes by not making appropriate use of the extensive quality flags available with the MODIS BRDF/Albedo. Coarse resolution MODIS white-sky albedo data are compared with actual blue-sky field albedometer measurements from the Greenland GC-Net. By utilizing large area averages of the MODIS data product that combine both high quality and poor quality data indiscriminately, the authors erroneously conclude that the accuracy deteriorates for solar zenith angle (SZA) > 55掳 and often becomes physically unrealistic for SZA > 65掳. Once the quality flags are considered, however, the comparisons demonstrate that the MODIS product performs quite well out to the recommended limit for product use of 70掳 SZA. This verifies the conclusions of an earlier more rigorous evaluation performed by Stroeve et al. [Stroeve, J., Box, J. E., Gao, F., Liang, S., Nolin, A., & Schaaf, C. B. (2005). Accuracy assessment of the MODIS 16-day albedo product for snow: comparisons with Greenland in situ measurements. Remote Sensing of Environment.]. With over a decade of observations and products now available from the MODIS instrument, these data are increasingly being used to evaluate and tune climate and biogeochemical models. However, such use should take into account the documented quality and limitations of the satellite-derived product.
|
| [27] |
Variation of surface albedo and soil thermal parameters with soil moisture content at a semidesert site on the western Tibetan Plateau [J].
Almost three years of continuous measurements taken between January 2001 and May 2003聽at the Gaize (or Gerze) automatic weather station (32.30 掳N, 84.06 掳E, 4420 m), a cold semi-desert site on the western Tibetan Plateau, have been used to study seasonal and annual variations of surface albedo and soil thermal parameters, such as thermal conductivity, thermal capacity and thermal diffusivity, and their relationship to soil moisture content. Most of these parameters undergo dramatic seasonal and annual variations. Surface albedo decreases with increasing soil moisture content, showing the typical exponential relation between surface albedo and soil moisture. Soil thermal conductivity increases as a power function of soil moisture content. The diffusivity first increases with increasing soil moisture, reaching its maximum at about 0.25 (volume per volume), then slowly decreases. Soil thermal capacity is rather stable for a wide range of soil moisture content.
|
| [28] |
Accuracy analysis for MODES snow products of MOD10A1 and MOD10A2 [J].北疆牧区MODIS积雪产品MOD10A1和MOD10A2的精度分析与评价 [J].
应用涡度相关技术连续监测的CO2通量及温度数据(2003年1月1日至2004年12月31日),分析了青藏高原高寒灌丛净生态系统CO2交换(NEE)日变化与温度之间的关系.结果表明:1)在暖季夜间(21:00至次日06:00时)温度与NEE变化呈显著正相关关联,而白昼(07:00~20:00时)NEE变化与温度无显著关联;2)在冷季不论夜间还是白昼,NEE变化均与温度密切相关,温度是决定冷季高寒灌丛生态系统CO2交换的主要因素.在全球气候变暖背景下,青藏高原气候变化呈现出冬季增温率明显高于春、夏季特征,未来气候变暖导致的增温效应可能会加速青藏高原高寒灌丛生态系统CO2排放,使其作为碳汇的能力而减弱.
|
| [29] |
A long-term Global Land Surface Satellite (GLASS) data-set for environmental studies [J].
Recently, five Global LAnd Surface Satellite (GLASS) products have been released: leaf area index (LAI), shortwave broadband albedo, longwave broadband emissivity, incident short radiation, and photosynthetically active radiation (PAR). The first three products cover the years 19820900092012 (LAI) and 19810900092010 (albedo and emissivity) at 10900095 km and 8-day resolutions, and the last two radiation products span the period 20080900092010 at 5 km and 3-h resolutions. These products have been evaluated and validated, and the preliminary results indicate that they are of higher quality and accuracy than the existing products. In particular, the first three products have much longer time series, and are therefore highly suitable for various environmental studies. This paper outlines the algorithms, product characteristics, preliminary validation results, potential applications and some examples of initial analysis of these products.
|
| [30] |
MODIS snow-cover products [J]. |
| [31] |
An algorithm for the retrieval of albedo from space using semiempirical BRDF models [J].
Spectral albedo may be derived from atmospherically corrected, cloud-cleared multiangular reflectance observations through the inversion of a bidirectional reflectance distribution function (BRDF) model and angular integration. This paper outlines an algorithm suitable for this task that makes use of kernel-based BRDF models. Intrinsic land surface albedos are derived, which may be used to derive actual albedo by taking into account the prevailing distribution of diffuse skylight. Spectral-to-broadband conversion is achieved using band-dependent weighting factors. The validation of a suitable BRDF model, the semiempirical Ross-Li (reciprocal RossThick-LiSparse) model and its performance under conditions of sparse angular sampling and noisy reflectances are discussed, showing that the retrievals obtained are generally reliable. The solar-zenith angle dependence of albedo may be parameterized by a simple polynomial that makes it unnecessary for the user to be familiar with the underlying BRDF model. The algorithm given is that used for the production of a BRDF/albedo standard data product from NASA's EOS-MODIS sensor, for which an at-launch status is provided. Finally, the algorithm is demonstrated on combined AVHRR and GOES observations acquired over New England, from which solar zenith angle-dependent albedo maps with a nominal spatial resolution of 1 km are derived in the visible band. The algorithm presented may be employed to derive albedo from space-based multiangular measurements and also serves as a guide for the use of the MODIS BRDF/albedo product.
|
| [32] |
|
| [33] |
Snow depth and snow water equivalent estimation from AMSR-E data based on a priori snow characteristics in Xinjiang, China [J].
78 It is a new retrieval algorithm of snow from passive microwave remote sensing data. 78 A priori snow characteristics can improve the accuracy of snow retrieval algorithm. 78 The local snow conditions are important to retrieve snow depth and SWE.
|
| [34] |
Impact of disturbed desert soils on duration of mountain snow cover [J].
Snow cover duration in a seasonally snow covered mountain range (San Juan Mountains, USA) was found to be shortened by 18 to 35 days during ablation through surface shortwave radiative forcing by deposition of disturbed desert dust. Frequency of dust deposition and radiative forcing doubled when the Colorado Plateau, the dust source region, experienced intense drought (8 events and 39-59 Watts per square meter in 2006) versus a year with near normal precipitation (4 events and 17-34 Watts per square meter in 2005). It is likely that the current duration of snow cover and surface radiation budget represent a dramatic change from those before the widespread soil disturbance of the western US in the late 1800s that resulted in enhanced dust emission. Moreover, the projected increases in drought intensity and frequency and associated increases in dust emission from the desert southwest US may further reduce snow cover duration.
|
| [35] |
Radiative forcing and albedo feedback from the Northern Hemisphere cryosphere between 1979 and 2008 [J].
The extent of snow cover and sea ice in the Northern Hemispherehas declined since 1979, coincident with hemispheric warming and indicative of a positive feedback of surface reflectivity on climate. This albedo feedback of snow on land has been quantified from observations at seasonal timescales, and century-scale feedback has been assessed using climate models. However, the total impact of the cryosphere on radiative forcing and albedo feedback has yet to be determined from measurements. Here we assess the influence of the Northern Hemisphere cryosphere on Earth's radiation budget at the top of the atmosphere--termed cryosphere radiative forcing--by synthesizing a variety of remote sensing and field measurements. We estimate mean Northern Hemisphere forcing at -4.6 to -2.2Wm, with a peak in May of -9.0+/-2.7Wm. We find that cyrospheric cooling declined by 0.45Wmfrom 1979 to 2008, with nearly equal contributions from changes in land snow cover and sea ice. On the basis of these observations, we conclude that the albedo feedback from the Northern Hemisphere cryosphere falls between 0.3 and 1.1WmK, substantially larger than comparable estimates obtained from 18 climate models.
|

/
| 〈 |
|
〉 |
