
赵燕慧 , 路紫
, 路紫
Zhao Yanhui, Lu Zi
中图分类号: P963
文献标识码: A
文章编号: 1001-8166(2018)01-0103-09
通讯作者:
收稿日期: 2017-05-9
修回日期: 2017-12-11
网络出版日期: 2018-01-10
版权声明: 2018 地球科学进展 编辑部
基金资助:
作者简介:
First author:Zhao Yanhui(1990-), female, Zhangjiakou City, Hebei Province, Master student. Research areas include regional development and airspace scientific.E-mail:yvonne0866@163.com
作者简介:赵燕慧(1990-),女,河北张家口人,硕士研究生,主要从事区域开发和空域科学研究.E-mail:yvonne0866@163.com
展开
摘要
面对低碳航空发展态势给航空业带来的巨大挑战以及减排机制的转变,基于外部性视角,首先介绍并分析了航线网络模式影响航空碳排放环境损害的一般模型与碳排放环境损害要素的确定以及灵敏度分析方法的应用,然后系统总结了航线网络碳排放外部性要素——飞行操作阶段(着陆/起飞阶段与巡航阶段)、扇区飞行距离、航线类型、终端区近地空域的影响。现有研究表明:2类航线网络模式碳排放环境损害的方式和规模不同,城市对模式低于中心—辐射模式;航空碳排放环境损害是以上4个要素共同作用形成的,并与机型、航空公司类型等相联系。枢纽机场愈益严重的碳排放环境损害引发了对中心—辐射航线网络模式选择的质疑,当然,基于低碳经济对航线网络模式提出选择与调整的建议也需要考虑腹地市场问题。
关键词:
Abstract
In the face of the challenges posed by low-carbon aviation development to the aviation industry and the transformation of the emission reduction mechanism, based on the external perspective, firstly, the general expression of the environment damage model of aviation carbon emission and the element about the damage factors of carbon emission environment and the application of sensitivity analysis method were introduced and analyzed. Then, the external factors of carbon emissions in the airline network were analyzed systematically—The influence of the flight operation stage (LTO phase and cruise phase), the sector distance, the flight type and the terminal area airspace. The existing research showed that the two types of airline network model about the environment damage of aviation carbon emission were in different ways and sizes, and the city-pairs was lower than the hub-spoke; the environment damage of aviation carbon emission was the formation of the above four elements with the aircraft type and airline type. The hub airport’s carbon emissions triggered a challenge to the hub-spoke airline network model. In the low-carbon economy, corresponding suggestions on the airline network model were also faced with the hinterland market.
Keywords:
交通运输业作为能源消费密集型行业,是碳基燃料的主要用户,占全球累计碳排放总量的18%[1]。航空运输业CO2温室气体排放的环境损害问题日益显现,已占到全球累计碳排放总量的2%[2],特别是其高空排放(高空巡航阶段向大气中排放CO2、水蒸汽、氮氧化物和烟雾颗粒等物质,其中CO2占到高空排放总量的70%)长期滞留在大气中已成为温室效应的重要制造者。2006年12月欧盟委员会首先提议将航空运输纳入碳排放交易体系(European Union Emissions Trading System,EUETS),2008年7月草案得以通过,飞行欧盟国家产生的碳排放量将逐步受到欧盟碳排放体系的限制。2009年国际航空运输协会(International Air Transport Association,IATA)重申大幅降低航空运输CO2排放量实现无碳增长的承诺,并设立阶段性目标:至2020年燃油效率年均提升1.5%,至2050年CO2排放降低50%。以国际民航组织(International Civil Aviation Organization,ICAO)各成员国在第37届总会议气候变化谈判上签订的《减少航空温室气体排放协议》(2010年10月)和第39届大会通过的《国际民航组织关于环境保护的持续政策和做法的综合声明》(2016年10月)等文件为依据,可将航空碳排放环境损害定义为所有废气排放和燃料消耗带来的影响,新的全球性航空减排机制的一个重要特征是从客座率为基础的经济衡量转变为碳排放总量为基础的环境衡量。国际低碳航空发展态势以及机制转变引起学界对碳排放估算及影响模型构建、情景模拟与行为分配等议题的关注[3],其中尤为重视与碳排放绝对量[4]密切相关的航线网络模式对航空碳排放环境损害的研究。
与此同时,航线网络模式的市场选择与应用现已成为日益自由化的航空运输市场的一个重要特征。Nero[5]指出:作为航空公司自由化的结果,中心—辐射(Hub-Spoke)航线网络模式在世界各地得以繁荣。美国1980年代取消航空公司管制后即更多地使用枢纽机场(Hub)—辐射支线(Feeder)模式[6]。欧洲1990年代航空自由化后法航、荷兰航空、英国航空和汉莎航空等主要运营商的中心—辐射航线网络转运量显著增加[7]。近些年来这种网络模式的应用因特殊市场优势而持续增长:尽管受到枢纽机场日益拥挤的挑战,但与城市对(City-pairs)航线网络模式相比,单位运营成本较低,深受低成本航空公司(Low Cost Carrier,LCC)青睐。LCC市场份额在欧洲高水准国家达到34%,北美国家达到27%,亚洲国家预计2020年达到20%,韩国国内航线LCC已达29.1%、国际航线已达25.9%。近年来LCC的中转航班运营已成为航空网络演进的最重要因素[8]。所以以往在分析航线网络模式碳排放环境损害问题时,常基于市场评估而进行,并与扇区飞行距离(Sector Distance)[9]、航空公司类型、航线类型等结合在一起,评估中常应用经济交通指标(Economic Traffic Volumes)。
根据上述国际有关低碳经济环境政策和规定,参照2012年欧洲航空实施的针对所有飞机着陆/起飞(Landing and Take-off,LTO)的碳排放量上限的EUETS,航线网络模式及环境效益已被纳入碳排放总量减少的目标管理体系中[10]。在此将航空碳排放环境损害所依据的发动机/飞机组合及其耗油量及油耗指数等界定为内在性要素,与其对应将飞行相关的操作阶段、扇区飞行距离等界定为外部性要素。本文仅针对航空碳排放环境损害外部性要素的影响,分析城市对航线网络模式的不间断飞行(Non-stop Flights)与包括一个枢纽机场的中心—辐射航线网络模式的经停飞行(One-stop Flights)两者之间的环境损害差异。
依据城市对模式和中心—辐射模式2类基本的航线网络划分,将前者定义为出发地至目的地(Origin/Destination,O/D)的点对点(Point-to-point)不间断飞行,在飞行过程中不存在他们自己飞行之间或从他们自己到其他航空公司的乘客转移,将后者定义为经由枢纽机场的经停飞行。就航线网络模式影响航空碳排放模型构建问题,Morrell等[11]提出了枢纽机场—枢纽机场(Hub-to-hub)和中心旁路(Hubby-pass)2类航线网络模式碳排放的计算方法,并用于评估其优劣;Hickman等[12]针对总体CO2减排目标的实现和减少CO2排放量的途径,在伦敦研究报告(www.vibat.org)中开发了一个运输和碳模拟模型(Transport and Carbon Simulation Model,TC-SIM),并应用于一系列空运政策制定。桂钦昌等[13]综述了航空地理学视角的航空网络组织模式研究进展,透视了轴辐式网络结构形式[14,15]及LCC促进航空网络演变所产生的碳排放及气候效应[16]。
依据以上研究,可概括2类航线网络模式碳排放环境损害模型的一般表达式:城市对模式下从机场A到B直达的航空碳排放环境损害(货币量/航班)DAB=DA+DB=λ(TxA+TxB),即机场A和B间由航班x造成的环境损害,λ(航班/日)为机场A和B间的航班总量;中心—辐射模式下从机场A经由枢纽机场H到机场B的航空碳排放环境损害(货币量/航班)DAHB=DA+DH+DB=α(TyA+TyH)+β(TzH+TzB),即机场A和B通过枢纽H的航空碳排放环境损害(DA,DH和DB),TyA和TyH,TzH和TzB分别是机场A和机场H间航班y的环境损害、机场H和机场B间航班z的环境损害,α(航班/日)为机场A起飞的航班总量,β(航班/日)为机场H起飞的航班总量。航线网络碳排放环境损害模型可用于评估机场A-B间不间断的城市对模式飞行情形和通过枢纽机场H的中心—辐射模式飞行情形的差异。
2.2.1 基于飞行操作阶段的要素确定
近年来,在广泛的航空业低碳经济调整大框架下,学者们较集中讨论了城市对和中心—辐射2类航线网络模式不同飞行阶段影响航空碳排放环境损害的外部性要素组成问题。如Lu等[17]选择LTO阶段(LTO Phase)和巡航阶段(Cruise Phase)测算了飞机碳排放造成的环境损害。将起飞(Take-off)、爬升(Climb-out)、靠近(Approach)、滑行/空转(Taxi/Idle)和巡航(Cruise)5种飞行操作阶段分开计算是较常见的研究方式。再如Miyoshi等[18]依据政府间气候变化专门委员会(Intergovernmental Panel on Climate Change,IPCC,1997)准则和欧洲环境署“排放清单指南”(2006)获得了LTO阶段的排放量,又参照“飞机性能数据库(Base of Aircraft Data,BADA)”获得了巡航阶段的燃料消耗,计算了中心—辐射航线网络模式上枢纽机场的极大碳排放量。又如Kollmuss等[19]针对2类航线网络模式影响碳排放的机理,运用碳中和方法,以Atmosfair(非盈利环保公司),TRX Travel Analytics(航空数据分析公司)和Virgin Atlantic(航空公司)为例,开展了综合考虑航线网络碳排放影响要素的研究,分别计算了机型(Aircraft Model)、航线类型(Flight Type)、飞行距离(Flight Distance)、乘客有效载重量(Passenger and Cargo)、负载系数(Load Factor)/座位占用率(Seat Occupancy Rate)、座位类型(Seat Class)等要素,其研究中既包括与碳排放绝对量相关的要素,也包括与碳排放相对量相关的要素(经济交通指标)。
2.2.2 基于排放率的要素确定
以往占重要地位的碳排放率研究从不同污染物环境损害视角揭示出其主要影响要素。Morrell[20]界定碳排放率(Emission Rate)为燃油产生的每秒碳排放的质量(kg/s),并给出每种污染物的环境损害(货币量/单位重量),进而应用于2类航线网络模式的评估:航空碳排放环境损害Wij为i类航线网络模式下排出的j种污染物的总量(重量或折合的货币量/航班),Wij=tj=tifieij,其中ti是i类航线网络模式的飞行时间(h),fi是i类航线网络模式的燃料溢流(Fuel Flow,kg/h),eij是j种污染物在i类航线网络模式的排放率集合(kg污染物/kg燃料),基此给出第k种飞机/发动机组合的环境损害:
\[D_{ek}=\sum
2_{m=1}\sum
2_{i=1}\sum
2_{j=1}\alpha_iW_{ij}U_j ,\]
式中:m是影响区域类型(城市区或非城市区),α为航班总量,αi为某类航线网络模式中的损害乘数因子(Damage Multiplier Factor),指不同机型碳排放产生的环境损害,Uj是j污染物的单位环境成本(货币量/kg)。碳排放率研究补充了2类航线网络模式环境损害的区域类型要素,其在外部性分析中具有较重要意义。
灵敏度分析方法(Sensitivity Analysis)在有机组合若干主要影响要素的基础上,搭建了环境成本测算关系表,能有效评估指定航线碳排放不同影响要素的环境损害程度。Lu等[21]针对发动机排放的所有污染物的环境损害,选取格拉斯哥(Glasgow International Airport,GLA)—芝加哥(Chicage O Hare International Airport,CHI)航线,采用灵敏度分析评估了城市对的不停飞航线和中心—辐射经停枢纽机场希思罗(London Heathrow Airport,LHR)的停飞航线2类模式下的环境损害。表1显示了该航线两类模式的环境成本测算及其与航班动态变化的关系:假定与机型相关的座位/航班为常数,LTO和扇区巡航阶段CO2环境损害(货币量/人)的指示意义是:因LTO和巡航阶段而显著变化的环境成本可结合航班增减配以机型调整按负载系数测算出来。其研究中还估测,在不经停LHR的城市对航线网络模式下以较大型飞机替代,依据燃油效率相比和乘客平均环境成本相比将保持更大优势。灵敏度分析也证实:飞行操作阶段及其机型选用影响明显。在计算中还引入扇区飞行距离及其相联系的常用巡航高度,因为在较短的扇区飞行距离上常使用较低的巡航高度,爬升起飞阶段(3 000 ft)燃料效率远远小于巡航阶段(30 000 ft)。
表1 GLA-CHI的环境成本测算关系表(据参考文献[11]修改)
Table 1 GLA-CHI environmental cost calculation relationship (modified after reference[11])
| 航线网络类型 | 座位/航班 | 座位总数 | LTO CO2排放成本 /(货币量/天) | 巡航CO2排放成本 /(货币量/天) |
|---|---|---|---|---|
| 城市对 | ||||
| (+) B767-300 | 210 | 210 | 1 240 | 7 000 |
| 净增座位a | 210 | |||
| 中心—辐射b | ||||
| 每日增加3班较大型飞机,GLA-LHR | ||||
| (+) A321-200 | 195 | 585 | +1 936 | +1 282 |
| 每日减少3班较小型飞机 | ||||
| (-) B737-700 | 126 | 378 | -1 345 | -1 039 |
| 净增座位b | 207 | |||
| 每日增加2班较大型飞机,LHR-CHI | ||||
| (+) B747-400 | 392 | 784 | +5 130 | +28 831 |
| 每日减少2班较小型飞机 | ||||
| (-) B777-200 | 300 | 600 | -3 351 | -19 209 |
| 净增座位c | 184 | |||
| 环境总成本净值 | 2 370 | 9 866 |
从以上模型应用及灵敏度分析中可见,枢纽机场H导致环境损害增加的关键点是在LTO与巡航2种飞行操作阶段中碳排放形成的较大差异。以往研究给出了LTO及巡航阶段下碳排放量的计算方法。如Schulte等[22]通过飞机在巡航阶段氮氧化合物的排放指数获得了飞机飞行过程中碳排放量。Kalivoda[23]分目视飞行(依据油耗指数、耗油量及飞行时间)和仪表飞行(依据发动机/飞机组合、航线距离、耗油量及油耗指数)对飞机碳排放量进行了计算。陈林[24]通过飞机巡航阶段的运行状态,并根据ICAO提供的污染物排放系数,进行了相关污染物排放量的测算。以上研究证实:在不同飞行操作阶段和不同扇区飞行距离间燃料消耗很不一致,在整个飞行中爬升和滑行相对产生大量的燃料消耗,LTO阶段碳排放环境损害高于巡航阶段。
Morrell等[11]使用灵敏度分析方法对GLA-CHI 2类航线网络模式的测试结果是:城市对航线不间断飞行航班LTO+巡航排放成本较小(CO2环境成本为8 240货币量/天、环境损害净值为55货币量);中心—辐射航线经停LHR的间接飞行航班LTO+巡航排放成本较大(环境成本为12 235货币量/天、环境损害净值为81货币量),由此将经停航线模式的环境损害增量归因于枢纽LHR的LTO循环(2类航线飞行距离仅相差14%),当该枢纽机场空域繁忙滑行/空转时间延长时,机场跑道容量所限和到达顺序的随机性可能还会带来进一步的额外延误,LHR平均延误率达到26.47%①。
灵敏度分析的特色之一是将机型参数引入到LTO阶段和巡航阶段的碳排放环境损害比较中。Graver等[25]根据不同机型的燃油消耗量统计数据获得了2种状态下的相关参数,又由油耗量及油耗指数计算了飞机LTO阶段和巡航阶段的废气污染物排放量。结合以往研究由多种机型评估的废气污染物排放环境损害分级可见,LTO阶段的地面环境损害均高于LTO前30 min巡航阶段的环境损害,这主要取决于不同飞行高度及速度的油耗指标,在30 min巡航状态下有7种比LTO状态要低,其中环境损害越严重则两者间环境损害差值越明显(表2)。
表2 飞机类型的废气污染物排放环境损害(欧元/航班)(据参考文献[11]修改)
Table 2 Environmental impact of air pollutant emissions from aircraft types €/flight)(modified after reference[11])
| 飞机类型 | 代表机型 | LTO | 分级 | 30 min巡航 | 分级 | LTO+巡航 | 分级 |
|---|---|---|---|---|---|---|---|
| 1 | CRJ | 79 | <100 | 61 | <100 | 140 | 100~200 |
| 2 | B737-700 | 224 | 200~300 | 130 | 100~200 | 354 | 300~400 |
| 3 | A321 | 323 | 300~400 | 160 | 100~200 | 483 | 400~500 |
| 4 | B767-300 | 620 | 600~700 | 263 | 200~300 | 883 | 800~900 |
| 5 | B777-300 | 838 | 800~900 | 335 | 300~400 | 1 173 | 1 100~1 200 |
| 6 | B747-400 | 1 283 | 1 200~1 300 | 503 | >500 | 1 785 | 1 700~1 800 |
| 7 | B747-100/300 | 1 455 | >1400 | 541 | >500 | 1 996 | >1 900 |
| 8 | B727Q | 220 | 200~300 | 234 | 200~300 | 454 | 400~500 |
依据碳中和方法对2种飞行操作阶段下特定机型碳排放环境成本的计算,可进行2类航线网络模式不同飞行距离及机型影响分析。城市对航线网络模式具有长距离飞行的特征,并在很大程度上限制了中短距离航线的应用,其扇区飞行距离往往大于中心—辐射。而中心—辐射航线网络模式解决了经停一个枢纽机场转运旅客实现交通量较小市场的组织问题,给中短途支线飞行网络经转运营带来较大的经济交通量优势,这派生出环境损害的距离分析。Michaelowa[26]、环境问题研究和咨询组织CE Delft[27,28]、英国环境食品和农村事务部(UK Department for Environment, Food and Rural Affairs,DEFRA)[29,30]均划分出短途(Short-haul)、中程(Medium Range)和长途(Long-haul)线路,开展碳排放环境损害与飞行距离关系的评估。
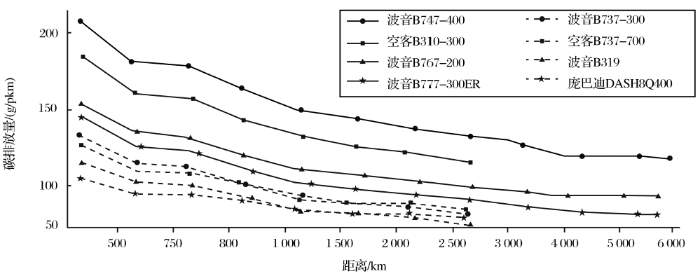
DEFRA使用默认的CO2排放平均因子和平均扇区飞行距离与负载系数,以客每千米(gram per passenger kilometer,pkm)为单位测试了多条国内和国际航线上航空碳排放平均水平(表3),提出飞行碳排放取决于扇区飞行距离的观点。CE Delft使用假设的例子,选取CORINAIR排放清单指南(与DEFRA近似)的燃料消耗数据,计算出多个航班不同距离的碳排放量(表4)。Miyoshi等[18]使用欧洲航空公司(Association of European Airlines,AEA)数据,基于不同机型75%负载系数的假设计算了北大西洋区域航线扇区飞行距离的碳排放水平(图1)。比较3项研究可见:不仅在飞行器燃料效率和操作性能等内在性要素间,而且在不同扇区飞行距离[31]等外部性要素间都非常不同,可从一个视角将碳排放的差异归因于扇区飞行距离以及所选用的飞机类型和负载系数。图1显示了不同机型随距离增加每客千米碳排放降低的态势:短途航班的每客千米碳排放量较高,其LTO阶段的燃料燃烧成为航班整个燃料燃烧较重要的一部分,而长途航班LTO阶段则相对次要,其巡航阶段也是燃料燃烧的主要部分。以上不同距离间碳排放水平的差异主要是通过乘客碳排放负载系数来说明的,实际上航线网络模式碳排放与扇区飞行距离间存在复杂关系[32]。
表3 DEFRA的研究报告(据参考文献[29]修改)
Table 3 The research of DEFRA(modified after reference[29])
| 航线类型 | CO2排放量 /(C g/pkm) | 计算假设 | 平均距离 /km | 路线 |
|---|---|---|---|---|
| 国内 | 158.0 | 65%负载系数78座Dash-8 Q400,139座B737-400 | 463 | 伦敦—苏格兰 |
| 国际短途 | 130.4 | 65%负载系数139座 | 1 108 | 英国—欧洲中部 |
| 国际长途 | 105.6 | 79.7%负载系数 346个座位 B747-400 261个座位 B767-300ER | 6 482 | 英国—美国东海岸 |
表4 CE Delft的研究报告
Table 4 The research of CE Delft
| 航线类型 | CO2/kg | CO2排放量 /(C g/pkm) | 计算假设 | 示例路线 |
|---|---|---|---|---|
| 短途 | 8 024 | 175 | 70%负载系数/150个座位 空客A320 平均距离:480 km | 阿姆斯特丹(AMS)—巴黎 (PAR) |
| 中程 | 15 793 | 107 | 70%负载系数/150个座位 波音737-400 平均距离:1 402 km | 慕尼黑(MUC)—帕尔马(PMF) |
| 长途 | 157 033 | 103 | 70%负载系数/340个座位 波音777 平均距离:6 404 km | 伦敦(LHR)—纽瓦克(EWR) |
图1 各种机型随距离的碳排放变化示意图(据参考文献[18]修改)
Fig.1 Various aircraft models with the distance of carbon emissions(modified after reference[18])
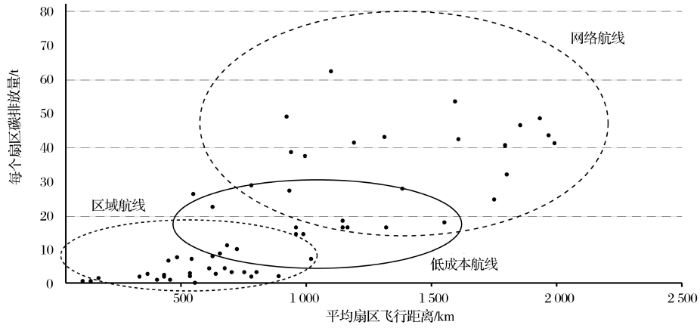
在距离变化影响航空碳排放的分析中,结合航线类型是一种有效方式。Miyoshi等[33]使用2004年AEA数据和2006年英国民航局(UK Civil Aviation Authority,CAA)1 626条国内航线和为英国机场提供服务的欧盟国家内航线的交通流数据,选取客座率排名前20位的航线(平均飞行距离581 km,平均负载系数78%,平均碳排放162 g/pkm)开展了航线类型与碳排放量关系的研究,对比该市场不同航线类型不同飞行距离的平均碳排放量的差异(图2)可见:区域航线和LCC航线(<1 000 km和500~1 500 km)碳排放量低于网络航线(500~2 500 km),其含义是每客千米的碳排放量相对较低,这是由于座位密度和负载系数较高造成的,然而其环境损害被公认是严重的,航空碳排放的环境悖论即源于每客千米的相对指标。
图2 不同航线类型在扇区飞行距离上的平均碳排放(据参考文献[18]修改)
Fig.2 The average carbon emissions of the different airlines at the sector distance(modified after reference[18])
LTO阶段航空碳排放的环境损害,包括向低空[34]排放一氧化碳(CO)、氮氧化物(NO)、碳氢化合物(HC)及烟雾颗粒等物质,均因近离城市区而加重其城市热岛效应,其废气污染物对周围人群造成更直接的影响,Pearce等[35]从不同视角运用ICAO碳排放标准对机场终端区近地空域碳排放量进行了估算,碳排放在城市区和非城市区环境成本的差异如表5所示,体现了大城市机场空域碳排放的环境损害状态。
表5 城市区与非城市区废气污染物的环境影响比较(货币量/单位重量)[35]
Table 5 Environmental impact of exhaust pollutants in different types of region €/kg)[35]
| 污染物 | 平均 | 非城市区 | 城市区 |
|---|---|---|---|
| HC | 4.47 | 2.7~5.0 | 2.7~8.9 |
| CO | 0.08 | 0.01~0.19 | |
| NOx | 10.05 | 4~13 | 7~25 |
| PM | 167.57 | 18~200 | 85~2 000 |
| SO2 | 6.70 | 3.0~8.5 | 3.0~50.0 |
| CO2 | 0.03 | 0.01~0.04 |
(1)基于航空碳排放环境损害模型评估城市对和中心—辐射2类航线网络模式外部性要素是国际减排机制转变的需要;灵敏度分析证实:不停飞航线的城市对模式碳排放环境损害低于经停航线的中心—辐射模式。
(2)采用自上而下分解方法可以搭建一个反映航空碳排放外部性要素的关系框架,包括飞行操作阶段(LTO和巡航)、扇区飞行距离、航线类型、终端区近地空域,以及相关的机型与航空公司类型等;城市对模式的LTO少于中心—辐射模式而飞行距离往往大于中心—辐射模式,其在长距离巡航排放方面显著增益,并表现在航线类型和机场终端区近地空域碳排放环境损害方面。
关于市场化的讨论:航空减排机制的变化带来对中心—辐射航线网络模式的挑战[36],对碳排放外部性要素的重视可能导致航线网络模式向城市对直飞转变,可是网络组织模式主要是在连续需求规模增长的影响下讨论的,向城市对直飞转变的可能性会因成本影响而受到市场需求的限制,客观上环境成本的差异取决于机场腹地人口集中度,客均环境成本由机场区域人口密度及其中心—辐射航线网络模式“绕路”程度决定,故此经济捆绑下的碳排放评估仍不在少数,也使LCC继续成为组织多个O/D市场的常见方式。显然中心—辐射网络模式的环境悖论即源于每客千米的相对指标,但中心—辐射航线网络模式作为客运系统的选择,就碳排放总量规模评估而言是错误的。航空运输业在未来增长的同时需要关注空气安全的维护或确保无空气质量的恶化。
应用展望:新兴经济体持续快速增长的航空需求是碳排放当前面临的主要挑战,我国已成为世界最大的航空碳排放国家[37],2015年11月我国在巴黎气候变化大会上郑重表明发展低碳交通的立场,并于2016年10月签署“ICAO关于环境保护的持续政策和做法的综合声明”。就我国航空网络模式的应用问题,建议:城市对和中心—辐射2类航线网络模式分别由竞争优势较大的国家航空公司和新兴的LCC选择运营,国家航空公司应主要发展直飞运营辅以发展网络运营;在不同的城市对航线网络模式上调整航班密度实施多类型飞机的直飞以产生超值效益;在尚有较大发展空间的航空支线运营中优化不同航线网络模式的机型选配。
The authors have declared that no competing interests exist.
| [1] |
Transport and climate change: A review [J].
Transport accounts for 26% of global CO emissions and is one of the few industrial sectors where emissions are still growing. Car use, road freight and aviation are the principal contributors to greenhouse gas emissions from the transport sector and this review focuses on approaches to reduce emissions from these three problem areas. An assessment of new technologies including alternative transport fuels to break the dependence on petroleum is presented, although it appears that technological innovation is unlikely to be the sole answer to the climate change problem. To achieve a stabilisation of greenhouse gas emissions from transport, behavioural change brought about by policy will also be required. Pressure is growing on policy makers to tackle the issue of climate change with a view to providing sustainable transport. Although, there is a tendency to focus on long-term technological solutions, short-term behavioural change is crucial if the benefits of new technology are to be fully realised.
|
| [2] |
An analysis of the trends of carbon emission intensity and its relationship with economic development for major countries [J].世界主要国家碳排放强度历史变化趋势及相关关系研究 [J].
减少人类活动的温室气体特别是CO2排放量是国际社会已普遍达成共识的应对气候变暖的根本性途径。研究各国经济活动的碳排放强度的变化历史,可以为预测各国未来的碳排放强度趋势、制定未来的碳排放强度降低目标提供科学依据。利用美国橡树岭国家实验室CO2信息分析中心(CDIAC)的CO2排放数据、《世界人口、国内生产总值和人均国内生产总值统计:公元1—2008年》的GDP数据和世界银行第二产业附加值占GDP比重等相关数据,对美国、英国、法国、德国、日本、意大利、加拿大等7个主要工业化发达国家,以及中国、印度、巴西、墨西哥和南非等5个新兴经济体国家的碳排放强度(单位GDP的CO2排放量)变化趋势、人均GDP变化趋势、人均GDP与单位GDP碳排放强度关系、产业结构与单位GDP碳排放强度关系进行了比较分析。结果表明:主要工业化发达国家的碳排放强度随时间变化呈现出先增加后逐渐减小并逐步趋同的态势,主要新兴经济体国家的碳排放强度随时间呈波动性变化;世界主要国家人均GDP总体随时间呈上升趋势,但主要工业化发达国家与新兴经济体国家之间人均GDP差距却逐渐加大;美国、英国、法国、德国和加拿大等少数工业化发达国家人均GDP与单位GDP碳排放强度之间呈倒U型关系,中国人均GDP与单位GDP碳排放强度之间呈N型关系,南非人均GDP与单位GDP碳排放强度之间呈倒N型关系,日本、意大利、印度、巴西和墨西哥人均GDP与单位GDP碳排放强度之间呈倒L型关系;主要工业化发达国家(除加拿大外)第二产业附加值占GDP比重与单位GDP碳排放强度存在正相关关系,而主要新兴经济体国家第二产业附加值占GDP比重与单位GDP碳排放强度之间不存在显著的相关性。
|
| [3] |
The worldwide air transportation network: Anomalous centrality, community structure, and cities’ global roles [J].
We analyze the global structure of the worldwide air transportation network, a critical infrastructure with an enormous impact on local, national, and international economies. We find that the worldwide air transportation network is a scale-free small-world network. In contrast to the prediction of scale-free network models, however, we find that the most connected cities are not necessarily the most central, resulting in anomalous values of the centrality. We demonstrate that these anomalies arise because of the multicommunity structure of the network. We identify the communities in the air transportation network and show that the community structure cannot be explained solely based on geographical constraints and that geopolitical considerations have to be taken into account. We identify each city's global role based on its pattern of intercommunity and intracommunity connections, which enables us to obtain scale-specific representations of the network.
|
| [4] |
Low carbon economy development paths in Beijing-Tianjin-Hebei region under carbon reduction target of absolute constraints [J].碳减排绝对量约束目标下京津冀低碳经济发展路径分析 [J].
分析了影响京津冀地区碳排放的因素,构建了京津冀地区低碳经济发展的系统动力学模型,以2017年碳排放量比2012年减少1.22亿吨为绝对量约束目标进行系统仿真,得到了可行性减排路径,即当2017年京津冀地区实现第一、二、三次产业固定资产投资比例为0.0285:0.2458:0.7257,单位GDP科技投入达到3.125%或者3.145%,生产中煤、石油、天然气、电力及新能源比例为0.5262:0.1759:0.0836:0.2143时或者0.5762:0.1759:0.0836:0.1643时,可完成2017年目标。
|
| [5] |
A note on the competitive advantage of large hub-and-spoke networks [J].
This note explores the extent to which airlines operating large hub-and-spoke networks secure a competitive advantage. More specifically, this paper explores the intricate relationship which arises among productive efficiencies and profitability when the size of the hub-and-spoke network expands. To this end, Brueckner and Spiller (1991, International Journal of Industrial Organization 9, 323-342) airline economics model is generalized by allowing the size of the hub-and-spoke network to vary. The central result shows that, although the model exhibits decreasing returns to firm/network size (RTNS), nonetheless there is a competitive advantage to increasing the size of a network.
|
| [6] |
The geography of deregulation in the US airline industry [J].
The U.S. domestic airline industry was deregulated in 1978 as part of a regulatory reform movement that has transformed the banking, telecommunications, energy, and transportation industries. A geography of deregulation has emerged conforming to a core-periphery structure in which industries are increasingly controlled by fewer firms through their major headquarters and operations centers. As a consequence of industry consolidation and the shift to "hub-and-spoke" network service structures, strong domestic "hubs" (e.g., Dallas, Chicago, Atlanta) and international gateway cities (e.g., Los Angeles, New York, San Francisco) have emerged as the core control centers of the air-transport system, while "spoke" cities have become peripheralized in the process. The group of core centers has benefited more than the periphery from increased air transportation employment, frequency of service, passenger flow, and lower fares, except in cases where hubs were dominated by one or two airlines, where fares rose. The latter is manifested in a pattern of higher fares in the more concentrated hubs of the southeastern U.S. and their peripheral hinterlands.
|
| [7] |
An appraisal of the use of airline data in assessing the world city network: A research note on data [J].
Information on air passenger flows is potentially a prime data source for assessing spatial patterns in the world city network, but previous analyses of this issue have been hampered by inadequate and/or partial data. The ensuing analytical deficiencies have reduced the overall value of these analyses. Therefore, this paper examines how some of these deficiencies might be rectified. First, it reviews the rationale for using airline data to analyse the world city network. Secondly, it assesses the problems encountered by previous research. The third section elaborates on the construction of a global intercity matrix based on the so-called Marketing Information Data Transfer database and explains how this matrix can circumvent some previously identified problems.
|
| [8] |
An analysis of European low-cost airlines and their networks [J].
The growth of low-cost carriers (LCCs) is currently focused on the Western European market, where they represent the most determining factor in the evolution of airline networks. In this area, they stand for 18% of the total air transport supply according to seats. Limited to short and medium haul flights, networks are not too concentrated (no hubs). They are North–South, and compete with—when they have not replaced—some charter routes. The use of air freedoms beyond the fourth is still limited, but exclusive routes are a frequent phenomenon linked to the option for secondary (urban or regional) airports and/or niches. Finally, low-cost carriers give fresh impetus to point-to-point routes by drawing new networks complementing those of full service network carriers (FSNCs). If no hubs as such can be found in these new networks, significant concentrations characterize the major bases. The geography of low-cost networks is to a large extent the geography of EU air transport liberalization.
|
| [9] |
Design method, application and time alternative mechanism of flexible use of airspace [J].灵活空域使用的设计方法与应用及其时间替代机制 [J].
灵活空域使用以及实践已成为美国新一代航空运输体系的关键组成部分,同时也成为欧洲和日本等国家空域重构的重要技术支撑。在全面认知与回顾灵活空域使用的产生、实施与目标的基础上,对扇区边界更改的设计方法进行了优势评估;然后从“扇区拆合”视角分析了扇区边界更改的效果;由此解释了灵活空域使用的时间替代机制。研究认为,“算法+人工动态扇区边界更改”能更好地分配和平衡跨扇区的非均衡变化,促进空域资源开发和空域容量释放;建立在信息通信技术支持下的灵活空域使用实现了时间因素对空间利用的替代,能最大限度地提高空域重构和航线改变的灵活性。灵活空域使用方法及其应用不仅可以服务于我国国家空域系统整体战略的制定,也有助于推动地理学关于空域资源开发利用研究及其空陆对接研究。
|
| [10] |
Study on the linking of China’s emissions trading pilot schemes [J].中国碳排放权交易试点体系的连接可行性分析 [J]. |
| [11] |
The environmental cost implication of hub-hub versus hub by-pass flight networks [J].
Increasing congestion at major hubs and the advantage to passengers of non-stop flights and faster journey times has intensified the debate on patterns of air service. At the same time the economics of highly focused networks has been challenged by the availability of very economic smaller capacity long-haul aircraft. The purpose of this research is to value the environmental costs of these two patterns of service: hub-to-hub and hub by-pass. Five long-haul markets were evaluated both on a hub to hub and hub by-pass basis. These involved both transatlantic and Europe/Asia flights. It was found that the noise and emissions social cost impact of the hub by-pass networks was significantly lower than the hub to hub in all cases. Differences in environmental costs per passenger depend on the concentration of population around the airports and the degree to which the hub routing involves extra mileage.
|
| [12] |
Transport and climate change: Simulating the options for carbon reduction in London [J].
Transport is a major user of carbon-based fuels, and it is increasingly being highlighted as the sector which contributes least to CO 2 emission reduction targets. This paper reports on the findings of the VIBAT London study ( www.vibat.org) which considers the role of the transport sector in reducing CO 2 emissions in London. The analysis develops a transport and carbon simulation model (TC-SIM) for London. Within this, users are able to consider the implementation of a series of potential policy packages—low emission vehicles, alternative fuels, pricing regimes, public transport, walking and cycling, strategic and local urban planning, information and communication technologies, smarter choices, ecological driving and slower speeds, long distance travel substitution, freight transport and international air. They can select variable levels of application to help achieve headline CO 2 emission reduction targets. The roles of carbon rationing and oil prices are also considered. TC-SIM can be played in different user modes: as ‘free riders’, ‘techno-optimists’, ‘enviro-optimists’, ‘complacent car addicts’ and other typical travel market segments, including a ‘free role’. Game playing or scenario testing such as this helps to highlight perceived levels of homogeneity of views within certain cohorts, the development of entrenched positions and the likely success in achieving objectives. The paper develops various policy packages, scenarios and pathways aimed at reducing transport CO 2 emissions. It argues that strategic CO 2 emission reduction targets are very ambitious relative to current progress, and that we need to act more effectively across a wide range of policy mechanisms, with a ‘high intensity application’ of many of the options, to get near to achieving these targets. A critical issue here will be in communicating and gaining greater ‘ownership’ of future lifestyle choices with stakeholders and the public, and participation tools such as TC-SIM could become increasingly important in this area.
|
| [13] |
Knowledge visualization and dynamics of foreign transport geography research [J].国外交通地理学研究的知识图谱与进展 [J]. |
| [14] |
Networking policies for hub-and-spoke systems with application to the air transportation system [J]. |
| [15] |
A geographer’s analysis of hub-and-spoke networks [J].
INTERACTIONS BETWEEN 100 U.S. CITY PAIRS, WITH SPECIAL ATTENTION TO CONTRAST BETWEEN AIR PASSENGER AND AIR EXPRESS FREIGHT APPLICATIONS.
|
| [16] |
The growth limits of the low cost carrier model [J].
Today, many low cost carriers (LCCs) continue to enjoy rapid growth and still have a fair number of new aircraft on order. There are signs however that the market for LCCs is limited, owing to increasing route density problems, primarily in Europe but seemingly also in North America: the fact that average frequencies have decreased and average route distances increased since 2001 indicate that LCCs are increasingly operating in exceedingly thinner niche markets. This perhaps explains why LCCs have been trying to adapt their business strategies to assure future growth by shifting to primary airports, facilitating transfers, engaging in codesharing, entering alliances, and acquiring other airlines. This paper identifies the possible factors limiting the LCC model's growth and explains how the largest LCCs in Europe and the US have subsequently reacted.
|
| [17] |
Determination and applications of environmental costs at different sized airports-aircraft noise and engine emissions [J].
With the increasing trend of charging for externalities and the aim of encouraging the sustainable development of the air transport industry, there is a need to evaluate the social costs of these undesirable side effects, mainly aircraft noise and engine emissions, for different airports. The aircraft noise and engine emissions social costs are calculated in monetary terms for five different sized airports, ranging from hub airports to small regional airports. The number of residences within different levels of airport noise contours and the aircraft noise classifications are the main determinants for accessing aircraft noise social costs. The environmental impacts of aircraft engine emissions include both aircraft landing and take-off and 30-minute cruise. The social costs of aircraft emissions vary by engine type and aircraft category, depending on the damage caused by different engine pollutants on the human health, vegetation, materials, aquatic ecosystem and climate. The results indicate that the relationship appears to be curvilinear between environmental costs and the traffic volume of an airport. The results and methodology of environmental cost calculation could be applied to the proposed European wide harmonised noise charges as well as the social cost benefit analysis of airports.
|
| [18] |
The carbon emissions of selected airlines and aircraft types in three geographic markets [J].
Various carbon calculators developed by airlines and carbon offset companies have become available since the environmental impact of the air transport industry started to receive strong attention. This paper details a prototype methodology for carbon calculation emission levels in the three air transport markets; the UK domestic routes, the intra-EU routes serving UK and the North Atlantic routes that enables the assessment of key environmental performance differences between air carriers whereas they would be measured as identical using the often used DEFRA-type measurement approach. The results show differences in airlines' strategies such as aircraft type used, load factors and seat configurations.
|
| [19] |
Carbon Offsetting & Air Travel, Part 1: CO2-Emissions Calculations[R]. |
| [20] |
The potential for European aviation CO2 emissions reduction through the use of larger jet aircraft [J].
There is increasing pressure to reduce global CO 2 emissions, with aviation targeted as an industry with high future expected growth and limited potential for reduced emissions. In Europe, air transport is likely to be included in the Emissions Trading Scheme from 2012, allowing open trading with other sectors. The proposed scheme may be economically efficient but will it do much towards curbing aviation emissions? A number of papers have looked at the ETS impact on air traffic growth rates, and others have forecast the rate of likely future fuel efficiency gains. This paper examines the potential for greater fuel efficiency through the use of larger aircraft and different patterns of operation. Fuel efficiency was found to be related to aircraft size with more benefit from trading up with short/medium-haul than with long-haul aircraft. This relationship only held for long-haul aircraft if those aircraft with two main decks were removed from the sample (these types showing inherently lower fuel efficiency). Combining these findings with manufacturers' and other forecasts of average aircraft size suggests that less than 1% a year of fuel efficiency gains will be available from this source over the next 20 years.
|
| [21] |
Evaluation and implications of environmental charges on commercial flights [J].
Environmental charges are one of the economic instruments for controlling externalities. Their application to commercial flights has become a preferred method of encouraging the sustainable development of the air transport industry. Two kinds of externalities, aircraft noise and engine emissions, both generating profound impacts on human beings and on the environment, are considered here. The hedonic price method is applied to calculate the social cost of aircraft noise during the landing and take-off stages of the flight. The marginal impact of each flight with specific aircraft/engine combinations is derived for the allocation of aggregate noise social costs. In contrast, the dose - response method is applied to estimate the social cost of each engine exhaust pollutant during different flight modes. The combination of aircraft noise and engine emissions social costs is then evaluated on the basis of several environmental charge mechanism scenarios, using Amsterdam Airport Schiphol as a case study. It is shown that the current noise or engine emissions related charges at airports are lower than the actual social costs of their respective externalities. The implications of charge mechanism scenarios are subsequently discussed and evaluated in terms of their impacts on airline costs, airfares and passenger demand.
|
| [22] |
NOx emission indices of subsonic long-range jet aircraft at cruise altitude: In situ measurements and predictions [J].
In the course of the Commissions of the European Communities project 090008Pollution From Aircraft Emissions in the North Atlantic Flight Corridor (POLINAT)090009, in situ measurements of NO, NOx, and CO2 volume mixing ratios in the near-field exhaust plumes of seven subsonic long-range jet aircraft have been carried out by using the research aircraft Falcon of the Deutsche Forschungsanstalt f0104r Luft- und Raumfahrt (DLR). For three additional aircraft, only NO and CO2 were measured. Plume ages of 50 s to 150 s have been covered, with maximum observed exhaust gas enhancements of 319 parts per billion by volume and 51 parts per million by volume for 0200[NOx] and 0200[CO2], respectively, in relation to ambient values. Aircraft cruising altitudes and Mach numbers ranged from 9.1 to 11.3 km and from 0.77 to 0.85, respectively. These measurements are used to derive NOx emission indices for seven of the individual aircraft/engine combinations. The NOx emission indices derived range from 12.3 g/kg to 30.4 g/kg. They are compared with predicted emission index values, calculated for the same aircraft engine and the actual conditions by using two newly developed fuel flow correlation methods. The calculated emission indices were mostly within or close to the error limits of the measured values. On average, the predictions from both methods were 12% lower than the measured values, with an observed maximum deviation of 25%. The ratio =[NO2]/[NOx] found during the present measurements ranged from 0.06 to 0.11 for five daytime cases and was around 0.22 for two nighttime cases. By use of a simple box model of the plume chemistry and dilution these data were used to estimate the initial value 0 present at the engine exit plane. We found 0 values between 0 and 0.15. These were applied to estimate the corresponding NO2 for the three cases in which only NO was measured.
|
| [23] |
Development of a comprehensive methodology for estimating air pollutant emissions from air traffic within the MEET project [J].
development of a comprehensive methodology for estimating air pollutant emissions from air traffic within the meet project of atmosphere and on the world's climate are still unknown. International studies on the middle- an
|
| [24] |
Measurement and forecast of the emissions from Chinese air transportation LTO and cruise phases [J].我国航空运输LTO阶段和巡航阶段排放量测算与预测 [J].
利用国际民航组织的发动机排放数据库和我国航空运输的生产数据,测算2011—2016年我国航空运输在LTO阶段和巡航阶段各种污染物的排放量。同时,针对典型机型、典型机场和典型航线进行相关污染物排放量的测算。研究方法和研究结论对于测算和治理我国航空运输排放产生的环境外部成本具有重要意义。
|
| [25] |
Estimation of air carrier emissions at Raleigh-Durham International airport [ |
| [26] |
Impact of interest groups on EU climate policy [J]. |
| [27] |
Giving Wings to Emissions Trading [R]. |
| [28] |
Allocation of Allowances for Aviation in the EUETS: The Impact on the Profitability of the Aviation Sector Under High Levels of Auctioning[R]. |
| [29] |
Passenger Transport Emissions Factors, Methodology Paper DEFRA[R]. London: Department for Environment Food and |
| [30] |
Act on CO2calculator: Public Trial Version Data, Methodology and Assumptions Paper[R]. |
| [31] |
The application of ICTs in airspace management and collaborative decision-making—Analyzing the risk avoidance in the condition of risky weather as an example [J].信息通信技术在空域协同管理决策中的应用——以危险天气条件下风险规避分析为例 [J].
信息通信技术的应用使空域资源充分开发和有效利用发生了结构性变革,新一代航空运输体系提出应用全新自动化信息支持交通管制决策的概念,由此学界和业界在空中交通管制员工作站业务中积极开发集成了自动信息决策支持工具,以此改变以往空中交通管制员手动集成与决策过程。空域危险天气条件下空中交通安全保障能力降低,对空域系统产生危害,因而对新的信息通信技术的需求迫切。在概述新一代航空运输体系的信息化组成与支持的基础上,并在回顾空域协同决策技术发展及危险天气规避研究的基础上,通过危险天气条件下空域协同管理决策的应用论证信息通信技术支持的新特点,包括基础应用:空域协同管理决策的数据输入—航线输出;普遍应用:风险规避一般概率网的选择;特殊应用:由位置与方向组成的航线管理。研究认为,建立在信息通信技术基础上的空域协同管理决策具有精准的时间计划特征,并通过时间精准实现空间精准;基于地理信息系统技术的空域协同管理决策的可视化,实现了移动数据的飞行轨迹地图快速生成。这项研究对未来国家空域资源充分开发利用、危险天气条件下保证飞行安全、降低空中交通管制员工作负荷等均有一定的应用价值。
|
| [32] |
The theoretical sources, innovation of methodologies and practice of the exploitation and utilization of airspace in western countries [J].国外空域资源开发利用的理论基础、方法论变革与实践 [J]. |
| [33] |
The damage cost of carbon dioxide emissions produced by passengers on airport surface access:The case of Manchester Airport [J].
The present paper estimates the carbon footprints of passengers on airport surface access and identifies the users who produce larger emissions using Manchester Airport as a case study. The quantified results demonstrate the higher CO 2 emissions and the greater cost of damage caused by carbon of private modes such as ‘drop off and pick up’ and ‘minicab’ users. A large opportunity to reduce CO 2 emissions is identified by thus decreasing ‘drop off and pick up’ users. The total cost of the damage caused by CO 2 produced by passengers’ surface access is estimated to be approximately 0510.902million at 2009 prices. An economic instrument to charge higher cost users could be implemented, however, the trade-off between private benefit and total costs should be evaluated in order to maintain competitive advantage.
|
| [34] |
Rules and methods of UAV activities’ aerial lanes design for (ultra) low airspace in regional areas [J].城市区域(超)低空空域无人机活动通道划设规则与方法 [J].
(超)低空空域已成为空域资源充分开发利用的重要组成部分并得到各国广泛关注,无人机活动是其重要形式并显现出巨大的社会经济前景。首先分析了(超)低空空域资源开发利用的时代背景和城市区域(超)低空空域无人机活动面临的挑战,并综述了国内外无人机活动的法律体系保障和通道划设研究进展;其次归纳总结了城市区域(超)低空空域无人机活动高度—密度规则、覆盖区规则和隔离区规则的存在形式及其优化方案;最后在构建无人机(群)空中网络的基础上,针对不同无人机活动类型对空中通道的需求,展望了从3D城市模型基础方法到最优函数地图方法的演进。研究认为:无人机活动通道划设中既包括高度—密度一般规则,也包括覆盖区、隔离区特殊规则,在3D城市模型基础上应用最优函数地图方法有助于最优活动通道的选择;依据城市区域地面建筑与居民实际情况确立的通道划设规则与方法对于(超)低空空域资源开发以及协调空地矛盾,乃至国家空域系统的实施都具有重要作用。
|
| [35] |
Setting Environmental Taxes for Aircraft:A Case Study of the UK [M]. |
| [36] |
Cost economics of aircraft size [J].
The authors study the relationship between aircraft cost and size for large commercial passenger jets. Based on a translog model, they develop an econometric cost function for aircraft operating cost and find that economies of aircraft size and stage length exist at the sample mean of their data set, and that for any given stage length there is an optimal size, which increases with stage length. The scale properties of the cost function are changed considerably if pilot unit cost is treated as endogenous, since it is correlated with size. The cost-minimising aircraft size is therefore considerably smaller, particularly at short stage lengths, when pilot cost is treated as endogenous, and this helps to explain why US airlines expect to accommodate future traffic growth with more flights instead of larger planes.
|
| [37] |
Comparative study of the carbon emission situation and goals between China and India [J].中印两国碳排放形势及目标比较研究 [J].
中印两国作为两大发展中国家和人口大国,面临着发展经济和应对气候变化的双重挑战,两国均在积极开展碳减排,印度还承受着“被对标”中国的压力。以中印两国为对照分析样本,以长序列统计值为基础分析数据,在详细分析比较碳排放历程的基础上,从经济发展情况、能源储量及消费情况等多个维度对比分析两国碳排放面临的形势,围绕中印两国的碳减排目标,测算和比较了目标实现后的碳排放强度和能源结构。比较结果表明:中国碳排放总量大于印度,但排放总量增速、人均排放增速均明显低于印度,碳排放强度下降速度明显快于印度;中国承诺的碳减排的努力大于印度。但随着印度能源结构的不断调整,将逐步优于中国。
|

/
| 〈 |
|
〉 |
