


1 引言
巽他群岛是东南亚马来群岛偏西的一部分,后者则是世界上最大的岛群,位于热带太平洋与印度洋之间的辽阔海域上,属于热带雨林气候和热带季风气候。独特的气候和环境使该地区与南美洲的亚马逊河流域和非洲的刚果河流域共同构成了地球上陆地生物量和生物多样性最大也最丰富的地区[1],一直吸引着生物学和地学等很多分支领域学者的关注。
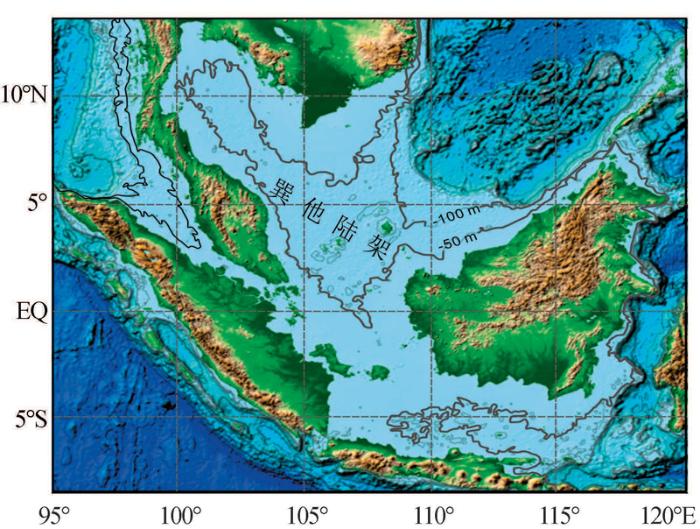
位于巽他群岛之间的是世界上最宽广的大陆架之一——巽他陆架。该陆架平均水深小于100 m,面积约185万km2,与该区域现今的陆地面积接近(图1)。在冰期—间冰期海平面变化最大超过120 m的情况下,冰期出露的陆架将附近岛屿连为一体,形成了一个面积增加了1倍的整块陆域[2,3]。这种在万年时间尺度上周期性巨变的地形地貌完全不同于相对稳定的亚马逊流域和刚果河流域。由于热带森林有着巨大的陆地生物量,具有显著的生态功能和碳循环意义,上述变化有可能对区域乃至全球的气候和生态系统变化及碳循环带来深远的影响。但是有关该区域在冰期的气候与陆地植被状况的研究还比较薄弱,空白研究区域较大,观点尚不一致。这方面的研究进展和评述在本专栏其他文章中已有详细论述,在此不拟赘述。本文仅针对巽他地区陆地生物量在冰期旋回中的可能变化及其碳循环意义进行评述和研究展望。
图1
2 冰期旋回中陆地生物圈的作用
冰期—间冰期碳循环中一个最明显、约束量最准确的特征是大气CO2含量的周期性波动。即在过去80万年里,大气CO2含量在170×10-6~300 ×10-6范围内波动,分别对应于冰期和间冰期的情况[4,5]。以末次盛冰期至工业革命前的全新世为例,大气CO2含量上升了约100×10-6,相当于大气碳储库增加了约194 Pg C (1 Pg = 1015g) (表1)。然而,由于间冰期大气碳储库(593 Pg C)只相当于海洋碳储库约1/60的储量和陆地生物圈碳储库约1/7的储量[6],大气中这一看似显著的变化在整个地球表层系统的碳循环中实际上是比较微弱的。再加上目前最新的海洋和陆地生物圈碳储库估算量的不确定值都在170~400 Pg C范围内[6](表1),与冰消期大气碳储库的增加量相当,因而准确分析大气CO2变化的详细过程非常困难,这已成为多年来地球科学领域的一个焦点问题。
表1 全新世(工业革命前)与末次盛冰期地球表层系统碳储量的比较 (据参考文献[6]修改)
Table 1
| 时代 | 碳储量/Pg C | ||
|---|---|---|---|
| 陆地生物圈 | 海洋 | 大气 | |
| 全新世(工业革命前) | 3 970±325 | 36 830±170 | 593±2 |
| 末次盛冰期 | 3 640±400 | 37 350±400 | 399±2 |
冰消期大气碳储库的增加应该来自与之有快速交换的陆地和海洋碳储库的净释放。对于陆地生物圈,20世纪90年代已有十几个基于模拟和研究数据得出的末次盛冰期与全新世(工业革命前)碳储量的比较,发现的碳储库变化(全新世—盛冰期)范围很大,为-31~1 900 Pg C,但可信范围被认为介于270~1 100 Pg C[7]。这样一个变化范围显然太大,远大于大气的碳储量变化。而海洋碳同位素数据的引入可进一步限定上述变化范围,这是因为海洋碳储库的δ13C在冰期比全新世降低约0.3‰,是陆地生物圈的碳(通过大气)向海洋转移的结果[8]。这样就使得上述陆地碳储库的变化范围进一步收窄为270~720 Pg C[6,8,9]。因此,尽管对冰消期陆地生物圈碳储量变化的估算仍然存在很大偏差,但定性来讲,全球陆地生物圈的碳储量是随着冰消期的发展而增加的,是大气CO2的汇。也就是说,冰消期大气CO2升高的源头不在陆地生物圈而在海洋碳储库。同理,冰期大气CO2降低的主因也在海洋而不是陆地。然而,这并不意味着陆地生物圈对冰期—间冰期碳循环不重要。由于冰消期陆地生物圈碳储库是增加的,而其增加的直接供应储库是大气,因此也就意味着冰消期海洋碳储库向大气的转移量远大于从冰芯记录计算得出的大气碳储库的增加量。因此,从地球表层系统碳循环的角度来看,只有把陆地生物圈碳储量变化的定量数据不断向精准化推进,才能真正了解全球碳循环的详细过程与机制,为精细地定量分析大气CO2变化提供科学基础。
3 冰期与间冰期陆地生物圈的差异
对陆地生物圈的不同模拟表明,全新世陆地生态系统的净初级生产力(NPP)为46~78 Pg C/a[10~12], 而在末次盛冰期NPP的减少约为全新世的2/3[13~15]。冰芯气泡中O2的δ18O测定为计算大气的Dole效应,并进而计算陆地生态系统的NPP提供了新手段,由此计算出的盛冰期陆地生物圈NPP则减少为全新世的一半[6]。而陆地生物圈的碳储量在盛冰期并未同比例减少,只减少不到1/5,甚至不到1/10[6,8,9]。这样的结果表明,相对于间冰期,冰期的陆地生物圈具有产率低而储量相对高的特点。Ciais 等[6]认为导致上述生物圈特点的主要原因可能是多年冻土、泥炭地及寒带寒温带生态系统等这些持有较多土壤有机碳的生态区在冰期从高纬度地区向低纬度地区扩张,并模拟出了上述情况。同时发现,末次盛冰期处于冻土带的不参与碳循环的“惰性”有机碳储量要比全新世高出700 Pg;而他们的研究得出末次盛冰期陆地生物圈总碳储量只减少330 Pg,为此需要陆地生物圈的“活性”碳部分至少在盛冰期减少1 030 Pg[6]。
图2
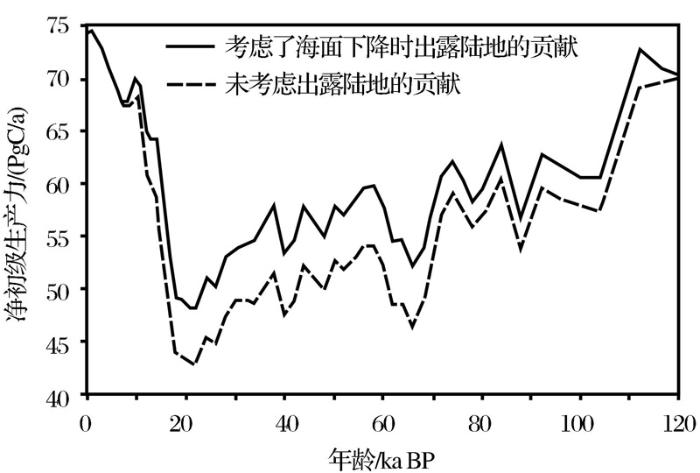
图2 由Biome4模型重建的末次冰期旋回中的陆地净初级生产力变化(据参考文献[15]修改)
Fig 2 Net primary production throughout the last glacial cycle derived from the Biome4 model-based reconstructions (modified after reference[15])
4 冰期旋回中巽他地区陆地碳储量的变化及其意义
模拟表明,在全新世地球的热带森林面积为2.3×10⁷ km2,约占陆地生态系统总面积的16.8%;而热带森林的植被储碳量约占陆地生态系统总储碳量的1/2(45.7%),若包括土壤有机碳蓄积量则占到25.0%[17]。可见热带森林生态系统对陆地碳储库的贡献大大超过其土地面积所占的比例,因而在陆地生物圈碳循环过程中是不可忽视的。在冰期,北极冰盖扩张占据了大片高纬度陆地区域,但同时由于海平面下降而暴露出中低纬度的浅海陆架,这使得无冰覆盖的陆地面积并未显著减少[17]。那时,热带森林尽管面积有所萎缩,但其储碳量在陆地生物圈中的地位更加突出:占总生物量储碳的63.5%,占生物量加土壤储碳的29.7%[17]。但是,上述对冰期陆地生物群区的模拟中存在大量不确定的区域,以孢粉为主的证据记录在全球的分布和密度也很不均匀,穿越赤道的热带地区仅在亚马逊河流域分布密度较高[17,18]。
在全新世热带森林中,亚马逊河流域占据了一半的碳储量,西非刚果河流域和东南亚地区各占约1/4[1]。其中,东南亚地区的热带森林面积最小,只分别相当于亚马逊流域和刚果河流域森林面积的1/3和2/3,显示出东南亚热带森林的高碳密度特征[1]。亚马逊河和刚果河流域的热带森林由于受冰期气候和低CO2的影响,其面积有显著萎缩[18]。而海平面变化对这2个地区的陆地面积影响不大[17]。相反,东南亚地区由于冰期巽他陆架的大面积出露(可达185万km2)而显著增加了陆域面积。尽管这一增加的陆域面积只占冰期总陆域面积(13 200万km2)的1.5%[17],但出露陆架上的植被状况对陆地生物圈的碳储量估算会产生重要的影响。若陆架上覆盖的是热带森林,以冰期热带森林13.6 kg C/m2的平均密度来算[17],相当于增加了25.3 Pg C储量,增加量占冰期陆地植被总碳储量的6.2%。这样,在冰期东南亚热带森林区的碳储量会与南美的亚马逊流域十分接近,有可能成为地球的第二个“肺”。若出露陆架上呈现的是草原景观,由于其碳密度仅为森林密度的1/10,则其储碳的全球意义就会大打折扣。
由于温度较高,有机碳降解速率较快,热带森林土壤的储碳量相对偏低,不是陆地生物圈碳储库的关键所在。但是,在热带一个尚未十分准确定量的储碳单元是泥炭地。热带雨林的泥炭地以其含碳量高(如加里曼丹岛的泥炭的碳百分含量可高达约50%)、埋藏深(超过10 m)、年代久(可达末次盛冰期)等特征而成为十分重要的碳储库。热带泥炭地的形成与气候、水文和地形地貌等环境因素有关,降水丰沛和地下水水力梯度小的积水低缓地形是形成热带泥炭的有利条件。在全新世,巽他诸岛的沿海低地及少量内陆低地的泥炭地处于持续发育状态,积累的有机碳成为大气不可忽视的碳汇[19]。据统计,这一区域的泥炭地面积约为25万km2,分别占全球热带泥炭面积和全球总泥炭面积的56%和6%;而其储碳量可达68.5 Pg,分别占热带和全球泥炭储碳量的77%和11%~14%[20]。当然,不同研究者的估算结果存在很大差别,也有低于上述储碳量的结果,如23.1~33.3 Pg C[19]。其储碳量仍与本地区热带森林的储碳量相当,而其面积则不足后者的1/10。调查表明,上述泥炭地基底年龄不超过末次盛冰期,其原因可能与气候变干和或由于海平面大幅下降所导致的地下水水力梯度变陡和水位下降有关[19]。该区域冰期的气候是否显著变干尚存在不同观点[19,21,22],但目前位于海岸附近的泥炭地在冰期低海平面情况下消失是有可能的,因为在当时这些地区的地下水水力梯度会变陡,水位会下降。但是,泥炭地的发育是否迁移到了出露的低缓的巽他陆架之上?是否能成为不可忽视的碳储库?这部分的证据十分有限。有学者推测,出露的低缓陆架会导致水流滞缓,有利于大面积泥炭地的形成[23,24]。然而,冰期陆架上的深切河谷(可达40 m)[25,26]会导致较大的水力坡度,陆架上还存在粗粒沉积物的分布[22,24],这些都暗示当时的泥炭地即使存在也可能是斑块状不连续分布的。此外,在靠近陆架的海洋沉积物中的红树林记录能证明应该存在海岸红树林泥炭地[21,27]。总之,关于陆架上泥炭地的存在与分布尚需进一步的其他有关记录和指标进行揭示。
图3
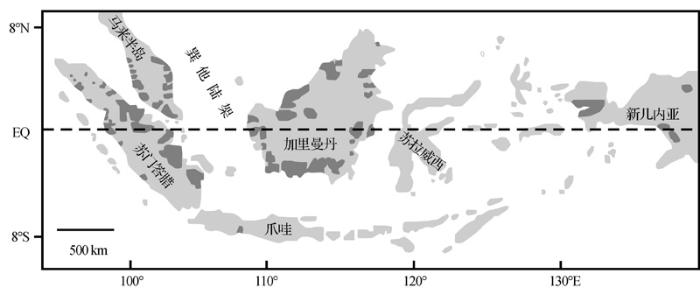
图3
马来群岛地区泥炭地(图中深灰色区域)的分布(来源:
Fig 3
Peat land (dark gray) distribution on the Malay Islands (Source:
最后,还有一个问题是,冰期出露陆架上的陆地生态系统(包括土壤和泥炭)所蓄积的碳,在冰消期海平面迅速上升的过程中及达到最高海平面后,是被有效封存于海洋沉积之下(中),从而成为一个“永久”的碳汇;还是被大量氧化降解释放到大气—海洋系统之中继续参与地表的碳循环过程?从更长时间尺度来看,本地区实际上存在丰富的新生代煤层沉积,其形成环境被认为与现今的热带泥炭十分接近[28],是地质历史上的重要碳汇,因此泥炭被保存和封存于沉积物中是有可能的。但在冰期旋回的陆地生物圈碳循环模型中,冰期出露的陆架上生态系统的碳在冰消期被设定为返回大气系统[7]。这样一个设定尚无法证明其合理性。通过钻探获取陆架沉积序列,辨别和分析可能的陆相沉积(湖泊、泥炭、古土壤等)并定量分析有机碳的来源也许能进一步明晰这个问题。
5 结语
参考文献
Benchmark map of forest carbon stocks in tropical regions across three continents
[J].
Developing countries are required to produce robust estimates of forest carbon stocks for successful implementation of climate change mitigation policies related to reducing emissions from deforestation and degradation (REDD). Here we present a “benchmark” map of biomass carbon stocks over 2.5 billion ha of forests on three continents, encompassing all tropical forests, for the early 2000s, which will be invaluable for REDD assessments at both project and national scales. We mapped the total carbon stock in live biomass (above- and belowground), using a combination of data from 4,079 in situ inventory plots and satellite light detection and ranging (Lidar) samples of forest structure to estimate carbon storage, plus optical and microwave imagery (1-km resolution) to extrapolate over the landscape. The total biomass carbon stock of forests in the study region is estimated to be 247 Gt C, with 193 Gt C stored aboveground and 54 Gt C stored belowground in roots. Forests in Latin America, sub-Saharan Africa, and Southeast Asia accounted for 49%, 25%, and 26% of the total stock, respectively. By analyzing the errors propagated through the estimation process, uncertainty at the pixel level (100 ha) ranged from ±6% to ±53%, but was constrained at the typical project (10,000 ha) and national (>1,000,000 ha) scales at ca. ±5% and ca. ±1%, respectively. The benchmark map illustrates regional patterns and provides methodologically comparable estimates of carbon stocks for 75 developing countries where previous assessments were either poor or incomplete.
Depositional sequences on a late Pleistocene-Holocene tropical siliciclastic shelf (Sunda Shelf, southeast Asia)
[J].This study describes, and reviews, the stratigraphic architecture of the world's largest but least known tropical siliciclastic shelf using the sequence-stratigraphic concept. The Sunda Shelf provides conditions particularly suited for reconstructing its depositional history due to a low gradient and extreme width, the presence of huge paleo-valley systems and abundant filled channels, tectonic stability during the Quaternary, and high sediment input due to a large catchment area. We investigated the subsurface along the most prominent paleo-valley by shallow-seismic surveying and 36 gravity cores controlled by 80 radiocarbon dates.The deposits during sea-level fall prior to the last glacial maximum lowstand and the subsequent deglacial rise correspond to four systems tracts: (a) wide, partly detached prograding deltaic clinoforms indicate forced regression related to a regressive systems tract; (b) sparse shoreline deposits and widespread soil formation refer to a lowstand systems tract; (c) rapidly backstepping coastline-related deposits form a confined transgressive systems tract without stacking patterns and are mainly restricted to the paleo-valley system; (d) a thin marine mud cover extends as a condensed section over the whole shelf area (the base of a highstand systems tract).The stratigraphic architecture on the central Sunda Shelf strata over the past 50,000 years is the result of the interplay of three major factors: (1) rapid sea-level changes, (2) locally pronounced physiography and (3) changes in sediment supply that determined the distribution and accumulation pattern.
Termination of the Last Glacial Maximum sea-level lowstand: The Sunda-Shelf data revisited
[J].The modelled sea-level history is, thus, supported with respect to an initial high-glacial lowstand prior to the LGM, which might be in apparent contrast to observations from Bonaparte. Nevertheless, field data suggest a glacial sea-level evolution about 10m deeper than the model. Also, the gradual rising trend from 26 to 16cal kyr BP, as deduced from the model, can definitively not be approved by any field data. However, our knowledge is still unsatisfactory and an expansion of field data from suited areas is urgently needed.
Climate and atmospheric history of the past 420 000 years from the Vostok ice core, Antarctica
[J].Presents research which studied the ice record at the Vostok station in East Antarctica. Evidence for atmospheric composition and climate for the past four glacial-interglacial cycles; Succession of changes between cycles; Oscillation of atmospheric and climate properties; Differences between periods for temporal evolution and duration; Concentrations of carbon dioxide and methane in the cycles. INSET: Box 1 The Vostok glaciological timescale.
High-resolution carbon dioxide concentration record 650,000-800,000 years before present
[J].Abstract Changes in past atmospheric carbon dioxide concentrations can be determined by measuring the composition of air trapped in ice cores from Antarctica. So far, the Antarctic Vostok and EPICA Dome C ice cores have provided a composite record of atmospheric carbon dioxide levels over the past 650,000 years. Here we present results of the lowest 200 m of the Dome C ice core, extending the record of atmospheric carbon dioxide concentration by two complete glacial cycles to 800,000 yr before present. From previously published data and the present work, we find that atmospheric carbon dioxide is strongly correlated with Antarctic temperature throughout eight glacial cycles but with significantly lower concentrations between 650,000 and 750,000 yr before present. Carbon dioxide levels are below 180 parts per million by volume (p.p.m.v.) for a period of 3,000 yr during Marine Isotope Stage 16, possibly reflecting more pronounced oceanic carbon storage. We report the lowest carbon dioxide concentration measured in an ice core, which extends the pre-industrial range of carbon dioxide concentrations during the late Quaternary by about 10 p.p.m.v. to 172-300 p.p.m.v.
Large inert carbon pool in the terrestrial biosphere during the Last Glacial Maximum
[J].During each of the late Pleistocene glacial–interglacial transitions, atmospheric carbon dioxide concentrations rose by almost 100 ppm. The sources of this carbon are unclear, and efforts to identify them are hampered by uncertainties in the magnitude of carbon reservoirs and fluxes under glacial conditions. Here we use oxygen isotope measurements from air trapped in ice cores and ocean carbon-cycle modelling to estimate terrestrial and oceanic gross primary productivity during the Last Glacial Maximum. We find that the rate of gross terrestrial primary production during the Last Glacial Maximum was about 40±10 Pg C yr−1, half that of the pre-industrial Holocene. Despite the low levels of photosynthesis, we estimate that the late glacial terrestrial biosphere contained only 330 Pg less carbon than pre-industrial levels. We infer that the area covered by carbon-rich but unproductive biomes such as tundra and cold steppes was significantly larger during the Last Glacial Maximum, consistent with palaeoecological data. Our data also indicate the presence of an inert carbon pool of 2,300 Pg C, about 700 Pg larger than the inert carbon locked in permafrost today. We suggest that the disappearance of this carbon pool at the end of the Last Glacial Maximum may have contributed to the deglacial rise in atmospheric carbon dioxide concentrations.
Simulating changes in the terrestrial biosphere during the last glacial/interglacial transition
[J].The state of the terrestrial biosphere during the Holocene and the Last Glacial Maximum (LGM) was estimated from data bases and steady state simulations in former studies. Here, we use these previous estimates and run a simple globally averaged box model of the terrestrial carbon stocks driven by various paleorecords (temperature, p CO2, sea level) from the LGM across termination I to the Holocene to determine which forcing might be appropriate to explain observed changes in the biosphere. Former forcing strength of this type of model on recent climate changes is not transferable to our problem of glacial/interglacial variations. The modelled terrestrial carbon stock at the LGM is about 1600 PgC, 600 PgC less than in preindustrial times. The oceanic release of carbon during the last 20 ky seems to be in phase with the atmospheric p CO2 record, but four times larger than the p CO2 increase due to the build-up of the terrestrial stocks. Calculated changes in oceanic δ13 C correspond well with data and suggest not only a significant role of the biosphere on atmospheric δ13 C during stable climate conditions such as the LGM or the Holocene, but also during the transition. A final identification of the relative importance of either climate change or CO2 fertilization for fixation of carbon in the terrestrial biosphere is not yet possible.
Carbon-13 in Uvigerina: Tropical rainforest history and the equatorial Pacific carbonate dissolution cycles
[
Terrestrial carbon storage at the LGM
[J].No Abstract available for this article.
Soil organic matter and biology in relation to climate change
[
Climate-driven increases in global terrestrial net primary production from 1982 to 1999
[J].Abstract Recent climatic changes have enhanced plant growth in northern mid-latitudes and high latitudes. However, a comprehensive analysis of the impact of global climatic changes on vegetation productivity has not before been expressed in the context of variable limiting factors to plant growth. We present a global investigation of vegetation responses to climatic changes by analyzing 18 years (1982 to 1999) of both climatic data and satellite observations of vegetation activity. Our results indicate that global changes in climate have eased several critical climatic constraints to plant growth, such that net primary production increased 6% (3.4 petagrams of carbon over 18 years) globally. The largest increase was in tropical ecosystems. Amazon rain forests accounted for 42% of the global increase in net primary production, owing mainly to decreased cloud cover and the resulting increase in solar radiation.
Terrestrial gross carbon dioxide uptake: Global distribution and covariation with climate
[J].Abstract Terrestrial gross primary production (GPP) is the largest global CO(2) flux driving several ecosystem functions. We provide an observation-based estimate of this flux at 123 +/- 8 petagrams of carbon per year (Pg C year(-1)) using eddy covariance flux data and various diagnostic models. Tropical forests and savannahs account for 60%. GPP over 40% of the vegetated land is associated with precipitation. State-of-the-art process-oriented biosphere models used for climate predictions exhibit a large between-model variation of GPP's latitudinal patterns and show higher spatial correlations between GPP and precipitation, suggesting the existence of missing processes or feedback mechanisms which attenuate the vegetation response to climate. Our estimates of spatially distributed GPP and its covariation with climate can help improve coupled climate-carbon cycle process models.
Carbon stocks and isotopic budgets of the terrestrial biosphere at mid-Holocene and last glacial maximum times
[J].The carbon fluxes, stocks and isotopic budgets of the land biosphere at mid-Holocene (6 ka BP) and last glacial maximum (21 ka BP) times are reconstructed with the CARbon Assimilation In the Biosphere (CARAIB) model forced with two different sets of climates simulated by the European Centre-HAMburg (ECHAM) and LMD general circulation models. It is found that the trends predicted on the basis of both sets of GCM climatic fields are generally consistent with each other, although substantial discrepancies in the magnitude of the changes may be observed. Actually, these discrepancies in the biospheric results associated with the use of different GCM climatic fields are usually smaller than the differences between biospheric runs performed while considering or neglecting the CO2 fertilization effect (which might, however, be overestimated by the model due to uncertainties concerning changes in nutrient availability). The calculated changes with respect to the present of the biosphere carbon stock range from 61132 to +92 Gt C for the mid-Holocene and from 61710 to +70 Gt C for the last glacial maximum. It is also shown that the relative contribution of the material synthesized byC4 plants to the total biomass of vegetation, litter and soils was substantially larger at mid-Holocene and last glacial maximum times than today. This change in the relative importance of theC3 andC4 photosynthetic pathways induced changes in the ja:math fractionation of the land biosphere. These changes in the average biospheric fractionation resulting from the redistribution ofC3 andC4 plants were partly compensated for by changes of opposite sign in the fractionation ofC3 plants due to the modification of the intercellular CO2 pressure within their leaves. With respect to present times, the combination of both processes reduced the ja:math discrimination (i.e., less negative fractionation) of the land biosphere by 0.03 to 0.32‰ during the mid-Holocene and by 0.30 to 1.86‰ at the last glacial maximum.
The global carbon cycle and its changes over glacial-interglacial cycles
[J].Carbon is an essential element for life, food and energy. It is also a key component of greenhouse gases and, thus, plays an important role in past and present climatic changes.
Terrestrial biosphere changes over the last 120 kyr
[J].A new global synthesis and biomization of long (>40 kyr) pollen-data records is presented and used with simulations from the HadCM3 and FAMOUS climate models and the BIOME4 vegetation model to analyse the dynamics of the global terrestrial biosphere and carbon storage over the last glacial–interglacial cycle. Simulated biome distributions using BIOME4 driven by HadCM3 and FAMOUS at the global scale over time generally agree well with those inferred from pollen data. Global average areas of grassland and dry shrubland, desert, and tundra biomes show large-scale increases during the Last Glacial Maximum, between ca. 64 and 74 ka BP and cool substages of Marine Isotope Stage 5, at the expense of the tropical forest, warm-temperate forest, and temperate forest biomes. These changes are reflected in BIOME4 simulations of global net primary productivity, showing good agreement between the two models. Such changes are likely to affect terrestrial carbon storage, which in turn influences the stable carbon isotopic composition of seawater as terrestrial carbon is depleted in 13C.
Ecosystem effects of CO2 concentration: Evidence from past climates
[J].Atmospheric CO2 concentration has varied from minima of 170–200 ppm in glacials to maxima of 280–300 ppm in the recent interglacials. Photosynthesis by C3 plants is highly sensitive to CO2 concentration variations in this range. Physiological consequences of the CO2 changes should therefore be discernible in palaeodata. Several lines of evidence support this expectation. Reduced terrestrial carbon storage during glacials, indicated by the shift in stable isotope composition of dissolved inorganic carbon in the ocean, cannot be explained by climate or sea-level changes. It is however consistent with predictions of current process-based models that propagate known physiological CO2 effects into net primary production at the ecosystem scale. Restricted forest cover during glacial periods, indicated by pollen assemblages dominated by non-arboreal taxa, cannot be reproduced accurately by palaeoclimate models unless CO2 effects on C3-C4 plant competition are also modelled. It follows that methods to reconstruct climate from palaeodata should account for CO2 concentration changes. When they do so, they yield results more consistent with palaeoclimate models. In conclusion, the palaeorecord of the Late Quaternary, interpreted with the help of climate and ecosystem models, provides evidence that CO2 effects at the ecosystem scale are neither trivial nor transient.
Global vegetation and terrestrial carbon cycle changes after the last ice age
[J].In current models, the ecophysiological effects of CO2 create both woody thickening and terrestrial carbon uptake, as observed now, and forest cover and terrestrial carbon storage increases that took place after the last glacial maximum (LGM). Here, we aimed to assess the realism of modelled vegetation and carbon storage changes between LGM and the pre‐industrial Holocene (PIH).We applied Land Processes and eXchanges (LPX), a dynamic global vegetation model (DGVM), with lowered CO2 and LGM climate anomalies from the Palaeoclimate Modelling Intercomparison Project (PMIP II), and compared the model results with palaeodata.Modelled global gross primary production was reduced by 27–36% and carbon storage by 550–694 Pg C compared with PIH. Comparable reductions have been estimated from stable isotopes. The modelled areal reduction of forests is broadly consistent with pollen records. Despite reduced productivity and biomass, tropical forests accounted for a greater proportion of modelled land carbon storage at LGM (28–32%) than at PIH (25%).The agreement between palaeodata and model results for LGM is consistent with the hypothesis that the ecophysiological effects of CO2 influence tree–grass competition and vegetation productivity, and suggests that these effects are also at work today.
Paleo-environmental change in Amazonian and African rainforest during the LGM
[J].The paper provides new and comparative insight into the ecological history of the two largest continental tropical forest areas during the Last Glacial Maximum (LGM). The tropical forest regions are of particular interest because they present a large source of heat and have been shown to have significant impact on the extra tropical atmospheric circulation. They are also the most intense land-based convective centers. Thus, especially from the tropics paleoecological information is needed as benchmarks for climate modeling. The African data for LGM climates were published earlier including the reconstructed paleoprecipitation patterns deduced from SSTs. The tropical South American LGM data were interpreted from pollen, geochemical, and 18O (stable oxygen isotope) data from Brazil and selected surrounding areas. The available terrestrial data are consistent with the SST derived precipitation data for the tropical forests in Brazil and for Africa. However, the impact of LGM climate extremes was less severe in the Amazon than in the Congo basin. The LGM humid forest area (including evergreen and semi-deciduous forest types) in Africa was probably reduced by 84%. In contrast, the Amazon humid forest area probably shrank to 54% of their present-day extension. Still, there are different interpretations with respect to the amount of reduction of the Amazon forest area during the LGM. Although direct information about LGM climates in Amazonia is still limited the more detailed map obtained in the present work, however, allows a more reliable characterization of the last glacial tropical environment than previously published for the Amazon region.
Carbon storage and release in Indonesian peatlands since the last deglaciation
[J].Peatlands have been recognised as globally important carbon sinks over long timescales that produced a global, net-climatic cooling effect over the Holocene. However, little is known about the role of tropical peatlands in the global carbon cycle. We therefore determine the past rates of carbon storage and release in the Indonesian peatlands of Kalimantan and Sumatra – the largest global concentration of tropical peatlands – since 20 ka (kiloannum before present). Using a novel GIS (geographic information system) approach we provide a spatially-explicit reconstruction of peatland expansion in a series of paleogeographic maps.Sea-level change is identified as the principal driver for peatland formation and expansion in western Indonesia as it controls both atmospheric moisture supply and the hydrological gradient on the islands. Initiation of inland peatlands in Kalimantan was coupled to periods of rapid deglacial sea-level rise with rates of over 10 mm yr−1 whereas coastal peatlands could only form after 7 ka when the rate of sea-level rise had slowed to 2.4 mm yr−1. Falling sea levels after 5 ka led to rapid peatland expansion in coastal lowlands and a doubling of the total peatland area in western Indonesia to 131,500 km2 between 2.3 ka and 0 ka. As a result of slow peatland expansion from 15 to 6 ka and rapid expansion afterwards the rate of annual carbon storage of all western Indonesian peatlands remained <1 Tg C yr−1 until 6 ka and then increased to 7.2 Tg C yr−1 by 0 ka. Associated with this rise in carbon storage was an exponential growth of the peat carbon pool from 0.01 Pg C by 15 ka to 23.2 Pg C at present, of which 70% is stored in coastal peatlands. In inland Kalimantan peatlands, falling sea levels together with increased El Niño activity induced an annual carbon release of 0.15 Tg C yr−1 from aerobic peat decay since 2 ka. Cumulative carbon losses from anaerobic decomposition do not seem to limit peat bog growth in the tropical peatlands of Indonesia. Carbon losses from Holocene peat fires are only known from the Kutai basin since 4.4 ka with an associated release of 0.1–3.6 Tg C per fire event, which never surpassed the contemporaneous annual C storage. The peatlands of western Indonesia were thus a persistent carbon sink since 15 ka but this sink was of global importance only over the past 2000 years when it likely contributed to a slower growth in atmospheric CO2 concentrations. Currently, annual losses of carbon from peat drainage and fires are on average 28 times higher than the pre-disturbance rate of uptake implying that this carbon reservoir has recently switched from being a net carbon sink to a significant source of atmospheric carbon and is currently in danger of eradication.
Global and regional importance of the tropical peatland carbon pool
[J].Abstract Accurate inventory of tropical peatland is important in order to (a) determine the magnitude of the carbon pool; (b) estimate the scale of transfers of peat-derived greenhouse gases to the atmosphere resulting from land use change; and (c) support carbon emissions reduction policies. We review available information on tropical peatland area and thickness and calculate peat volume and carbon content in order to determine their best estimates and ranges of variation. Our best estimate of tropical peatland area is 441025km2 (6511% of global peatland area) of which 247778km2(56%) is in Southeast Asia. We estimate the volume of tropical peat to be 1758Gm3(6518–25% of global peat volume) with 1359Gm3 in Southeast Asia (77% of all tropical peat). This new assessment reveals a larger tropical peatland carbon pool than previous estimates, with a best estimate of 88.6Gt (range 81.7–91.9Gt) equal to 15–19% of the global peat carbon pool. Of this, 68.5Gt (77%) is in Southeast Asia, equal to 11–14% of global peat carbon. A single country, Indonesia, has the largest share of tropical peat carbon (57.4Gt, 65%), followed by Malaysia (9.1Gt, 10%). These data are used to provide revised estimates for Indonesian and Malaysian forest soil carbon pools of 77 and 15Gt, respectively, and total forest carbon pools (biomass plus soil) of 97 and 19Gt. Peat carbon contributes 60% to the total forest soil carbon pool in Malaysia and 74% in Indonesia. These results emphasize the prominent global and regional roles played by the tropical peat carbon pool and the importance of including this pool in national and regional assessments of terrestrial carbon stocks and the prediction of peat-derived greenhouse gas emissions.
The vegetation and climate at the last glaciation on the emerged continental shelf of the South China Sea
[J].Studies on the dispersal mechanism and source areas of pollen from hemipelagic sediments recovered from the continental slopes of the South China Sea (SCS) reveal that vegetation existed on the exposed shelves at the Last Glacial Maximum (LGM) and the latter part of the Marine Isotope Stage 3. At the low sea level stand, Artemisia -dominated grassland covered the northern continental shelf and tropical lowland rainforest and mangroves grew on the southern shelf ‘Sunda Land’. Consequently, the climate in the northern SCS must have been much colder and drier during the last glacial period compared to the present. Sunda Land experienced only a marginally lower temperature but was not drier than today. The enhanced contrast between the northern and southern parts of the SCS in vegetation and climate during the LGM may be ascribed, at least partly, to the strengthening of Winter Monsoon during the last glacial period.
Palaeoenvironments of insular Southeast Asia during the Last Glacial Period: A savanna corridor in Sundaland?
[J].Consideration of a range of evidence from geomorphology, palynology, biogeography and vegetation/climate modelling suggests that a north-south ‘savanna corridor’ did exist through the continent of Sundaland (modern insular Indonesia and Malaysia) through the Last Glacial Period (LGP) at times of lowered sea-level, as originally proposed by Heaney [1991. Climatic Change 19, 53–61]. A minimal interpretation of the size of this corridor requires a narrow but continuous zone of open ‘savanna’ vegetation 50–15002km wide, running along the sand-covered divide between the modern South China and Java Seas. This area formed a land bridge between the Malaysian Peninsula and the major islands of Sumatra, Java and Borneo. The savanna corridor connected similar open vegetation types north and south of the equator, and served as a barrier to the dispersal of rainforest-dependent species between Sumatra and Borneo. A maximal interpretation of the available evidence is compatible with the existence of a broad savanna corridor, with forest restricted to refugia primarily in Sumatra, Borneo and the continental shelf beneath the modern South China Sea. This savanna corridor may have provided a convenient route for the rapid early dispersal of modern humans through the region and on into Australasia.
Wetlands at the Last Glacial Maximum: Distribution and methane emissions
[J].The global distribution of potential wetlands and their methane (CH) emissions at the present-day and the Last Glacial Maximum (LGM) are estimated using a GCM simulation of LGM climate, a vegetation model, and simple algorithms for determining wetland area based on topography and soil moisture, and CHemissions based on ecosystem carbon turnover in wet soils. LGM wetland area was 15% larger than present, but CHemissions were 24% less. Extensive wetlands were simulated on the exposed continental shelves. The soil CHsink was simulated as 14 Tg now but <0.5 Tg at the LGM. CHemissions at LGM were limited by substrate availability, in turn due to low atmospheric CO. The glacial-interglacial change in atmospheric CHconcentration cannot be completely attributed to changes in the wetland source.
Soils on exposed Sunda Shelf shaped biogeographic patterns in the equatorial forests of Southeast Asia
[J].The marked biogeographic difference between western (Malay Peninsula and Sumatra) and eastern (Borneo) Sundaland is surprising given the long time that these areas have formed a single landmass. A dispersal barrier in the form of a dry savanna corridor during glacial maxima has been proposed to explain this disparity. However, the short duration of these dry savanna conditions make it an unlikely sole cause for the biogeographic pattern. An additional explanation might be related to the coarse sandy soils of central Sundaland. To test these two nonexclusive hypotheses, we performed a floristic cluster analysis based on 111 tree inventories from Peninsular Malaysia, Sumatra, and Borneo. We then identified the indicator genera for clusters that crossed the central Sundaland biogeographic boundary and those that did not cross and tested whether drought and coarse-soil tolerance of the indicator genera differed between them. We found 11 terminal floristic clusters, 10 occurring in Borneo, 5 in Sumatra, and 3 in Peninsular Malaysia. Indicator taxa of clusters that occurred across Sundaland had significantly higher coarse-soil tolerance than did those from clusters that occurred east or west of central Sundaland. For drought tolerance, no such pattern was detected. These results strongly suggest that exposed sandy sea-bed soils acted as a dispersal barrier in central Sundaland. However, we could not confirm the presence of a savanna corridor. This finding makes it clear that proposed biogeographic explanations for plant and animal distributions within Sundaland, including possible migration routes for early humans, need to be reevaluated.
The stratigraphic evolution of the Sunda Shelf during the past fifty thousand years
[C]//Sidi F H,ed.
Vegetation on the Sunda Shelf, South China Sea, during the Last Glacial Maximum
[J].Pollen and phytoliths from sediment cores SO18300, 18302 and 18323 on the continental shelf of the southern South China Sea are analyzed, with special attention to reconstructing vegetation and climate changes on the Sunda Shelf during the Last Glacial Maximum (LGM). The LGM pollen assemblages are characterized by high percentages of pollen from the lowland rain forests and lower montane rainforests, suggesting that the exposed shelf was covered with humid vegetation. A marshy vegetation (with plants of sedges, reeds, bamboo, etc.) developed in the valley along the North Sunda River, and around the marshes were distributed palms and a variety of ferns including tree ferns ( Cyathea ). The climate during the LGM inferred from the vegetation was cooler than that at the present day, but no significant decrease in humidity was recorded, at least the change was not sufficient to prevent the growth of rainforest. Finally, the observed fluctuations in percentage of mangrove pollen are considered as a sensitive indicator of coastline migrations on the Sunda Shelf.
Cenozoic ecological history of South East Asian peat mires based on the comparison of coals with present day and Late Quaternary peats
[J].ABSTRACT We review the current state of knowledge and patterns of distribution in the endemic Cladocera (Crustacea: Branchiopoda) of Southern Africa and describe two species of the Western Cape, of which one is new to science. Frey (1993), Korovchinsky (2006) and Smirnov (2008) previously suggested that South Africa harbours few endemics in the Cladocera. In the current study, we show that so-called low endemism in this region is mainly attributed to our limited state of knowledge of the local cladoceran fauna. Many of the South African taxa are ignored and revisions are lacking, as we briefly discuss for the genus Daphnia. We list known Southern African endemic Cladocera with notes on their status, map the distributions of well-studied taxa, and discuss the importance of temporary freshwater rockpools. We confirm that Southern Africa is a region of endemism for the group. We recognise three categories of endemics: i) montane endemics in the East (e.g., Drakensberg mountains); ii) endemics of the Western Cape (lowlands); iii) South African endemics, widely distributed in the region, both in the mountains and the lowlands. South African endemics have previously been regarded as relicts (Korovchinsky 2006), yet for the two taxa explored in detail in this study, there are no specific primitive morphological characters in comparison to congeners (within their respective genus/species group) and the morphology mainly suggests strong isolation. The two species belong to the Chydoridae and the Eurycercidae, respectively, and are used here as case studies for the investigation of Western Cape endemics. The first, Alona capensis Rhe, 1914 (Anomopoda: Chydoridae: Aloninae), is redescribed based on the type material. We discuss the affinities of this enigmatic species for the first time. Morphology of the habitus and the postabdomen parallel that of members of the Alona affinis-complex. The disconnected head pores and limb characters, on the other hand, place A. capensis in the Alona pulchella-group, a different lineage in the Aloninae subfamily. The specific postabdomen shape of A. capensis and a unique, inflated rostrum, diverge from the main A. pulchella-morphotype and illustrate the significant morphological isolation of A. capensis within its group. The second species, Eurycercus (Eurycercus) freyi sp.nov. (Eurycercidae), is described based on material from the collection of the late Prof. Dr. David G. Frey. It is an E. lamellatus-like taxon that is easily differentiated from the two related species (E. lamellatus and E. microdontus) by a strong indentation (with depth larger than head pore diameter) behind the head pores. E. freyi sp.nov. seems to be the closest relative of E. lamellatus. The small clade of just two species is supported by two synapomorphies: i) the rostrum is long; and ii) the spine situated on the proximal segment of the exopod of antenna II is longer than the second segment, in contrast to E. microdontus.
The effect of sea level on glacial Indo-Pacific climate
[J].The Indo-Pacific Warm Pool – the Earth’s largest body of warm water and main source ofheat and moisture to the global atmosphere – plays a prominent role in tropical and globalclimate change. The physical mechanisms driving changes in the warm pool over glacial-interglacial timescales are largely unknown. Here we show that during the Last GlacialMaximum (LGM) changes in global sea level influenced tropical climate by exposing theSunda Shelf and altering the Walker Circulation. Our result is based on a synthesis of marine and terrestrial proxies sensitive to hydroclimate and a multi-model ensemble of climatesimulations. The proxy data suggest drying throughout the warm pool, and wetter conditions in the western Indian and Pacific oceans. Only one model out of twelve simulates asimilar pattern of hydroclimate change, as measured by the Cohen’s statistic. According to this model, weakened convection over the warm pool in response to exposure of theSunda Shelf drives the proxy-inferred hydrological changes. Our study demonstrates thaton glacial-interglacial timescales, ice sheets exert a first order influence on tropical climatethrough changes in global sea level.
