


1 引 言
稀土元素与钇(Rare Earth Elements and Yttrium,REY)的分馏效应被广泛应用于地学研究。如在古环境研究中,铈(Ce)正/负异常分别指示还原和氧化沉积条件[1-3],铕(Eu)正异常指示海底热液活动[4-5],Y/Ho指示成岩作用的强弱[6-7],(Nd/Yb)PAAS指示河流水与海水的混合程度[8]等。导致REY分馏的内因主要有2个:一是部分稀土元素(Rare Earth Element,REE)(如Ce和Eu)具有变价特性,氧化还原条件改变会促使这些REE氧化或还原反应,进而导致其地球化学行为与相邻+3价REE表现出不一致性;二是REY的质量/半径值随着原子序数的增加而增加[6,9-12],这一差异会改变REY与阴离子的络合能力(Pearson法则)[13-14],或固体对REY的静电吸附能力(库伦定律),进而导致轻稀土(Light Rare Earth Elements,LREEs)和重稀土(Heavy Rare Earth Elements,HREEs)分馏。与地球深部及地外环境不同,表生环境中广泛存在微生物,微生物作用不仅深刻改变了地球土壤、大气和海洋环境,也对这些环境中REY的分馏产生了重要影响。微生物除了表面存在大量可以络合REY的阴离子基团外[13,15-17],其内部也存在各种可以结合REY的结构位和吸附位等[18-19]。REY[如镧(La)和Ce]与其结合后会显著改变微生物的代谢功能,如营养元素的获取和微囊藻毒素的分泌等[20-21]。研究发现,微生物表面络合位对REY的分馏受pH影响,低pH条件下微生物表面易于吸附HREEs[22-23],而近中性或碱性条件下微生物与有机质易于固定LREEs[11,16,24],其主要原因是随着pH值的升高,天然水中会有更高浓度的CO ,基于硬酸与硬碱优先络合的原理(Pearson法则),CO 优先与HREEs络合,生成低价且容易保留在溶液中的[REE]CO 或[REE](CO3) [10],而+3价LREEs因为电荷更高、库伦作用力更大,对微生物/有机质吸附作用更强[25]。
2 材料与方法
2.1 材料
(1)纳米磷灰石合成。采用溶胶—凝胶法制备纳米磷灰石[42]。分别配制浓度0.025 mol/L和0.300 mol/L的Ca(NO3)2和(NH4)2HPO4溶液;按照700∶1体积比向Ca(NO3)2溶液中添加REE标准溶液(中国有研,每种REE浓度均为300 mg/L,硝酸盐形式,基体为5% HNO₃;合成无REE的纳米磷灰石时省略这一步);在45 ℃水浴和搅拌的条件下,用恒压漏斗将(NH4)2HPO4溶液缓慢滴加到Ca(NO3)2溶液中,直至溶液中Ca/P摩尔比达到1.67;用NH3‧H2O调节溶液pH,使其保持在10.0~10.2;调节pH后,保持条件不变再反应40 min;离心收集沉淀,用去离子水离心清洗,直至上清液pH保持稳定;将制备得到的纳米磷灰石在80 ℃烘箱中干燥12 h;将干燥后的纳米磷灰石研磨过200目筛备用。
(2)含磷水铁矿合成。配制浓度0.100 mol/L的Fe(NO3)3溶液;按体积比20∶1向Fe(NO3)3溶液中添加REE标准溶液(合成无REE的水铁矿时省略这一步);在持续搅拌条件下往Fe(NO3)3溶液中缓慢滴加0.100 mol/L KOH溶液,直至溶液pH达到7.0~8.0[43];将生成的悬浊液离心,收集固体,用去离子水离心洗涤3次;将固体烘干(45 ℃,24 h)并研磨成粉末,得到含/不含REE的水铁矿;将5 g K2HPO4溶解至500 mL去离子水中;向溶液中加入0.8 g水铁矿,持续搅拌24 h;离心回收水铁矿并用去离子水离心洗涤3次;将水铁矿在45 ℃条件下烘干,研磨过200目筛备用。
采用浓HNO3在200 ℃条件下消解2种矿物;通过钼酸铵分光光度法测定消解液磷浓度,得到纳米磷灰石和含磷水铁矿中磷含量分别为169.60 g/kg和18.86 g/kg,前者接近羟基纳米磷灰石中磷的标准含量(185.30 g/kg);采用电感耦合等离子质谱(Inductively Coupled Plasma-Mass Spectrometry,ICP-MS)测定REE浓度,结果如表1所列,实验中采用这些数据对溶液、菌体及矿物中的REE进行标准化;采用10%质量浓度的乙酸浸泡含REE的样品12 h后测定溶液中REE浓度,发现纳米磷灰石中的REE未释放而水铁矿中的REE几乎全部释放,这表明REE主要以类质同像形式替代纳米磷灰石中的钙(Ca),而主要以吸附的形式赋存于水铁矿中;采用高分辨透射电镜(High-Resolution Transmission Electron Microscope, HRTEM)和X射线衍射对2种矿物进行物相分析,结果表明前者为纳米羟基磷灰石,后者为纳米2线水铁矿。
表1 纳米磷灰石和水铁矿中稀土元素含量 (g/kg)Table 1 Rare Earth Element (REE) content of apatite and ferrihydrite |
| 矿物 | La | Ce | Pr | Nd | Sm | Eu | Gd |
|---|---|---|---|---|---|---|---|
| 纳米磷灰石 | 1.737 | 1.693 | 1.616 | 1.531 | 1.478 | 1.634 | 1.666 |
| 水铁矿 | 1.855 | 1.831 | 1.753 | 1.813 | 1.615 | 1.769 | 1.802 |
| 矿物 | Tb | Dy | Ho | Er | Tm | Yb | Lu |
| 纳米磷灰石 | 1.607 | 1.632 | 1.579 | 1.640 | 1.601 | 1.649 | 1.604 |
| 水铁矿 | 1.742 | 1.775 | 1.731 | 1.795 | 1.756 | 1.813 | 1.752 |
(3)蓝藻及培养基。本文选用铜绿微囊藻(Microcystis aeruginosa)开展实验,原因是该藻种是现代富营养化淡水湖泊中的优势菌种[44],前人对其生理生化特征了解比较全面。所有菌种购自中国科学院淡水藻种库(编号FACHB-930),为超低温保存的菌液。对购买的菌株进行活化并梯度扩培,培养基选用BG11[45]。培养基配制方案为:首先配制5种母液,然后从母液1~5中分别抽取2 mL、50 mL、2 mL、1 mL和1 mL溶液并混合,将混合液定容至1 000 mL;采用HCl和NaOH调节培养基pH为7.1~7.3;用高压蒸汽灭菌锅在120 ℃下对BG11培养基灭菌30 min。M. aeruginosa活化及扩培方法为:将购买的M. aeruginosa原藻液按2∶8体积比与液体培养基混合,用封口膜隔绝空气中的其他微生物;在26 ℃、光照强度2 500 lux、光暗周期12 h∶12 h条件下进行培养;每14 d进行1次换培;通过叶绿素a监测M. aeruginosa的生长。
(4)透析袋活化。为了真实模拟天然纳米颗粒中的磷和REE通过真实溶解态或简单络合态向M. aeruginosa迁移的过程,以及实验中能有效分离菌体和矿物,采用孔径10 000 Da的透析袋阻隔矿物和蓝藻。透析袋材质为聚碳酸酯。该透析袋孔径约为5 nm[46],合成矿物的粒径几乎均大于该尺寸(据本研究HR-TEM结果),而M. aeruginosa代谢会产生大量小于该尺寸的有机物[47]。因此,该型号透析袋可以有效阻止矿物与细胞的接触,但不会完全阻止其与代谢产物的作用。使用前对透析袋进行活化,流程为:在大体积的2%(W/V,质量/体积比)NaHCO3溶液中将透析袋煮沸10 min,随后用去离子水彻底清洗;配制1.0 mmol/L EDTA(Ethylenediaminetetraacetic Acid)溶液,调节pH=8.0,将透析袋放入溶液中煮沸10 min,冷却后用去离子水洗涤;将活化后的透析袋浸没于去离子水中并冷藏保存。
2.2 实验
(1)纳米颗粒结合态磷生物可利用性实验。开展3组不同磷源实验:BG11、纳米磷灰石和含磷水铁矿。BG11实验为对照实验,培养基为BG11。纳米磷灰石和含磷水铁矿实验中,将BG11培养基中的溶解磷分别等量替换为纳米磷灰石和含磷水铁矿。实验过程中,先将无磷的BG11培养基高温灭菌,同时对纳米磷灰石和含磷水铁矿进行紫外灭菌30 min;抽取100 mL培养至对数生长期(6~8 d)M. aeruginosa菌液,3 500 rpm离心10 min,弃去上清液;用无P BG11培养离心清洗藻细胞2次后,加入100 mL BG11(BG11实验有磷,其他实验无磷)培养基重新悬浮细胞;将菌悬液加入900 mL(有磷或无磷)培养基中;向无磷培养液中加入灭菌无REE的纳米磷灰石或含磷水铁矿,二者添加量分别为0.038 4 g/L和0.44 g/L;每组实验重复3次;在26 ℃、光照强度2 500 lux、光暗周期12 h∶12 h条件下培养20 d,每日手动摇晃2次。
(2)REE实验。开展3种类型REE实验:溶解磷实验、接触实验和透析实验。溶解磷实验分为高REE(单一REE浓度300 μg/L)和低REE(单一REE浓度30 μg/L)2组实验,编号分别为BG11-H和BG11-L,培养基为BG11。接触实验(编号Ap-C和Fh-C)中,培养基为无磷的BG11培养基,矿物添加量按等磷浓度添加,培养基中纳米磷灰石和含磷水铁矿浓度分别为0.042 g/L和0.446 g/L,单一REE浓度分别约为68 μg/L和785 μg/L。透析实验化学成分与接触实验相同,主要区别是透析实验中将含REE的2种矿物用透析袋封装后再放入培养体系中,实验编号分别为Ap-D和Fh-D。
2.3 分析测试
2.3.1 DAPI荧光染色分析
多聚磷酸盐(polyphosphates, polyP)是无机磷酸盐的线性缩合物,存在于包括蓝藻在内的大多数微生物中[48-49]。微生物在磷含量丰富时可以polyP的形式将无机磷储存于细胞内或胞壁中,并在磷胁迫时利用polyP生长。由于polyP的端元磷可与包括REE在内的阳离子结合[18-19,50],故本研究通过DAPI(4',6-diami-dino-2-phenylindole)染色的方法观察细胞中polyP和DNA-P的特征,据此推测其潜在REE络合能力,同时评估细胞活性。因荧光染料DAPI被广泛应用于polyP染色观察,研究采用荧光染料DAPI对细胞进行染色[51]。培养结束后将无REE实验中藻液在4 000 rpm下离心10 min,去除上清液;往离心管中加入与上清液体积相同的4%多聚甲醛固定液,固定细胞40 min;再次在4 000 rpm下离心10 min,去除固定液;先用PBS(Phosphate Buffered Saline)缓冲溶液离心清洗残留的固定液,然后去除PBS上清液;向离心管中加入2 mL浓度为10 μg/mL的DAPI染色液,染色4 h;再次用PBS缓冲溶液离心清洗残留染色液,最后用去离子水将细胞离心重悬。将染色藻液滴加到载玻片上,风干后滴加适量抗荧光淬灭封片剂(Biosharp BL701A),盖上盖玻片。采用激光共聚焦显微镜(Confocal-Laser Scanning Microscope,CLSM)(Leica stellaris 5)对M. aeruginosa细胞形貌(650~700 nm)、DNA(465 nm)和polyP(520 nm)进行观察[48]。测试完成后采用Imagel图像分析软件,对不同类型的荧光信号的面积进行了计算和分析。
2.3.2 固体核磁共振分析
蓝藻中存储有大量用于光合作用的HCO 和CO ,与PO 一样,这2种阴离子也可以与REE结合,故很有必要分析细胞内C和P的形态和含量。实验结束后离心收集BG11-L、Ap-D和Fh-D实验中的藻细胞,将藻细胞冷冻干燥并研磨成粉末,对粉末样进行13C和31P固体核磁共振(solid-state Nuclear Magnetic Resonance,ssNMR)分析。ssNMR测试在Bruker Avance NEO 400WB型固体核磁共振谱仪(Bruker BioSpin GmbH & Co. KG)上进行,配备型号为PH MAS DVT 400 W1 BL4 N-P/F-H的4 mm魔角旋转变温探头(探头编号H190901_0002)。13C测试频率为100.6 MHz,MAS转速设为5 kHz,采用交叉极化+侧带抑制程序,主脉冲宽度为3.837 5 μs,接触时间为4.85 ms,重复延迟0.5 s,扫描次数为1 200 次;³¹P测试频率为162.0 MHz,MAS转速设为10 kHz。采用单脉冲程序,主脉冲宽度为3.325 μs,重复延迟为0.5 s,扫描次数为1 602次。ssNMR测试在合肥工业大学分析测试中心完成。测试完成后采用MestReNova软件对数据进行拟合定性分析,并计算特征峰位的峰面积。
2.3.3 ICP-MS分析
接触实验中由于细胞与矿物混合,测定REE含量前需将二者分离,分离方法为:首先通过超声法将实验溶液中矿物与藻细胞尽可能分离,然后在500 rpm的低速条件下离心5 min使矿物首先沉淀,抽取含有藻细胞的上清液;将上清液在4 000 rpm的条件下离心15 min分离出藻细胞,上清液用于测定溶解态REE浓度;为了得到不含藻细胞的矿物和不含矿物的藻细胞,对分离得到的矿物和藻细胞分别重复上述过程3次。对透析实验,由于藻细胞与矿物不接触,通过离心收集二者即可,离心得到的上清液用于测定溶解态REE浓度。
采用ICP-MS测定实验后溶液、藻细胞和矿物中REE的浓度/含量。测试前,藻细胞用30% H2O2+浓HNO3(体积比3∶2)混合溶液消解,消解温度200 ℃;矿物粉末用浓HNO3消解,消解温度200 ℃;培养液经0.22 μm滤膜过滤后直接测试。BG11实验中采用标准溶液对溶液和细胞中的REE进行标准化,矿物实验中分别采用纳米磷灰石和含磷水铁矿中REE的浓度对溶液和细胞中的REE进行标准化。
2.3.4 HRTEM分析
实验结束后,取50 mL培养液置于离心管内,在3 500 rpm下离心10 min,去除上清液;添加与菌液体积相同的PBS漂洗液(磷酸盐缓冲液)离心清洗藻细胞,去除漂洗液;加入与漂洗液同等体积的4%的多聚甲醛细胞固定液,固定细胞40 min,离心并去除固定液;分别用30%、50%、70%、90%和100%浓度的乙醇溶液进行梯度脱水,最后将藻细胞保存在无水乙醇中备用。测试时吸取1~2滴含藻细胞乙醇溶液滴加到铜网上,风干后进行HRTEM测试。测试使用Thermo Fisher Scientific公司生产的Talos F200X G2型高分辨透射电子显微镜,工作电压为200 kV,采用HAADF模式获取结构图像,并通过配套的Super-X能谱仪进行元素映射(EDS mapping),分析样品中目标元素的空间分布情况。测试在合肥工业大学分析测试中心完成,测试完成后采用corelDRAW软件进行数据处理。
3 结 果
3.1 DAPI荧光染色
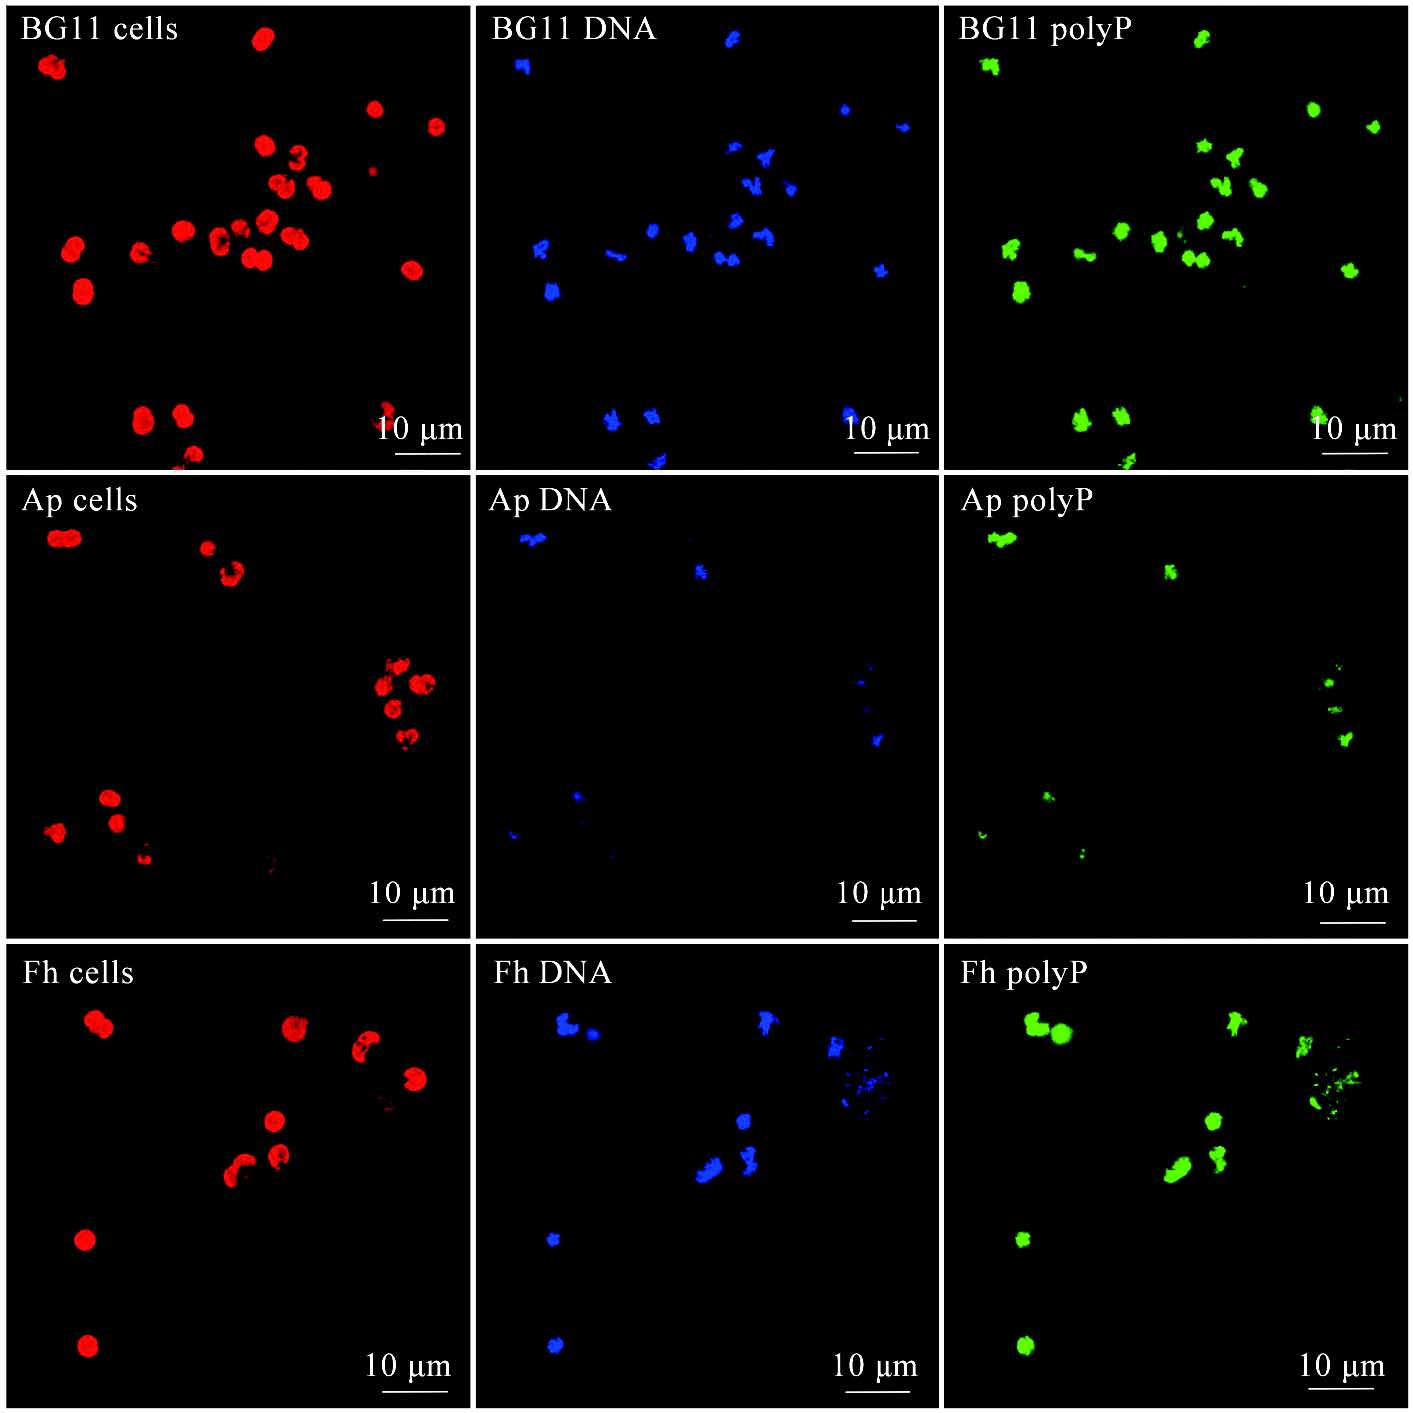
图1显示培养5 d后磷源对M. aeruginosa形态(红色)几乎无影响,单个细胞大致呈球状。在相同亮度和对比度下,纳米磷灰石实验中细胞内表征DNA和质粒的蓝色荧光斑点较小且强度较弱,表明该体系可能处于相对寡营养状态,细胞DNA和质粒拷贝数量较少。同样,纳米磷灰石实验中polyP(绿色)在形态上也相对更偏离球形,强度也弱于BG11和含磷水铁矿实验中的球粒状polyP。通过对相同视野下不同荧光信号的面积进行分析后发现,不同磷源条件下蓝藻细胞内DNA和polyP的荧光面积占比存在明显差异。溶解磷实验中,DNA和polyP荧光面积分别占细胞自身荧光面积的47.18%和56.08%;在纳米磷灰石实验中,分别为32.13%和40.41%;而在含磷水铁矿实验中,该比值最高,分别为64.29%和69.19%。结果显示,含磷水铁矿条件下蓝藻细胞内polyP的相对积累水平显著高于其他磷源条件。由于3组实验磷添加量相等,纳米磷灰石实验中更弱的DNA和polyP信号表明,纳米磷灰石比溶解磷和含磷水铁矿更难被M. aeruginosa利用。但是,整体上无论是哪种形态的磷,均能被M. aeruginosa有效利用。
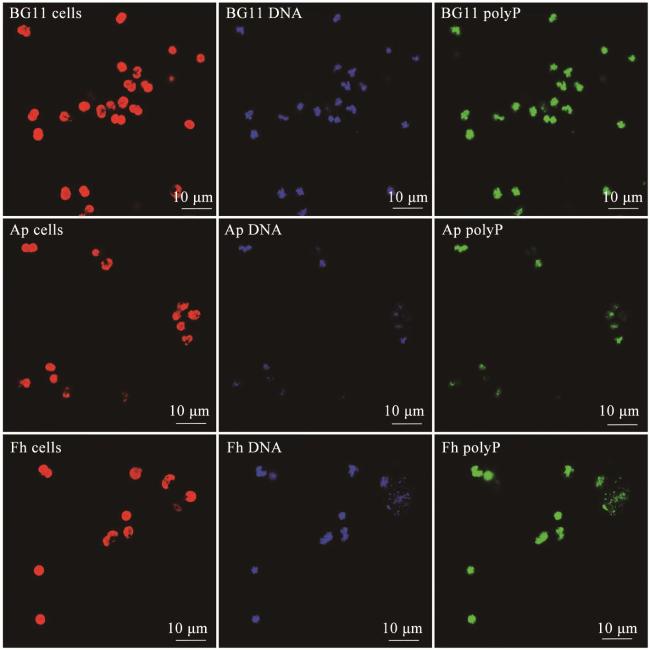
图2显示培养20 d后BG11实验组中细胞仍然呈球状,细胞中DNA/质粒和polyP仍然较为丰富(显蓝色和绿色的细胞比显红色的细胞少的原因是前两种细胞与其他细胞不在一个焦平面上),表明磷不是制约该体系中M. aeruginosa生长的决定因素。相较之下,纳米磷灰石和含磷水铁矿实验中磷体现出对蓝藻生长的控制作用:在对比度和亮度相同的条件下,两个实验中代表DNA/质粒的蓝色斑点和代表polyP的绿色斑点在数量、大小和强度上均小于BG11实验中的斑点,表明两个实验中细胞的复制能力和聚磷能力均显著下降,细胞活性降低。溶解磷实验中,DNA和polyP的荧光面积分别占细胞自身荧光面积的13.37%和7.76%;在纳米磷灰石实验中,分别为15.31%和3.46%;含磷水铁矿处理组中则为15.35%和1.34%。该结果一方面反映了M. aeruginosa在生长后期的增殖行为(细胞密度升高),另一方面也表明polyP在生长过程中被持续消耗。相较于矿物结合态磷,溶解磷更易被藻细胞吸收和利用,因此溶解磷实验中细胞内polyP仍保持相对较高的富集水平。以上结果与前人的研究相符,即纳米颗粒结合态磷可部分作为微生物生长的磷源[36-38]。前人在评估水质时常将水样过0.45 μm或0.22 μm滤膜[29,52],将滤液中磷的浓度作为评估初级生产力的指标(即认为该部分磷可以完全为微生物所用),但事实是纳米颗粒的存在会导致过高估算初级生产力。
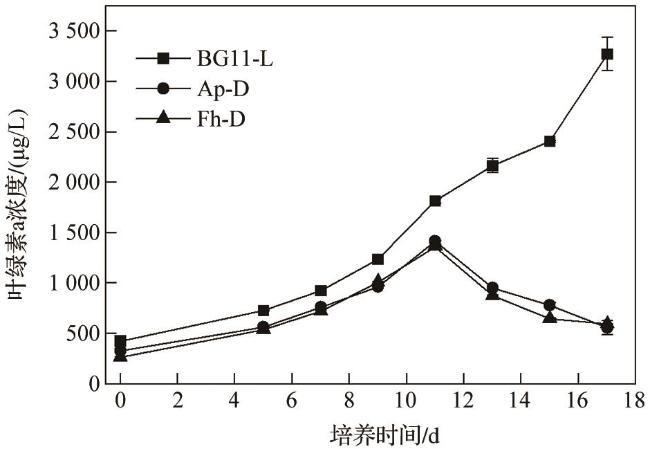
3.2 生长曲线
3.3 固体核磁共振
图4显示有机碳可以形成多种化学键,包括C-H、C-N、C-O、C=O和C-C键等[54],对应的有机物包括碳水化合物、多聚糖、蛋白和脂肪酸等。峰面积计算结果显示,BG11-L、Ap-D和Fh-D 3组实验在约170×10-6化学位移处的谱峰面积分别为2.66×10⁸、1.72×10⁸和1.76×10⁸;在约130×10-6化学位移处的谱峰面积分别为3.31×10⁷、3.46×10⁷和3.61×10⁷;在约72×10-6处的谱峰面积则分别为9.27×10⁷、1.11×10⁸和1.16×10⁸;而在0~40×10-6化学位移的范围内,3组实验都观察到许多共振重叠的谱峰,这部分化学位移域光谱的分辨率较差,因此难以精细计算这些共振的峰面积。在化学位移约170×10-6处的谱峰可能属于有机物中的C=O键(碳基、酰基)和无机碳(HCO /CO )[55],考虑到该峰强度远高于其他有机碳峰,有理由认为该峰主要归为HCO /CO [56]。3组实验中13C谱峰位和峰强均较一致,表明磷源对C的化学键种类和含量影响不大。
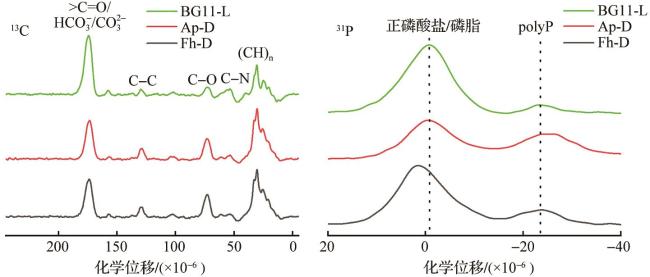
31P ssNMR在化学位移-40×10-6~40×10-6处主要显示2个宽峰,其中-23×10-6处的谱峰归属polyP中的非端元磷,0×10-6处的谱峰归属磷酸二酯和DNA[57-58]。对3组实验的谱图进行谱峰面积的计算,BG11-L在0×10-6和-23×10-6处的峰面积分别为1.65×10⁸和9.75×10⁶;Ap-D实验中2个化学位移处的峰面积分别为9.23×10⁷和7.44×10⁷;Fh-D实验分别1.39×10⁸和2.32×10⁷,Ap-D实验中在-23×10-6化学位移处的峰面积显著高于其他2组,说明polyP中非端元磷的保留量更高。Ap-D实验中polyP峰相对BG11-L和Fh-D略微负偏,可能表明Ap-D实验中的polyP具有相对更高的聚合度[59]。对0×10-6处谱峰,Ap-D和Fh-D均相对BG11-L发生了正偏(偏移量Fh-D>Ap-D),考虑到磷酸二酯(0~2×10⁻⁶)中31P谱峰正偏于DNA(-1×10⁻⁶)中的31P谱峰[57],有理由认为Fh-D实验中磷酸二酯含量更高。另外,因为化学位移0×10-6处谱峰为宽峰,覆盖了包括磷酸单酯(3×10⁻⁶~6×10⁻⁶)、正磷酸盐(5×10-6~7×10-6)在内的31P峰,故不排除蓝藻中存在这些物质的可能性[57]。
3.4 稀土元素浓度
在所有实验中,培养结束时溶液中REE标准化后浓度整体随原子序数增加而增加(图5),固体中REE标准化后含量变化相对较复杂:BG11-H实验中相对富LREEs,Fh-D实验中略微富HREEs,其余实验中REE无明显分馏。Dy出现较大程度异常,在BG11-L和Ap-D实验溶液中,以及Ap-D和Fh-D实验而藻细胞中,均相对近邻REE表现出富集特征。Ce未出现明显异常,表明实验过程中无Ce氧化导致的分馏。
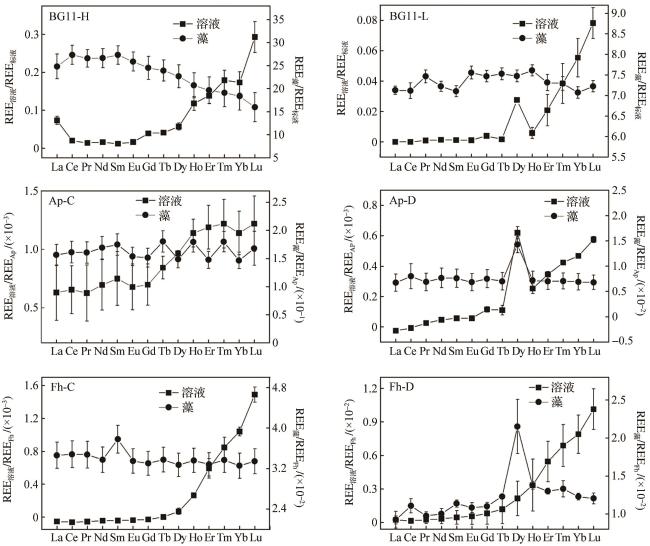
BG11-H实验中大部分溶解态和藻结合态REE浓度均不到BG11-L的10倍(初始添加比例),同时REE毒性导致前者生物量不如后者,可见BG11-H中有部分REE被漏测。本研究在测定溶液中REE浓度时,借鉴了前人的方法[60-61],未对滤液做酸化和H2O2消解处理(以溶解其中的纳米粒级沉淀及有机物)。事实上,即便是天然河流水,其中也有较多的纳米胶体,如富里酸、蛋白和多聚糖等,而这些物质无论是对磷还是对REE都有强烈的富集作用[61-62]。作为纯培养体系,本研究实验溶液中理应有更多纳米级有机质,在ICP-MS测试时,部分胶体物质会连同REE一起被ICP-MS作为废液排出,导致最后漏检这部分REE。因此,图5中的溶解态REE可看作是排除了胶体结合态REE后的真实溶解态REE,漏测部分可以归结为固体(生物)结合态。由于2个溶解P/REE实验中溶液均富HREEs,可以认为有机固体均富LREEs,实验BG11-L中固体REE分馏不明显,原因是有机胶体固定了较多LREEs。对矿物实验,固体中REE分馏不明显,可能受3个因素制约:一是REE从矿物中无差别释放,纳米胶体对LREEs的富集抵消了溶液或藻细胞(Fh-D)中LREEs的贫化;二是矿物选择性释放HREEs;三是固体中REE含量高,少量LREEs富集,不易在图5的曲线中体现。

3.5 微区形貌和成分分析
通过对溶液和固体中REE浓度的分析可知,细胞及胞外物质对REE分馏具有重要的制约作用,因此有必要分析这些物质的形态和元素分布特征。对实验BG11-L中藻细胞的HRTEM观测显示,细胞在REE作用下由球形转变为椭球形(图6);胞外多聚物(Extracellular Polymeric Substances,EPS)增多,主要呈絮状、斑点状和丝状;EPS导致细胞表面光滑程度降低,团聚性增强。细胞几乎都富REE,但EPS对REE产生选择性富集作用:斑点状EPS选择性富集Tb-Ho(图6),丝状EPS选择性富集Sm、Eu和Gd(附图1,扫描下方二维码或点击链接获得),La-Pm和Er-Lu在EPS中无选择性富集作用。在该实验中Ca和P分布一致,主要在菌体和斑点状EPS中富集,由于斑点状EPS中Tb-Ho分布与Ca-P一致,且前人研究发现磷酸盐矿物容易富集MREEs[35],故推测Tb-Ho和其他部分MREEs可能赋存于次生磷酸钙沉淀中。
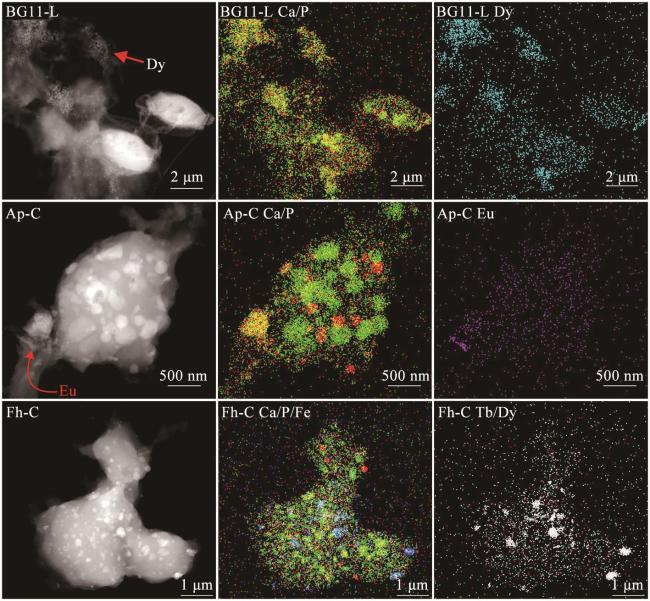

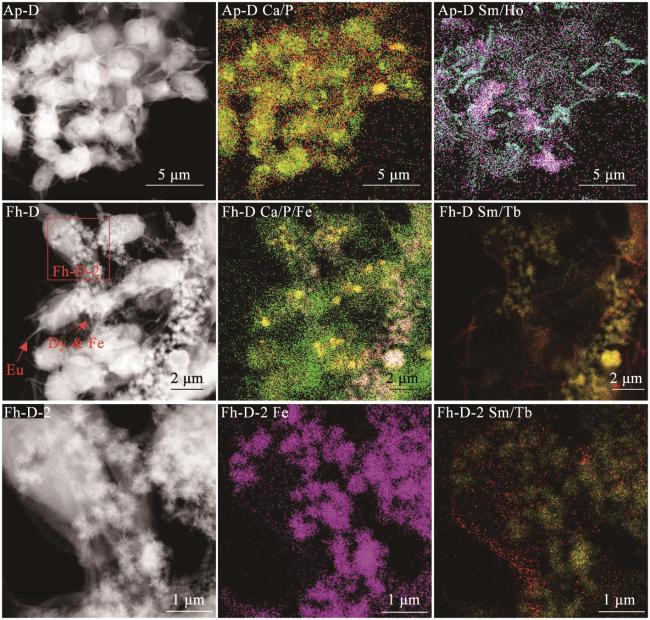
图7 透析实验中细胞高角环形暗场像图和元素微区分布图红色: P或Sm;绿色:Ca;粉红色:Fe或Ho;浅蓝色:Sm;黄色:Tb;Ca/P分布图中的黄色为红色与绿色叠加后的颜色。 Fig. 7 High-Angle Annular Dark Field (HAADF) images and element distribution maps of cells in dialysis experiments Red: P or Sm; Green: Ca; Pink: Fe or Ho; aquamarine: Sm; yellow: Tb; yellow color in Ca/P distribution maps is derived from the stacking of red and green colors. |

与实验Ap-D中相似的丝状EPS也大量出现在实验Fh-D中(图7),细胞间通过这种EPS相连并团聚;此外,团聚体中还存在大量直径在亚微米级、呈放射状的小球粒。元素分布分析结果显示丝状物质中富Sm、Eu和Gd(图7;附图5,扫描下方二维码或点击链接获得),而放射状小球粒中富Fe和Tb-Yb,表明此类小球为次生铁(氢)氧化物,MREEs-HREEs以类质同象或吸附态赋存于其中。结合Fh-C实验中铁(氢)氧化物富Gd-Er的事实,有理由认为,在本研究的pH和CO 浓度条件下,铁(氢)氧化物倾向于富集MREEs-HREEs,但是最重的REE(Tm、Yb和Lu)不一定与铁(氢)氧化物有亲和性,这一现象符合前人的观测结果[铁(氢)氧化物吸附导致溶液富La、Lu][32]。

4 讨 论
4.1 REE的微生物分馏机制
在本研究设定的中性—碱性条件下,高价态REE易于与阴离子络合。由于BG11培养基中包含多种阴离子,结合REE浓度,推测BG11-H中主要与REE络合的阴离子是HPO /PO 和HCO /CO ,原因是:REE物质的量浓度之和远高于柠檬酸根、EDTA和MoO 等阴离子的物质的量浓度之和;高浓度的NO 、SO 、Cl-和BO 等与REE络合能力弱[63];HPO /PO 和HCO /CO 浓度远高于REE浓度之和,同时其与REE的络合能力强[64]。BG11-L中与REE络合的主要阴离子是EDTA、柠檬酸根和钼酸根等,原因是EDTA等与REE的络合能力强于PO 和CO 等[9],同时其浓度之和与REE浓度之和相当。BG11-H中,Σ(HPO +CO )约为ΣREE的10倍,在此浓度条件下溶液中理应存在较高浓度的未络合REE,且根据Pearson法则[10],以+3价存在的REE为LREEs浓度高于HREEs,微生物生长时,其胞外EPS优先吸附高价REE3+。在BG11-L实验中,由于强场阴离子浓度之和远高于ΣREE浓度,溶液中以+3价存在的REE很少[65],因此即便蓝藻及EPS优先固定这部分REE,但相对于其固定的+1价REE络合物,其比例很低,这是BG11-L实验固体中未见LREEs富集的主要原因(图5)。

同样的机制也可以用于解释Ap-C、Ap-D及Fh-C实验固体中未富集LREEs的现象。在这3个实验中,REE从矿物中无差别释放,溶解态REE几乎全与阴离子络合(REE缓释导致其与CO 比值小),细胞和EPS固定少量+3价REE及大量+1价REE络合物,因此固体未出现明显富LREEs的特征。但是,在Fh-D实验中,情况有所不同:在该实验中,透析作用导致体系极度缺P,此时,蓝藻可能会分泌更多低分子量EPS和OH-等,通过竞争性络合作用促进水铁矿表面PO 及REE大量释放(图5中溶解态和固体结合态REE均是Fh-D>Fh-C),在释放的物质中既有REE3+,也可能有以EPS-REE-PO4形式存在的络合物,并且其理论上富HREEs,原因是EPS更易与HREEs络合[22-23];微生物直接利用EPS-REE-PO4形态磷,从而导致固体富HREEs。EPS优先络合HREEs,也可以从Fh-C和Fh-D实验差异推测:Fh-C中,细胞与水铁矿直接接触,细胞壁表面的EPS可以无差别络合REE,因此REE无差别释放和进入细胞中;Fh-D中,非接触作用导致EPS可以选择性络合HREEs并随同其络合的磷一起进入细胞。至于实验Ap-D未出现细胞富HREEs,主要的原因是蓝藻并非通过EPS的络合作用释放纳米磷灰石中的磷,而是通过内吞机制无差别获取其中的磷和REE[20-21]。由上述讨论可知,当磷和REE赋存于纳米矿物中时,蓝藻和EPS的作用始终会导致溶液富HREEs,但不会导致藻体和EPS明显富LREEs,是否富HREEs取决于物相种类和细胞与矿物的空间关系:当供磷和REE的矿物是纳米磷灰石时,细胞及EPS中REE无分馏;当供磷和REE的矿物是水铁矿时,细胞与水铁矿的接触作用不会导致REE分馏,EPS对HREEs的选择性络合作用会导致细胞和EPS中富HREEs。
尽管图5显示各个实验的细胞和EPS中均无MREEs,但图6~图10显示MREEs可以在EPS和次生矿物中选择性富集。总体上,丝状EPS选择性固定Sm-Gd,次生钙磷酸盐和铁氧化物选择性固定原子序数更大的Tb-Ho,2个端元的REE[La、Ce和镥(Lu)等]在所有实验中均不会被细胞、EPS和矿物选择性固定。推测出现这一现象的原因是:在所有的实验中,细胞和EPS均优先络合REE3+;REE3+被完全固定后,细胞和EPS表面还有较多基团,此时这些基团开始络合REE络合物;细胞和部分EPS固定REEs的量达到饱和后,表面未达饱和的EPS继续固定REE;具有最强REE固定能力的EPS,在整个过程中既对+3价MREEs、也对络合态MREEs产生固定作用,因此整体表现出富MREEs的特点。值得注意的是,丝状EPS(据形态推测为杂多糖)、Ca-P及放射状铁(氢)氧化物次生物相均仅在REE实验中出现,这可能是M. aeruginosa应对REE毒害效应的一种策略,通过分泌富络合基团的EPS及促进次生物相生成,将溶液中高浓度REE富集到体外,以防止其进入胞内。
4.2 REE分馏的地质及环境意义
研究发现,一些富营养化水体会出现REE的异常,如巢湖湖水富Sm、Eu和Gd[60],这可以用本研究的结果进行解释:富营养化水体中M. aeruginosa繁盛,其代谢产生的丝状EPS优先固定3种稀土,丝状EPS连同3种REE在湖泊中富集。基于这一推测,有望建立反映湖泊富营养化程度强弱的REE指标。
5 结 论
通过开展不同P和REE源条件下M. aeruginosa的生长及其对REE分馏的影响的研究,获得如下初步结论:
M. aeruginosa可以利用纳米磷灰石及水铁矿结合态磷进行生长,但生长速率有所减缓;高浓度REE对M. aeruginosa具有毒害作用。M. aeruginosa和EPS对溶液中REE3+的选择性吸附导致溶液中富HREEs,但菌体及EPS中是否相应富LREEs取决于REE与阴离子的浓度比值、REE来源及EPS作用:REE与阴离子比值高时,菌体及EPS中富LREEs,否则无分馏;REE和P均来源于矿物时,REE无分馏或富HREEs;EPS对矿物中HREEs的选择性络合作用可能会导致细胞和EPS中富HREEs。M. aeruginosa分泌的EPS和诱导生成的次生物相对MREEs-HREEs有选择性固定作用,这种作用与其表面含较多络合位有关,蓝藻作用下的MREEs-HREEs选择性富集可能具有较重要的环境意义。