


1 引 言
2009年3月,美国国家地理数据中心(National Geographic Data Center, NGDC)发布了地球磁异常[Earth Magnetic Anomaly Grid (2-arc-minute resolution),EMAG2]数据。EMAG2是由美国、德国、新西兰、加拿大、英国、挪威、俄罗斯、澳大利亚、沙特阿拉伯、法国、意大利共11个国家、23位科学家共同完成,数据融合了卫星磁测、海洋磁测以及航空磁测数据,换算高度为4 km,空间分辨率为2弧分(约3.7 km)[1]。自发布以来,EMAG2受到了广泛关注[2,3,4,5,6]。研究人员多利用EMAG2数据开展地质领域的研究,主要包括大陆边缘及大洋中脊的地质背景研究[7,8]、全球板块系统的地球动力学重建[9]、全球居里点深度模型估算[10]、大陆磁性层底界深度反演及深部结构研究[11]、盆地地壳磁性结构及居里面深度反演[12,13]、海底扩张历史重建[14,15]、海域新航空磁测工作开展的图件参考[16]。另外,EMAG2数据还被用于地磁场辅助水下潜艇导航的可行性及效果研究[17,18,19]。然而,在具有大量海洋磁测及航空磁测资料覆盖的海域,换算高度为4 km的EMAG2数据的质量高低显然对于利用EMAG2数据解决海域相关问题时存在制约。
为了评估EMAG2数据中海域资料质量,系统收集了美国海军海洋学办公室(US Naval Oceanographic Office)于1973年在Kolbeinsey脊南段地区完成的1∶500 000及1∶1 000 000航磁测量数据。本文拟基于EMAG2数据及航磁数据利用解析延拓方法计算EMAG2(向下延拓4 km)及航磁异常(向上延拓4 km),并对EMAG2与航磁异常(向上延拓4 km)、EMAG2(向下延拓4 km)与航磁异常进行对比分析,进而对北极地区Kolbeinsey脊南段EMAG2数据质量进行评估。
2 方法与技术
2.1 解析延拓
根据某观测面上的实测磁异常,换算场源以外其他空间位置的磁异常称为磁异常的解析延拓。当换算平面位于实测平面之上,称为向上延拓;反之,当换算平面位于实测平面之下,称为向下延拓。磁异常解析延拓的频谱表达式为[20]:
式中:u和v分别为x和y方向上的圆频率,z为延拓高度,i为ST(u,v,0)的异常频谱。公式(1)表明,由z=0平面上的磁场值,求出它的傅里叶变换ST(u,v,0),由它乘以延拓因子
2.2 相关分析
现象之间的相互联系,常表现为一定的关系,其中一个或若干个起着影响作用的变量用X表示,与之相关的另一现象变量用Y表示。通常用相关系数r来表征这2个量的相互关联程度。
式中:n是变量X的个数,
相关系数r的取值范围:-1≤r≤1。r>0为正相关,r<0为负相关;|r|=0表示不存在相关关系;|r|=1表示完全线性相关;0<|r|<1表示存在不同程度线性相关;|r|≤0.3为不存在线性相关;0.3<|r|≤0.5为低程度线性相关;0.5<|r|≤0.8为显著线性相关;|r|>0.8为高度线性相关。
3 对比与分析
研究区位于冰岛北部、格陵兰岛东南部海域,地理坐标为66.5º~70.0ºN,10º~22ºW,面积约193 500 km2。Kolbeinsey脊南段位于研究区中部,在海底地形上有明显的特征(图1)。研究区西部及北部航磁测线间距约为5.5 km,测线上的点距约为0.4 km,磁测比例尺为1∶500 000;研究区东南部航磁测线间距约为11.1 km,测线上的点距约为0.4 km,磁测比例尺为 1∶1 000 000,航磁测线如图1所示。尽管EMAG2数据融合了大量航磁数据,然而美国国家地理数据中心并未发布数据源的具体信息,因此不能确定研究区范围内的EMAG2数据是否包含了本次研究所用的航磁数据。为了便于数据的对比分析,本文首先基于EMAG2数据及航磁数据利用解析延拓方法计算EMAG2(向下延拓 4 km)及航磁异常(向上延拓4 km),使得EMAG2与航磁异常(向上延拓4 km)、EMAG2(向下延拓4 km)与航磁异常分别处于同一高度。然后利用相关分析方法对EMAG2与航磁异常(向上延拓4 km)、EMAG2(向下延拓4 km)与航磁异常进行相关分析,获得相应的相关系数,结果如图2和图3所示。
图1
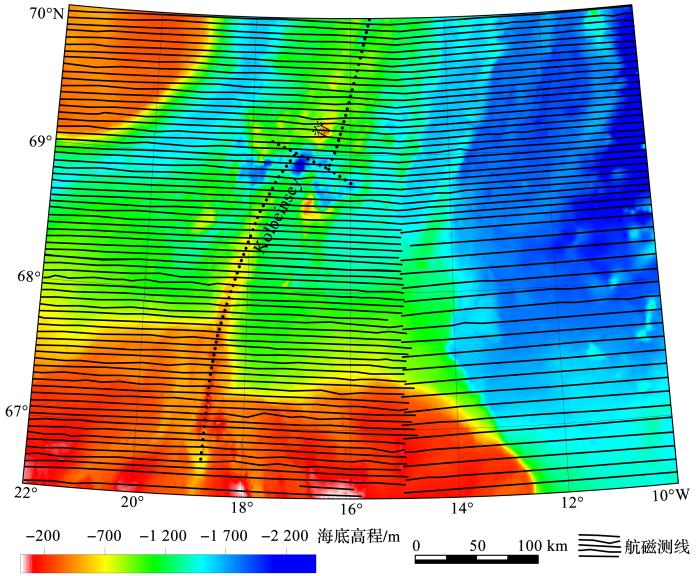
图1
Kolbeinsey脊南段海底地形及航磁测线分布图
Fig. 1
The map of seafloor topography and distribution of aeromagnetic survey lines in the southern section of the Kolbeinsey Ridge
图2
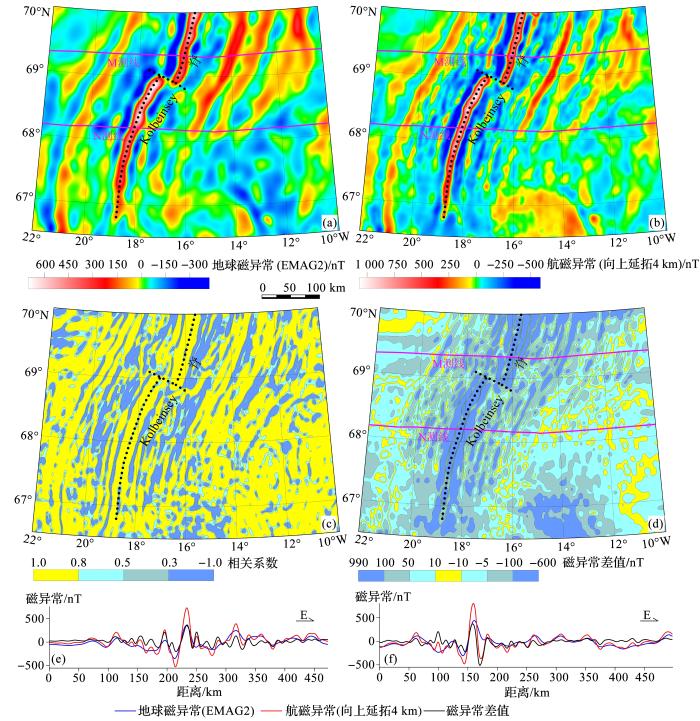
图2
Kolbeinsey脊南段磁力异常(4 km高度)及数据对比图
Fig. 2
The map of magnetic anomaly (4 km altitude) and data comparison in the southern section of the Kolbeinsey Ridge
(a)EMAG2;(b)航磁异常(向上延拓4 km);(c)航磁异常(向上延拓4 km)与EMAG2的相关系数;(d)航磁异常(向上延拓4 km)与EMAG2的差值;(e)M测线磁异常及差值;(f)N测线磁异常及差值
(a) Earth Magnetic Anomaly Grid (2-arc-minute resolution)(EMAG2); (b) Aeromagnetic anomaly (upward continuation 4 km); (c) The correlation coefficient between the aeromagnetic anomaly (upward continuation 4 km) and the Earth Magnetic Anomaly Grid (2-arc-minute resolution(EMAG2); (d) The difference between the aeromagnetic anomaly (upward continuation 4 km) and the Earth Magnetic Anomaly Grid(2-arc-minute resolution)(EMAG2); (e) The magnetic anomaly and difference of the M line; (f) The magnetic anomaly and difference of the N line
图3
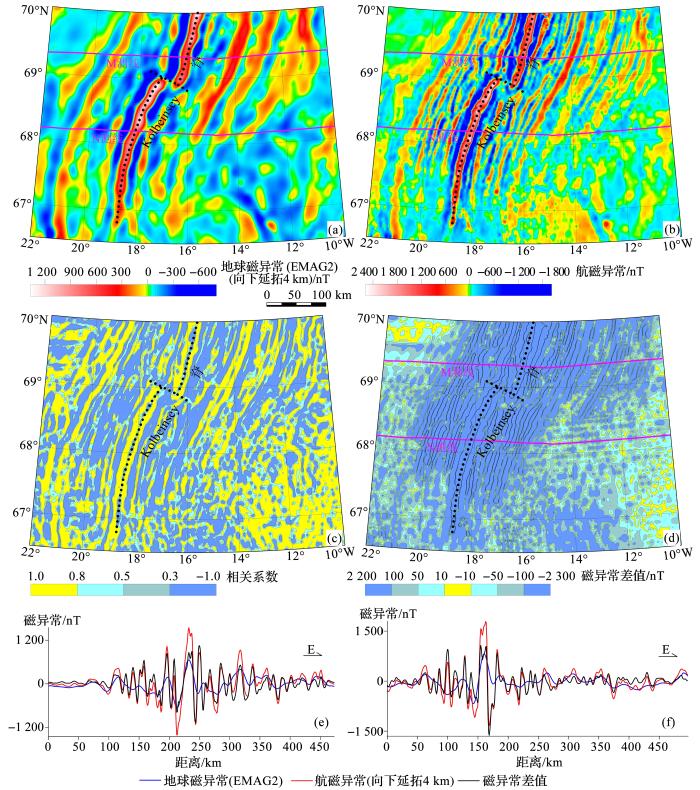
图3
Kolbeinsey脊南段磁力异常(海平面)及数据对比图
Fig. 3
The map of magnetic anomaly (sea level) and data comparison in the southern section of the Kolbeinsey Ridge
(a)EMAG2(向下延拓4 km);(b)航磁异常;(c)航磁异常与EMAG2(向下延拓4 km)的相关系数;(d)航磁异常与EMAG2(向下延拓4 km)的差值; (e)M测线磁异常及差值;(f)N测线磁异常及差值
(a) Earth Magnetic Anomaly Grid (2-arc-minute resolution)(EMAG2) (downward continuation 4 km); (b) Aeromagnetic anomaly; (c) The correlation coefficient between the aeromagnetic anomaly and the Earth Magnetic Anomaly Grid (2-arc-minute resolution)(EMAG2)(downward continuation 4 km); (d) The difference between the aeromagnetic anomaly and the Earth Magnetic Anomaly Grid (2-arc-minute resolution)(EMAG2) (downward continuation 4 km); (e) The magnetic anomaly and difference of the M line; (f) The magnetic anomaly and difference of the N line
研究区EMAG2与航磁异常(向上延拓4 km)之间存在明显的相关关系(图2a和图2b),这种相关关系在相关系数图(图2c)上亦有较为明显的显示。相关系数大于0.8的区域占总面积的60.02
本区EMAG2(向下延拓4 km)与航磁异常之间存在一定的相关关系(图3a和图3b),这种相关关系在相关系数图(图3c)上有相对应的显示。相关系数大于0.8的区域占总面积的34.43
EMAG2与航磁异常(向上延拓4 km)之间的相关系数及差值特征表明,在如本区航空磁测测线较密的海域,EMAG2数据与航磁异常(向上延拓4 km)数据差异相对较小,EMAG2数据融合了航空磁测资料,数据总体质量较高。EMAG2(向下延拓 4 km)与航磁异常之间的相关系数及差值特征表明,两者差异较大,尽管EMAG2数据融合了航空磁测资料,但是EMAG2向下延拓至海平面高度之后的数据总体质量很低,远远弱于航磁异常数据质量。
4 结 语
Kolbeinsey脊南段的数据对比与分析表明,美国国家地理数据中心发布的EMAG2数据融合了大量海域航空磁测及海洋磁测资料,在测线较密的海域,其数据质量相对较高。然而若将4 km高度的EMAG2数据换算到海平面高度的异常数据,其数据质量较低。
鉴于海域不同地区航空磁测及海洋磁测的资料分布及质量不同,在利用EMAG2数据中海域资料时,可以先在美国NGDC或在GETECH地球物理公司查询所涉及工作区的磁力资料分布情况,然后再分析该区磁力资料质量的高低。
参考文献
EMAG2: A 2-arc min resolution Earth Magnetic Anomaly Grid compiled from satellite, airborne, and marine magnetic measurements
[J].
Geodynamic reconstructions of the South America-Antarctica plate system
[J].
Models of the Earth’s lithospheric magnetic field and their applications
[J].
岩石圈磁场模型及其应用
[J].
Petroleum systems asymmetry across the South Atlantic Equatorial Margins
[J].
Derivation and error analysis of the earth magnetic anomaly grid at 2 arc min resolution version 3 (EMAG2v3)
[J].
A high-resolution lithospheric magnetic field model over southern Africa based on a joint inversion of CHAMP, Swarm, WDMAM, and ground magnetic field data
[J].
Full-fit, palinspastic reconstruction of the conjugate Australian-Antarctic margins
[J].30: TC6012
Mid-ocean-ridge seismicity reveals extreme types of ocean lithosphere
[J].
Global continental and ocean basin reconstructions since 200 Ma
[J].
A global reference model of Curie-point depths based on EMAG2
[J].
Depth to the bottom of magnetic layer in south America and its relationship to Curie isotherm, Moho depth and seismicity behavior
[J].
Crustal magnetic anomaly and Curie surface beneath Tarim Basin, China, and its adjacent area
[J].
Magnetic characteristics and tectonic implications of crust in Junggar Basin and its surroundings
[J].
准噶尔盆地及邻区地壳磁性特征及其构造意义
[J].
Review of researches on the magnetic quiet zone at the northern continental margin of the south China sea and its comparison with those in the global oceans
[J].
南海北部陆缘磁静区及与全球大洋磁静区对比的研究评述
[J].
Gravity and magnetic characteristics of the Weddell Sea and its tectonic significance
[J].
威德尔海的重磁场特征及其构造意义
[J].
A new aeromagnetic survey of the North Pole and the Arctic Ocean north of Greenland and Ellesmere Island
[J].
Simulation of geomagnetic aided submarine navigation based on EMAG2
[J].
地球磁场异常格网(EMAG2)辅助潜艇导航仿真研究
[J].
Simulation research of Earth’s gravity and geomagnetism potential field aided underwater navigation
[J].
地球重磁位场辅助水下潜艇导航仿真研究
[J].
Simulation research on gravity-geomagnetism combined aided underwater navigation
[J].
Geomagnetic Field and Magnetic Exploration
[M].
地磁场与磁力勘探
[M].
A genesis analysis of the regional gravity and magnetic anomalies in the northern part of Eastern Xinjiang, Northwest China
[J].
