
陈云浩 , 吴佳桐, 王丹丹
Chen Yunhao, Wu Jiatong, Wang Dandan
中图分类号: P422.2;TP701
文献标识码: A
文章编号: 1001-8166(2018)06-0555-13
通讯作者:
收稿日期: 2017-11-30
修回日期: 2018-04-6
网络出版日期: 2018-06-20
版权声明: 2018 地球科学进展 编辑部
基金资助:
作者简介:
First author: Chen Yunhao(1974-), male, Guzhen County, Anhui Province, Professor. Research areas include application of remote sensing in resource. E-mail:cyh@bnu.edu.cn
作者简介:陈云浩(1974-),男,安徽固镇人,教授,主要从事资源与环境遥感研究.E-mail:cyh@bnu.edu.cn
展开
摘要
地表温度反映了地球表面的能量变化与交换过程,是研究地球科学的一个重要指标。地表的几何结构和组分温度差异是地表热辐射在不同方向上存在差异性的主要原因,因此,大部分陆面都存在不同程度的热辐射方向性。介绍了广义热辐射方向性计算机模型的研究方法和研究现状,并从模型特点、模拟对象、模拟精度和时间复杂度等方面对常见模型进行评价,评述了耦合气候模型和地表热辐射方向性模型进行热辐射方向性研究中的应用情况,指出该领域尚未解决的问题并对未来的研究方向进行了展望。
关键词:
Abstract
Land surface temperature reflects the energy change and exchange process of land surface, which is an important index of the study on Earth science. The differences of surface geometrical structure and morphology are the main reasons for directional thermal radiant anisotropy. Therefore, there is thermal radiant directionality on most land surfaces in some degrees. The research methods and research status of the generalized thermal radiation directivity computer model were introduced. The common models were evaluated from the characteristics of the model, simulation objects, simulation accuracy and time complexity. The coupled climate model, the surface radiation directivity model and the application of radiation directionality were reviewed. The unsolved problems and the future research direction in this field were pointed.
Keywords:
地表温度是研究城市热环境、气候变化、植被生态和环境监控等领域的重要指标。目前,热红外遥感技术成为获取局部或全球地表温度的唯一手段。自1972年起,许多学者利用遥感技术开展了对地表温度反演模型的研究,并提出适用于不同热红外波段数据的地表温度反演算法[1]。例如,Landsat TM/ETM+数据只有一个热红外波段可选用辐射传输方程法、单窗算法和普适性单通道算法等进行地表温度反演;MODIS数据提供多个热红外波段的观测数据可以选用多通道算法或劈窗算法等进行地表温度反演。由于热红外传感器探测精度的限制以及地表复杂性的影响,地表温度的反演精度尚不能满足许多应用的实际需求。
1962年Monteith等[2]报道了关于自然地物热红外辐射亮度随观测角度而变化的现象,随后研究发现卫星在空间不同位置观测到的温度也存在较大差异(大于1 ℃),这一现象被称为热辐射方向性。随着遥感影像分辨率和质量不断提高,地表热辐射方向性已逐渐成为限制地表温度遥感反演精度提高的关键因素。目前,卫星热红外遥感获取的地表温度(Land Surface Temperature,LST)数据,虽然少数空间分辨率可达到10 m,但因其覆盖范围有限、数据获取难度较大、时间分辨率较低难以满足LST日内变化研究的需求;而近地面直接观测难以获取大范围数据,研究成本较高。因此,计算机模拟模型是当前热辐射方向性研究的重要手段。
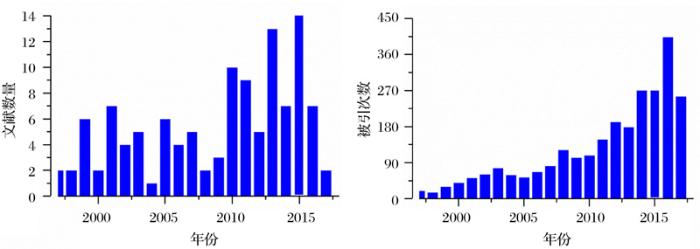
在过去20年里,这一领域已取得了巨大的成就(图1),根据Web of Science核心数据库提供的数据发现,该领域文献总量约为120篇,被引频次呈现增长趋势,其中,2015年发表文献量达到最大,2016年文献被引量达到最大。表1展示了与热辐射方向性计算机模拟有关的期刊和会议,其中国际地球科学与遥感大会(International Global and Remote Sensing Society,IGARSS)和环境遥感(Remote Sensing of Environment)会议论文量较大。相较于采用热红外遥感野外测量手段进行热辐射观测实验,计算机模拟法具有成本低、周期短、能够完整的获取模拟过程中各种所测项目指标的实时数据等优势。目前针对自然地表(如植被)构建的热辐射方向性模型很多,而因城市地表自身复杂性,模型的设计和验证难度相对较大,发展出的相关模型要少于自然地表。基于热辐射方向性计算机模型可以研究不同观测角度或不同尺度卫星平台观测的温度在时间和方向上的归一化问题,从而更好理解时空尺度上地表温度变化的规律。
图1 热辐射方向模拟领域的受关注状况
(a)每年发表的与热辐射方向性模拟有关的文献数量;(b)自1997年以来与热辐射方向性模拟
文献引用数(来自Web of Science 核心期刊,数据统计截止到2017年9月20日),文献的总引用次数为2 629次
Fig.1 Concern of computer simulation of thermal anisotropy
(a) Yearly literature count and (b) citation count related to computer simulation of thermal anisotropy, indexed by Web of Science.
The rearch was conducted in September 20,2017. The total citations are 2 629
表1 与热辐射方向性模拟有关的期刊与会议
Table 1 Relevant journals and conference proceeding that publish more than two papers related to computer simulating of thermal anisotropy
| 期刊/会议 | 论文数量/篇 |
|---|---|
| IEEE International Symposium on Geoscience and Remote Sensing Igarss | 35 |
| Remote Sensing of Environment | 25 |
| IEEE Transactions on Geoscience and Remote Sensing | 18 |
| International Journal of Remote Sensing | 8 |
| Remote Sensing | 7 |
| Journal of Geophysical Research Atmospheres | 4 |
| Journal of Infrared and Millimeter Waves | 4 |
| Agricultural and Forest Meteorology | 3 |
| IEEE Geoscience and Remote Sensing Letters | 3 |
| Advances in Land Remote Sensing System Modeling Inversion and Application | 2 |
| Applied Optics | 2 |
| IEEE Journal of Selected Topics in Applied Earth Observations and Remote Sensing | 2 |
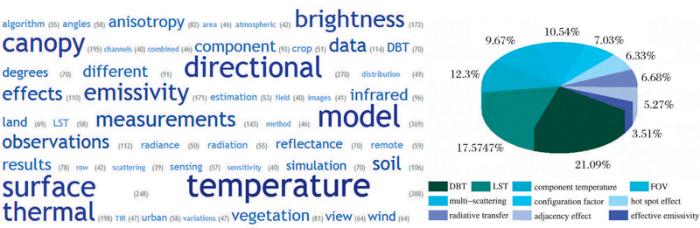
为了对广义热辐射方向性计算机模拟近20年研究状况进行概述,了解该领域研究热点,本文总结了与热辐射方向性模拟相关文献中标题、关键词与摘要的云标签图(图2a)和10个常用来表示热辐射方向性模拟的相关术语(图2b)。这些术语包括①“方向亮温”(Directional Brightness Temperature,DBT);②“地表温度”(Land Surface Temperature,LST);③“组分温度”(component temperature);④“视场角”(Field Of View,FOV);⑤“多次散射”(multi-scattering);⑥“形状因子”(configuration factor);⑦“热点效应”(hot spot effect);⑧“辐射传输”(radiative transfer);⑨“邻近效应”(adjacency effect);⑩“有效发射率”(effective emissivity)。
在广义热辐射方向性计算机模拟相关文献中,尽管使用了很多术语,但根据使用频率可以看出,该领域研究重点是方向亮温、地表温度以及组分温度。在模型模拟过程中,组分温度通常作为模型的输入参数,方向亮温则作为热辐射方向性模型模拟的结果,通过方向亮温的时空变化规律获取不同尺度的地表温度。
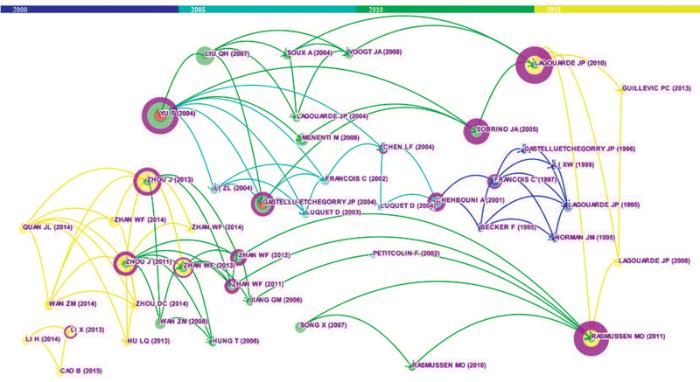
文献共被引关系图不但可以用来说明研究领域关注的热点问题,而且可以表明相关研究的继承关系,是理清某一领域研究脉络的有力工具。图3利用Citespace软件的Betweenness centrality(中介中心性)功能对广义热辐射方向性计算机模拟参考文献中的重要文献进行标注(图3中紫色圈),根据不同年份的参考文献可以看出该领域的重点研究内容从基于多角度观测进行自然地表(稀疏或稠密植被、裸土)的热辐射方向性研究[3,4,5,6]逐步发展为基于地面观测与计算机模拟研究自然地表[7,8,9,10]或城市地表的热辐射方向性[11,12]。2010年后基于真实三维结构的模拟研究热辐射方向性的文献引用量较高(图3中绿线和黄线),说明该模拟方法是热辐射方向性计算机模拟领域近年来的研究热点和发展方向。
有学者将热辐射方向性模拟模型分为几何光学模型、辐射传输模型、几何光学和辐射传输集成模型以及计算机模型。几何模型重点描述的是不同不透明几何形状的植被冠层,如立方形、圆柱形、圆锥形和椭圆形等;辐射传输模型强调的是对植被冠层元素(如叶片)吸收辐射和散射辐射的方向性模拟;计算机模型是指模拟对象对光线的作用过程的正向模拟(光子追踪法或辐射通量法计算多次散射作用)。事实上,随着计算机计算力的提高,前3类模型离不开计算机模拟,此类模型区别于更加简易的参数模型(几乎不考虑物理作用过程,仅通过数学正向和反向算法的推导描述热辐射方向性特征),可称之为广义热辐射方向性计算机模型。本文重点介绍广义热辐射方向性计算机模型的研究进展以及论述地表热辐射方向性模拟的发展方向。
图2 与广义热辐射方向性计算机模拟相关的术语云标签图及其使用频率
(a)文献中标题、关键词与摘要的云标签图,这些文献均与地表温度分解有关,字体较大的标签表明关键字的出现频率较高,标签后括号内的数字为关键字出现的频率;(b)10个表示热辐射方向性模拟相关的术语及其相应的使用频率
Fig.2 Tag cloud and usage frequency of terms related to computer simulation of thermal anisotropy
(a) A tag cloud of the literature titles, keywords and abstracts related to modeling thermal anisotropy, where a larger font denotes a higher frequency of the associated term. The number following each term is the frequency; (b) Ten key terms representing modeling thermal anisotropy and the associated percentages of utilization
图3 近20年广义热辐射方向性计算机模型的共被引关系图
文献时间总跨度1997—2017年,以5年跨度进行时间段分割;引文年轮的颜色代表相应的引文时间,一个年轮厚度和与相应时间分区内引文数量成正比;较大的节点代表较多的引用次数;颜色的连接线表示引用年份段
Fig.3 Co-cited relationship of computer simulation of thermal anisotropy in recent 20 years
Literatures are divided into five time slices from 1997 to 2017. The color of the citation ring represents the corresponding citation time, and an annual ring thickness is proportional to the number of citation in the corresponding time zone. Larger nodes represent more citations, and colored links indicate the year of reference
由于普遍存在的非同温混合像元,且地物的发射率会随观测角度发生变化,因此通过传感器接收到目标地物的热辐射量反演得到的地表温度并不是真实的地表温度,而是某个观测方向上的辐射温度。地表各方向热辐射差异性的成因可归纳为以下3点:
(1)地表发射率的方向性
地球表面的真实地物并不是黑体,其本身的发射率具有方向异质性。对于光滑的电介质表面,其比辐射率随观测角度增加而略有增加,到达布儒斯特角时达到最大,然后迅速减小;孙灏等[13]基于实测的地表组分温度和CoMSTIR模型模拟传感器多角度观测发现,城市地表的城市地表等效发射率方向性变异 (Urban Surface Emissivity Anisotropy,USEA)参数具有热点效应[13]。
(2)多次散射的影响
多次散射的影响主要来自于2个方面:①由于地表的复杂性,光线与地物间的物理作用,增加某些方向的辐射能。因此,即便材质相同但三维结构不相同的地表,从不同角度观测到的辐射能也有很大差别。②由于目标地物与传感器之间的大气对光的散射作用,削减或增加不同传感器接收到的辐射能。
(3)地表组分差异
地表的组分包括人工构筑物、植被、水体、裸土等,这些组分不仅自身组分温度可能相差很大,而且本身的发射率也表现为各向异性,因此传感器从不同角度观测时,各组分对辐射能的贡献也不相同。
在模型设计中,由于组分发射率方向差异性研究难度较大,所以模型大多没有考虑各组分发射率的各向异性,而是假设物理模型的发射率各向同性。针对多次散射的情况,真实结构三维模型主要通过采用模拟蒙特卡罗法,依据统计传感器中接收到的追踪光子量得到某一方向上的亮度温度。在模拟大气散射的过程时,通常只考虑水蒸气对光的散射。针对地表组分不一问题,真实结构三维模型主要通过采用辐射度法,根据不同投影法,计算形状因子,通过判断面元的可见状态,结合输入的组分温度,求解辐射方程组得到目标的方向亮温。针对模拟场景以及研究问题的不同,组分温度的分类也有很大差别。一般热辐射方向性模拟模型根据地表覆盖类型和光照阴影情况进行组分分类,考虑到自然地表和城市下垫面的情况不同、组分内温差大小以及组分分类方式的复杂度对模拟模型的影响,表2给出了几种典型的组分分类方案。
表2 4种典型的组分分类方案
Table 2 Four typical component classification methods
| 实验区域 | 类数 | 组分分类方案 | 评价 | 代表性文献 |
|---|---|---|---|---|
| 自然地表 | 4 | 光照(阴影)植被、光照(阴影)裸土 | 方案是常用组分温度分类方法,可以满足森林热分布的描述,但均匀植被有时也会被分为数目不等、平行的等温层进行研究 | [4] |
| 城市区域 | 5 | 光照(阴影)墙面、光照(阴影)地面、屋顶 | 方案针对最简单的城市地表,且未考虑各方向的墙面温度差异,导致同一组分内温差较大 | [11] |
| 8 | 南墙、其他墙面、窗体和屋顶、光照(阴影)沥青路面和砖地、光照草地和树木、阴影草地 | 方案反映了城市区域下垫面组分温度分类的真实情况,但过于复杂,难以应用于城市目标方向性模拟模型 | [14] | |
| 13 | 光照(阴影)地面、光照(阴影)东墙、光照(阴影)西墙、光照(阴影)南墙、光照(阴影)北墙、光照(阴影)草地、光照屋顶 | 方案假设屋顶为恒定的光照状态,保证了各组分内温差低于2 ℃,较为符合实际情况,可以应用于城市目标方向性模拟模型,而且在东墙和南墙温差不大时,可以归为一类 | [15] |
本文基于几何光学原理、辐射传输理论以及计算机图形学等理论基础,将广义地表热辐射方向性计算机模型分类为几何光学模型、辐射传输模型以及集成模型。
3.1.1 模拟方法
GO模型将物理模型离散化成多边形面元,赋予每个独立面元(组分)温度和发射率,假设传感器接收的辐射量是视场内面元辐射出射度的总和,计算组分权重,根据传感器在某一时刻观测方向接收的瞬时辐射能量,计算地表目标观测方向的亮度温度,进而用以研究相关问题。因此,该模拟过程简化为以下3个步骤[15]:
(1)组分的辐射出射度
由于模拟对象并非黑体,根据Stefan-Boltzmann定律,每种组分的辐射出射度可以表示为:
Mk=εkσ
式中:Mk为组分k在热红外波段的辐射出射度,单位为W/m2;εk为对应波段的发射率;σ为斯特藩—玻尔兹曼常数,取值5.67×10-8 J/(S·m2·K4);Tk为组分k的组分温度。
(2)传感器观测到的辐射能
在近地观测时,传感器视场内,传感器接收到的热辐射量可以简单表示为:
Lfov=
式中:Lfov为传感器接收的辐射量;n为组分类别数;fi为第i个组分在视场内所占权重,各组分所占比例和为1;Li为第i个组分的辐射量。
(3)观测方向上的亮度温度
根据Planck定律,观测方向上的辐射亮度温度可以表示为:
B(θ,φ)=
式中:θ和φ分别为传感器所在位置的天顶角和方位角;Lfov(θ,φ)为传感器接收到的辐射量;σ为斯特藩—玻尔兹曼常数,取值5.67×10⁻⁸ J/(S·m2·K4)。
3.1.2 研究现状
几何(光学)模型多采用平行投影法,即传感器对地面所有物体的观测角度是相同的,最初的几何光学模型无法定量地模拟植被冠层间隙率、多次反射和散射效应,通常该模型在应用时会将模拟对象简化为相似规则的几何体。对于规则垄行结构的农作物,最早的几何模型是将其近似为实心的无限长箱体,用于模拟地表的任意观测方向的热辐射量[4];扩展的几何模型将目标简化成规则几何体,如将离散植被冠层简化为椭球体、球体或锥体[16,7,17];在研究尺度较大时,植被和周边地表像元混合现象会影响模拟的精度, Cao等[18]则针对连续作物和道路的混合场景,通过区分模拟对象长度、宽度和方向来计算作物和道路区域的温度, 并用黑河流域多角度的热红外机载数据(分辨率90 m×90 m)验证其模拟精度。对于典型城市地表,简单几何模型将其简化为矩形的无限长的箱体[14],并在该思想下将城市建筑简化成长方体或正方体[11,15]。由于几何光学模型在野外观测时具有视场效应,例如,基于CoMSTIR模型的研究发现在地面观测和卫星观测的过程中,观测距离、角度(天顶角和方位角)的不同会影响地面目标各组分在视场内的面积比例(权重),当且观测距离小于800 m时,传感器观测结果具有视场效应[19],所以几何(光学)模型适用于模拟传感器在无穷远处对地观测的情景(如航天卫星搭载的传感器),不适用于模拟低空传感器或者近地面宽视场角传感器的情景(如机载的传感器或地面红外热像仪)。几何(光学)模型不能表达复杂地表,只能用于模拟简单自然地表,由于未考虑冠层内的多次散射,时间复杂度相对简单。
3.2.1 模拟方法
平行平面的辐射传输模型可以较为准确和简单地表达真实地表辐射传输过程, 迅速应用于植被遥感中[20]。辐射传输模型的基础和核心是辐射传输方程,以模拟植被冠层最有代表性SAIL模型为例,在研究对象为郎伯体的假设下,计算了光线沿太阳光入射方向和观测方向这2个方向的传输, 并用上行辐射通量和下行辐射通量来近似计算冠层内部散射光的传输,RT模型注重植被层间发生的物理过程,该模型需要假设层间同质,输入结构参数,如植被的叶密度(Leaf Area Density,LAD)分布或叶面积指数(Leaf Area Index,LAI)、叶倾斜分布函数(Leaf Inclination Distribution Function,LIDF)等,同时也需要不同层温。RT模型可以看作是4个“等效通量”(太阳水平方向上的入射通量、上行辐射通量、上行辐射通量和观测方向上的太阳辐射通量)间的相互作用,且等效通量仅取决于LIDF、叶片的光学属性和观测方向[8]。
3.2.2 研究现状
由于连续植被辐射传输方程的复杂性(需要确定相位函数和边界条件),到目前尚不能获得RT方程的严格解析结果, 只有采用近似解法,常见的主要有K-M方程、SUITS模型和SAIL模型。最早应用于辐射传输方程模拟冠层植被的是SUITS模型,该模型的思想是把冠层元素(叶、树干、花、穗等)均匀投影在三维空间中,叶片对光任意方向的总作用量(散射、吸收和透射)以其投影面积来判断, 同时在假设叶片的反射和散射均具有漫反射特征前提下计算散射和消光系数[21]。基于该模拟思路发展的SAIL模型是通过叶子任意方向的投影面积判断叶片对光的作用, 即考虑了植被的LAI和LIDF等结构参数,因此会缓解二向反射出现拐点的现象[22]。不过,该原始的SAIL模型还不能很好地应用于热红外波段。目前基于SAIL模型的模拟思路发展了一些新的模型,对热红外波段模拟和组分分类方法进行了改进[23,24]。为解释不连续植被的热红外遥感数据,研究者们提出了一些三维热辐射传输模型,这些模型将物理模型的单个离散像元命名为“细胞”(cell)作为对地表相同光学参数和结构参数的统计单位结构,其构建的先决条件是假设模型内所有“细胞”对光的辐射传输为均匀分布[25]。该类模型针对模拟对象尺度发展了不同的模型,如适用于模拟大范围的地表(森林)的TRGM模型(Thermal Radiosity-Graphics Model)[26]和中小尺度地表(农作物冠层和建筑群)的DART模型(Discrete Anisotropic Radiation Transmission Model)[27,28]。
3.3.1 模拟方法
结合几何光学方法和辐射传输方法的优势可发展更为实用的模拟地表热辐射方向性的方法,本文将基于该类模拟方法构建的模型称为集成模型。几何(光学)模型简化了模拟对象的几何结构,可以较好地模拟不连续植被和粗糙地表,但没有考虑模拟区域中发生的多次反射。辐射传输模型考虑物理模型内的多次散射,可以较好地模拟植被地表,但由于模型结构的复杂性,不易建立植被特征和热辐射方向性间的解析表,因此充分利用二者优势的集成模型既将物理模型简化为规则几何体同时也考虑这些几何体间的多次散射或反射。
3.3.2 研究现状
随着国内外学者对地表热辐射方向性模拟研究的重视程度日益增加,常用的几何(光学)模型一般会结合一定的辐射传输理论来解决该领域问题。间隙率模型是最早出现的集成模型,该模型集中了2种模型在不同尺度中地表模拟的优势,考虑几何体形成的阴影面积和植被间发生的多次散射,但模拟对象设定为均匀介质[14];BIGAR模型虽然可以弥补间隙率模型的不足,可以用来模拟非均匀植被,但模拟过程复杂和较多的初始参数增加了实际应用的难度[29];行播结构孔隙率模型在Kimes模型的基础上, 基于离散体孔隙率模型思想[30]和连续植被的交相关概率思想[31]建立的集成模型,其对冬小麦不同生长期的模拟效果优于Kimes模型[32];修正FR97模型在FR97模型的基础上改进土壤组分的分类[10]。为满足模拟对象的物理模型更加真实以及三维空间内热辐射方向性的研究,集成模型在发展中更加注重非均一植被冠层三维结构的刻画以便更容易准确地反应热辐射方向性的变化,如RARID模型[33]、非均一冠层热辐射方向性三维模型[34]和土壤—叶子—麦穗混合方向亮温模型(SLEC DBT)[9]。
本文从模型设计特点、模拟对象、模拟精度以及适用条件对上述3种广义地表热辐射方向性模拟的代表性模型进行综合评价(表3)。
表3 地表热辐射方向性模型对比
Table 3 Comparison of surface thermal anisotropic model
| 模型名称 | 模型特点 | 模拟对象 | 模拟精度 (验证数据) | 评价 | 代表性文献 | |
|---|---|---|---|---|---|---|
| 几何光学 模型 | Kimes模型 | 模拟对象简化为实心的无限长箱体 | 规则垄行结构的农作物 | RMSE=1 ℃(土壤) RMSE=2 ℃(棉花) (垂直投影棉花覆盖 率48%的实测数据) | 考虑了影响棉花热辐射方向性的主要因素, 即行结构和投影关系 | [4] |
| SUM | 假设城市建筑物稀疏排列,计算离散面元形状因子,组分权重为视场内组分所占面积比例 | 城市简化地表 | RMSE=3.8 ℃ (加拿大温哥华航空飞行数据) | 获取的组分比例相较于平面投影精度更高,忽略多次散射效应,且计算量与场景内面元数成正比,适用于小范围建筑等辐射发射难以穿透的介质的模拟 | [11] | |
| CoMSTIR | 模拟13种组分温度,基于SUM模型思路计算组分权重内置四种投影算法:辐射度、球面、水平面和中心投影 | 城市地表 | AE<1.6 ℃ (北京北师大房山实验基地实测数据) | 模拟城市目标在任意方向的方向亮温,使用灵活方便,但尚不能建立城市植被的真实场景进行模拟 | [18] | |
| MGP | 将树冠简化为椭球,利用LAI量化树冠内部空隙,运用布尔模型计算孔隙率,并计算场景中树冠的各组分比例 | 简单形状树冠 裸土 | RE<2% (非洲南部的热带稀疏大草原的实测数据) RMSE=0.781 ℃ (DART模型结果) | 模型中的几何模型过于简化,树冠光照方向和观测方向投影重叠面积计算难度大 | [7] | |
| MGP (2014) | 积分计算单棵树冠投影面积以及光照方向和观测方向投影重叠面积 | 各种树冠形状 裸土 | RE<0.25% (原始MGP模型) | 计算速度相较于原始MGP有所提高,但仍无法应用于复杂地表的表达 | [15] | |
| MGP (2014) | 考虑混合像元的LST是道路和农作物共同作用产生 | 连续农作物 道路,裸土 | AE<1.1 ℃ (黑河流域机载热像仪数据) | 相较于原始MGP在特定场景下处理更加细致 | [16] | |
| CLAMP-GO模型 | 基于GO理论,三维结构组分温度通过在冠层方向上的面积比例和组分温度的乘积计算方向亮温 | 植被冠层 | — | 基于CLAMP模型,植被三维结构构建简单;可以应用于全波段(可见光—近红外和热红外波段)辐射方向性模拟 | [35] | |
| 辐射传输 模型 | TRGM | 基于热辐射理论和植被冠层发射率方向性,可模拟面元热辐射和多次散射效应,考虑了三维冠层结构、植被的影响、组分温度分布 | 所有地表 | RMSE ≈0.52 ℃ (法国南部地区地面观测数据) | 输入参数较多,模拟面元相对精细,大场景应用时计算量大,应用难度较大,适用于模拟微尺度结构,且冠层结构对精度影响较大,而叶片大小和形状影响较小 | [26] |
| SAIL扩展模型 | 考虑了植被和土壤温度的差异性(阴影土壤、光照叶片、阴影叶片) | 稀疏植被 | RMSE=1.25 ℃ (DART模型结果) | 可以模拟多个非均匀同质冠层的发射和散射 | [24] | |
| 植被冠层 三维辐射 传输模型 | 基于辐射传输机理,以“微分体元”为辐射传输计算基准,考虑体元内和体元间的多次散射 | 植被 | RMSE(生长拔期)=0.4 RMSE(灌浆期)=0.44 (北京小汤山精准农业 基地冬小麦数据) | 主要考虑辐射传输过程,但未考虑热红外复杂的辐射平衡或热交换过程 | [23] | |
| DART | 基于光子追踪法,模拟TIR(热红外)的辐射能量平衡和上行的方向分谱辐射 | 所有地表 | AE<1.2 ℃ (行种棉花冠层实测 亮温数据) | 考虑光子多次散射效应和穿透性,但输入参数较多,计算时间复杂度大,适用于地面小范围模拟 | [27,28] | |
| DART (2015) | 增加了透视投影功能 | 所有地表 | — | 适用于各种传感器角度和视场类型 | [36] | |
| 集成模型 | 修正FR97模型 | 改进了FR97(的组分分类方法,对原来土壤组分温度重新划分为光照土壤和阴影土壤 | 植被冠层 | RMSE=0.72 ℃/1.55 ℃/2.73 ℃(黑河流域玉米区域的叶子、光照土壤和阴影土壤3种组分温度的实测数据)RMSE=0.5 ℃/0.65 ℃(4-SAIL和TRGM对应的模拟数据) | 可用于模拟连续冠层、非连续作物和森林 | [10] |
| 冠层热辐射 三维模型 | 观测几何参数对离散面元间多次散射及发射辐射传输计算, 积分运算冠层面元在半球空间上对观测方向上的热辐射 | 植被 | RMSE=0.31 ℃ (河北省怀来实验场测量的玉米热红外多角度数据) | 用理念株刻画模拟对象,可模拟不同浓密程度的植被 | [34] |
续表3
| 模型名称 | 模型特点 | 模拟对象 | 模拟精度 (验证数据) | 评价 | 代表性文献 | |
|---|---|---|---|---|---|---|
| 集成模型 | 简化的几何光学 和辐射传输模型 | 冠层的几何结构简化为一组具有矩形截面的立方体 | 垄行农作物 | AE<2 ℃ (法国南部地区地面观测数据) | 忽略视场中混合放射率和组分放射率的 不同 | [37] |
| SetHy-DART 耦合模型 | 考虑了像元和组分内存在温度的不均一性 | 土壤,农作物 | RMSE≈1 ℃ (法国北部和东南部 混合农作物种植区域) | 模拟精度优于DART单独使用,模型复杂,使用难度高 | [38] | |
| SLEC DBT 模型 | 考虑植被微结构特征对传感器观测的方向亮温影响 | 土壤叶子麦穗 | RMSE=0.781 ℃ (北京小汤山热红外成像仪数据) | 针对某种特定需求,适合模拟小场景的微结构变化 | [9] | |
| RAPID模型 | 基于RGM模型和TRGM模型开发的3D计算机模型,兼具光学、热红外和激光雷达模拟能力 | 所有地表 | — | 基于RT理论,计算冠层多次散射,因合理简化真实三维结构,可用于大场景模拟 | [33] |
几何光学模型通常用来模拟植被冠层与裸土,未考虑层间散射,模型时间复杂度相对较低;辐射传输模型通常用来模拟植被冠层元素间的物理作用过程(散射和吸收),模拟结果与LAI和LIDF较强的相关性,模型时间复杂度相对较高;集成模型结合了几何光学模型和辐射传输模型的优点,但模拟场景有一定针对性。广义热辐射方向性计算机模型在发展中逐渐重视模拟对象的三维结构,比如植被各层的LAI或是LAD、建筑的高度和间距以及不同深度土壤的属性,且模拟对象中自然地表远多于城市地表。当前已有的热辐射方向性模拟模型已经可以很好地为地表热辐射方向性提供研究手段,但依然存在以下待解决的问题:
(1)气候因素的影响
热辐射方向性模型几乎没有考虑研究对象所在研究区的真实气候条件。一方面气候条件(如风速)会对研究对象与大气的热交换产生影响,进而影响模拟实验的结果;另一方面气候因素(风速、湿度和气温等),会在一定程度上干扰遥感平台上搭载的热红外传感器接收到的辐射能,从而对模拟实验的结果产生影响。
(2)组分分类的影响
在计算机模拟中,输入参数(文件),如组分温度,会对模拟结果产生很大影响[39],干扰研究结论。有时组分内存在不可忽略的温差,比如相同光照条件的高层建筑墙体在不同高度上会存在几度的温差,因此不合理的组分分类方法会对模拟结果产生影响。
(3)输入参数的获取问题
除了研究热辐射方向性在空间上的分布规律,其在时间序列上的变化规律研究也是急需解决的问题。计算机模拟在解决这一问题时,往往需要输入地面观测得到的时间序列组分温度,直接提高了研究的经济和时间成本。
(4)研究尺度与模拟精度间的平衡问题
地表的几何结构和形态在不同尺度上会表现出异质性,而地表的形态和几何结构又是引起热辐射方向性的原因之一,因此,热辐射方向性的尺度效应具有一定的研究价值。在模型模拟不同尺度场景时,为保证模拟时长,在提升模拟尺度的同时会增大离散后的面元面积,可能会导致组内温差增大,降低模拟精度。
广义热辐射方向性计算机模型发展过程中,模拟对象的物理模型由一维几何形状和二维几何体(如植被冠层形状相同,空间分布均一或满足一定的分布函数等)逐渐转变为可以表达地表真实几何形态的三维结构。计算机可视化和计算能力的提高和热辐射方向性研究对地表真实结构的需求使基于真实三维结构的计算机模拟手段成为该领域的发展趋势。该模拟方法大多会考虑热辐射在建筑物间的(多次)物理作用或植被冠层内的散射效应和穿透性。在对真实三维结构地表模拟时,往往基于辐射通量法(Radiosity)或蒙特卡罗光子追踪法(Monte Carlo Ray Tracing,MCRT)结合几何光学理论与辐射传输理论进行模拟[40],如DART模型、TRGM模型和CoMSTIR模型等,但该类模型的初始化需要地表结构(因此模拟时植被的不同高度LAI或LAD、建筑的密度和高度、多层土壤结构)、光学特征(发射率、反射率、吸收率、透射率)及其他参数的支持,输入参数较几何(光学)模型和辐射传输模型更为复杂。另外,在进行模拟时,模型需要对场景进行像元分解,时间复杂度与像元数量和场景维度数有关,即分解像元面积设置越大,场景维度越低,模型运行速度越高。
当前构建的大多数地表热辐射方向性模拟模型,离真正用于遥感反演尚存在较大距离,这种距离主要源自于地表温度本身在时间维变化迅速,具有显著的日变化特征。地表组分温度及热辐射方向性特征均随时间变化, Chehbouni等[41]通过对半干旱草原冠层的热辐射方向性随季节变化的研究,发现观测方向在0°(天顶方向)和55°时亮温的差值可达5 ℃,而且这种差异呈现季节性变化。Guillevic通过棉花冠层日内热辐射方向亮温的研究,发现6:00和13:00的方向亮温相差2~3 ℃[42]。Krayenhoff等[43]通过模拟街区冠层日内方向亮温和局部气候分区(Local Climate Zone,LCZ)的关系,发现观测时间(太阳高度角)的不同可以导致3%~13%的温度差异。以MODIS/LST 数据为例,尽管在全球的大多数地区,每日拥有4次地表温度观测。然而,这4次观测除了观测角度相异,观测时间也不尽相同。与反照率不同,地表结构和物理属性并非是决定地表温度的唯一因素,外在的气候气象背景亦扮演了重要的角色。因此,建立一个既顾及地表温度在时间维迅速变化,又考虑遥感地表温度的方向性变化的热辐射方向性模型,显得十分迫切。
地面实验的开展受到时间和实验条件等限制,且价格昂贵。近些年,将微气候模型与地表热辐射方向性模型结合成为热辐射方向性模拟的发展趋势之一。这种研究方法不仅考虑了气候对实验的影响,还很大程度上缓解了实验数据的局限性对研究结果的影响。目前,已有一些学者应用该方法开展自然地表的模拟研究。例如,耦合小气候模拟软件Envi-met和三维辐射度模型RAPID对遥感观测林冠温度的角度效应进行动态模拟研究,实现了林冠方向亮温的连续模拟[44];耦合小气候模型CUPID(SVAT(Soil-Vegetable-Atmosphere Transfer)模型中的真实结构计算机模型RGM (Radiosity-Graphics Model)分别模拟小麦的组分温度和方向亮温,以线性近似算法纠正了因时间效应产生的误差,发现方向亮温时间的不同是导致组分温度时间差异的主要影响因素[45];耦合CUPID模型和TRGM对三角型叶片和行种玉米与小麦进行方向亮温的模拟,分析了热辐射热点的分布特征[46]。目前该方法在城市地表热辐射方向性的研究中也有少量的应用。例如,耦合局部气候模型TUF3D (three-dimensional microscale urban energy balance model)与目标热辐射方向性模型SUM来模拟城市下垫面各方向热辐射情况,该研究通过改变模拟场景,比如下垫面形态(包括建筑高度/建筑间距、建筑密度以及建筑朝向),太阳高度(研究区所在的纬度),下垫面属性(是否移除建筑),模拟4种“当地气候区”进而对有效热辐射方向差异的大小和成因进行讨论分析[43]。
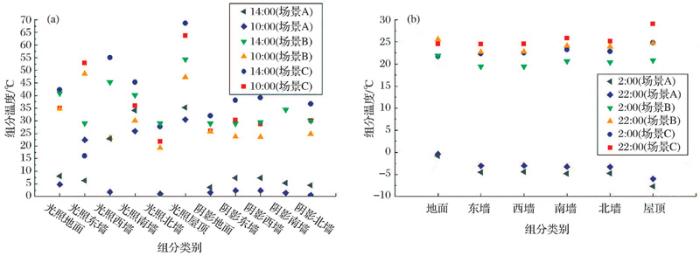
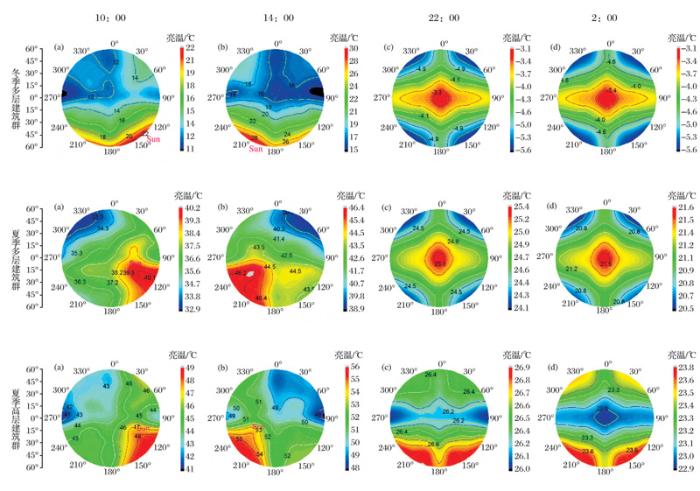
本文以耦合Envi-met模型和CoMSTIR模型探究太阳高度角和建筑形态2个因素对半球空间内城市热辐射方向性影响的实验,介绍耦合模型的应用过程。实验设计了3种场景(场景A:夏季高建筑群场景;场景B:夏季低建筑群场景;场景C:冬季低建筑群场景),其中,用季节参数代表太阳高度角变化,以建筑高度代表建筑形态变化,物理模型包含以行列排列的23栋建筑。模拟时间选择白天10:00和14:00,夜晚22:00和2:00共4个时刻,在半球空间内,传感器高度设定为1 200 m,传感器位置选择0°~360°范围内的8个方位角(东—西方向、南—北方向、东北—西南方向和东南—西北方向),0°~60°范围内每隔15°的5个天顶角。应用耦合模型模拟方向温度包括2个步骤:①利用微气候模型的模拟结果根据热辐射方向性模型中的组分分类方式整理得到各组分温度(图4);②以①中的组分温度初始化热辐射方向性模型,根据模拟结果整理得到的方向亮温。图5以为极化图(天顶角为极径,方位角为极角)的形式展现分别3种场景在4个时刻上方向亮温的分布情况。
根据实验结果,可以发现热辐射在空间分布上呈现较强的方向性,白天(10:00与14:00)热辐射方向性空间分布与太阳位置关系密切,热点位置(方向亮温最高值)出现在太阳附近。白天热辐射方向差异性明显高于夜晚(22:00与2:00),且方向性对传感器天顶角的敏感度高于方位角。白天季节因素对热辐射方向性的影响表现明显,夜晚建筑形态因素对热辐射方向性的影响表现明显。图5中热辐射方向性的分布图清晰表达了2个因素的影响性,表明了耦合模型的研究方法可以不受观测环境的影响和实验成本的限制,在城市日内热辐射方向性研究领域中有着良好的应用前景。
图4 不同场景的组分温度分布情况
场景A:冬季多层建筑群场景;场景B:夏季多层建筑群场景;场景C:夏季高层建筑群场景;(a)和(b)分别为白天(10:00,14:00)与 夜间(22:00、2:00)各组分在3种场景中的温度值
Fig.4 Distribution of component temperatures at different times in three scenes
Scene A:Multi-storey buildings in winter; Scene B: Multi-storey buildings in summer; Scene C: Multi-storey buildings in summer. (a)Component temperature value in the daytime(10:00,14:00) and (b) Component temperatures in the daytime the nighttime(22:00,2:00) in the three scenes
图5 不同场景的方向亮温在半球空间上的分布情况
Fig.5 Distribution of the directional bright temperature in different scenes
在过去20年有关热辐射方向性计算机模拟的研究中,研究对象由自然地表逐渐发展为所有地表,计算机模拟更注重构建物理模型的三维几何形态和模拟热辐射传输过程中的散射作用。本文依据模型的研究方法,将广义热辐射方向性计算机模型归纳为几何(光学)模型、辐射传输模型、集成模型。其中,几何(光学)模型可用来模拟植被冠层与裸土,未考虑层间散射,模型时间复杂度相对简单;辐射传输模型考虑了冠层间的多次反射和散射;集成模型基于几何光学理论和辐射传输理论,结合2种模型的优点,但研究场景具有针对性。
基于地表真实三维结构的计算机模拟方法是热辐射方向性模型发展的趋势之一。该方法可适用于所有地表类型的三维真实结构模拟,且考虑模拟对象间的散射作用,具有一定的普适性,不过模拟初始参数相对较多,需要实测数据的辅助。
耦合气候模型和热辐射方向性模型是热辐射方向性计算机模拟的趋势之一,这种研究方法相较地面测量,解决了模型组分温度数据获取的诸多不便,同时考虑了气候环境因素的影响,具有成本低、周期短、完整获取模拟过程中的实时数据、趋真性强等优势,对研究高时间分辨率的热辐射方向性变化规律具有重要意义。
综合先前研究者们的研究成果,作者认为应在以下几个方面开展进一步的研究:①平衡研究尺度与组分分类间的关系,避免研究尺度太大导致组分温差过大,影响模拟精度; ②城市地表的热辐射方向性模拟应更加注重建筑真实场景的模拟;③自然地表的热辐射方向性模拟常因地球表面植被区域太大而导致计算机模拟速度慢,因此模拟该类地表的模型在设计时需要考虑在精度和效率之间找到平衡点;④发展交互性能更好的耦合模型,将气候模型内嵌到热辐射方向性模型,使前者气候模型模拟结果可自动应用到后者的模拟中,降低时间成本。
The authors have declared that no competing interests exist.
| [1] |
Hourly variation of surface urban heat island over the Yangtze River delta urban agglomeration [J].长三角城市群表面城市热岛日内逐时变化规律 [J].
表面城市热岛多时间尺度变化的遥感研究已取得了阶段性进展。然而,受限于热红外遥感模型与数据的不足,目前典型城市群表面城市热岛的日内逐时变化规律仍不清楚。以MODIS(Moderate-resolution Imaging Spectrometer)遥感影像为主要数据源,结合地表温度日内变化INA08模型,率先模拟并分析了长三角城市群在夏、冬两季的表面城市热岛空间格局与热岛强度的逐时变化特征。结果表明:在夏季,日内所有城市整体而言均呈现热岛效应,但由于城市植被或水体的降温作用,白天至上半夜(08:00~21:00)部分城市存在相对“冷点”,而这些“冷点”在21:00之后基本消失。此季节内城市热岛强度与地表温度日内逐时变化规律相似,两者均在上午迅速上升,并于12:00~14:00到达峰值,而后逐渐下降,并持续至次日日出前。在冬季,多数城市在白天出现了“城市冷岛”,但“冷岛”多在午后至傍晚(14:00~17:00)消失,此后所有城市均恢复为“热岛”。此季节内城市热岛强度与地表温度日内逐时变化规律区别较大,且以农田和森林为背景计算的城市热岛强度的逐时变化趋势存在明显差异,前者在日内到达峰值的时间(约18:00)显著晚于后者(约13:30)。
|
| [2] |
Radiative temperature in the heat balance of natural surfaces [J]. |
| [3] |
View angle effects in the radiometric measurement of plant canopy temperatures [J].
The thermal infrared sensor response from a wheat canopy was extremely non-Lambertian because of spatial variations in energy flow processes; the effective radiant temperature of the sensor varied as much as 13掳C with changing view angle. This variation of sensor response was accurately quantified (root-mean-square of deviations between theoretical and measured responses reduced to 1.1掳C) as a function of vegetation canopy geometry, vertical temperature distribution of canopy components, and sensor view angle. The results have important implications for optimizing sensor view angles for remote sensing missions.
|
| [4] |
Dynamics of directional reflectance factor distributions for vegetation canopies [J].
Directional reflectance factors that span the entire exitance hemisphere were measured for vegetation canopies and bare soils with different geometric structures. Two spectral bands were used鈥擭OAA 6/7 AVHRR bands 1 (0.58鈥0.68 渭m) and 2 (0.73鈥1.1 渭m). Geometric measurements of leaf orientation distributions were taken when possible, and other structural and agronomic measurements were collected. For each cover type, these data were taken several different times on a clear day. Polar coordinate system plots of directional reflectance factors, along with 3-D computer graphic plots of scattered flux, were created. These field data were used in conjunction with literature data to study the dynamics of the directional reflectance factor distribution as a function of the geometric structure of the scene, solar zenith angle, and optical properties of the leaves and soil. Physical mechanisms causing the observed dynamics were proposed and were supported by a number of field and modeling studies. For complete homogeneous vegetation canopies, the major trend observed at all sun angles and spectral bands was a minimum reflectance near nadir and increasing reflectance with increasing off-nadir view angle for all azimuth directions. This trend is well known in the experimental and theoretical literature and is caused by the shading of lower canopy layers by components in the upper layers and by viewing different proportions of the layer components as the sensor view angle changes. In some cases the reflectance minimum was shifted slightly off-nadir in the foward scattering direction. The reflectance distributions tended to be azimuthally symmetric because the leaf transmittance was nearly equal to the leaf reflectance for most wavelengths. For sparse homogeneous canopies the anisotropic scattering properties of the soil significantly influenced the observed directional reflectance in the visible band. Soils have strong backscattering characteristics which can dominate the observed reflectance distribution for sparse canopies and small solar zenith angles. This knowledge is important in interpreting aircraft and satellite data, where the scan angle varies widely and can have different orientations with respect to the sun. Finally, the measured data and knowledge of the mechanics of the observed dynamics of the data can provide rigorous validation and verification tests for theoretical radiative transfer models.
|
| [5] |
An experimental study of angular effects on surface temperature for various plant canopies and bare soils [J]. |
| [6] |
Directional anisotropy of brightness surface temperature over vineyards: Case study over the medoc region (SW France) [J]. |
| [7] |
Modeling the observed angular anisotropy of land surface temperature in a Savanna [J].
Several recent studies have found that retrievals of land surface temperature (LST) from remote sensing measurements depend upon the angle of observation. To understand, predict, and ultimately correct this sensitivity, simple but physically based models of LST angular anisotropy are needed. In this study, we describe and evaluate the modified geometric projection (MGP) model, a highly parameterized model of scene thermal infrared (TIR) radiance applicable to both homogeneous and discontinuous canopy environments. Based on geometric optics modeling, MPG assumes that the angular anisotropy of TIR radiance over discontinuous canopies is due strictly to the different proportions of scene endmembers (e.g., sunlit tree crowns, background shadows) visible to a sensor at different sun-view geometries. We tested MGP against DART, a rigorous three-dimensional radiative transfer model, and against field-measured data from a southern Africa savanna. For a prescribed set of canopy conditions, MGPs estimates of observable endmember fractions and scene temperatures in the solar principal plane compared well with estimates from DART. We also parameterized MGP with field-measured endmember data for an acacia/combretum savanna near Skukuza, South Africa. We angularly integrated the MGP-predicted radiances and compared the results with measurements of scene hemispherical exitance from a tower-based pyrgeometer. The modeled exitances exhibited the normal diurnal behavior. Model predictions generally agreed with the pyrgeometer measurements; however, model accuracy decreased as the difference in endmember temperatures increased. These tests suggest that the assumptions inherent in the MGP model do not seriously impact the accuracy of the simulated radiances. We conclude that the MGP model accurately captures the predominate thermal emission directionality resulting from discontinuous canopy structure, and could therefore be applied at continental and global scales.
|
| [8] |
Thermal infrared radiation transmission model of crop canopy [J].作物冠层的热红外辐射传输模型 [J].
通过在辐射传输方程中添加热发射项的方式,直接把一个常用的可见光波段的冠层模型―――SAIL模型改造成热红外波段模型。该模型与Hapke 公式相比能更准确地计算多种农作物冠层的热红外辐射特性,并能方便地作为一个基础模块融合到其他更高层次的热红外辐射模型中去。
|
| [9] |
Modeling directional brightness temperature of the winter wheat canopy at the ear stage [J].
The ear is the top layer of mature wheat and has very different geometric and thermal characteristics from that of leaves. Compared to the directional brightness temperature (DBT) of wheat canopy without ears, the DBT at the ear stage has specific features, and the ear effects could not be explained by previous models. This paper proposes a hybrid geometric optical and radiative transfer model to reveal the combined influences of the geometric structure of ears and leaf; the temperature distribution of ear, leaf, and soil; and the Sun-target-sensor geometry on the canopy DBT. The soil, leaf, and ear layers are taken into account in the model so it is named as the Soil Leaf Ear Combined (SLEC) DBT model. We compare the model prediction with the field measurement data. The results show that the new SLEC DBT model can simulate the DBT of wheat at the ear stage with an accuracy of 0.78 K.
|
| [10] |
An analytical four-component directional brightness temperature model for crop and forest canopies [J]. |
| [11] |
A model to calculate what a remote sensor sees' of an urban surface [J].
Whilst the measurement of radiation emissions from a surface is relatively straightforward, correct interpretation and proper utilization of the information requires that the surface area ‘seen’ be known accurately. This becomes non-trivial when the target is an urban surface, due to its complex three-dimensional form and the different thermal, radiative and moisture properties of its myriad surface facets. The geometric structure creates shade patterns in combination with the solar beam and obscures portions of the surface from the sensor, depending on where it is pointing and its field-of-view (FOV). A model to calculate these surface-sensor-sun relations (SUM) is described. SUM is tested against field and scale model observations, and theoretical calculations, and found to perform well. It can predict the surface area ‘seen’ by a sensor of known FOV pointing in any direction when placed at any point in space above a specified urban surface structure. Moreover, SUM can predict the view factors of the roof, wall and ground facets ‘seen’ and whether they are sunlit or shaded at any location and time of day. SUM can be used to determine the optimal placement and orientation of remote sensors to study urban radiation emissions; if the facet temperatures are known or modelled it can calculate the average temperature of the system, and it can determine the directional variation of temperature (anisotropy) due to any particular surface-sensor-sun geometric combination. The present surface geometry used in SUM is relatively simple, but there is scope to make it increasingly realistic.
|
| [12] |
Assessment of an Urban sensor view model for thermal anisotropy [J].
The surface-sensor-sun relations model (SUM) of Soux et al. [Soux, C.A., Voogt, J.A., & Oke, T.R. (2004). A model to calculate what a remote sensor ‘sees’ of an urban surface. Boundary-Layer Meteorology, 111, 109–132.] is modified to include a coupling of SUM with the actual building structure of a study area, thereby allowing variable building heights and shapes to be represented within SUM as well as the provision for an inter-building spacing that provides a more realistic urban block structure in the internal SUM urban surface representation. Model simulations using both modifications are performed and compared with airborne observations of surface temperature made over a Light Industrial area and a downtown area of Vancouver, BC. The results are generally good, although there is a general tendency to underestimate the overall thermal anisotropy. Use of mean facet temperatures in the validation limits validation statistics for one study area; improvements are made when facet temperatures are updated from individual flight lines. Performing a sensitivity analyses on the contributions to the thermal anisotropy suggests that surface structure and microscale temperature variability both make substantial contributions to the total anisotropy. This finding underscores the importance of including microscale temperature variability in assessments of urban thermal anisotropy. Full hemispheric plots of directional temperature and statistics for each study area are presented as an application of the model and show smooth variations in directional temperature when averaged over the study area.
|
| [13] |
A directional nucleus-driven nuclear model and uncertainty analysis for the application of high-emissivity urban surface infrared equivalent emissivity [J].一种近似用于高发射率城市地表热红外等效发射率的方向性变异核驱动模型及其不确定性分析 [J].
地表热红外发射率(8~14μm)的方向性变异为遥感地表温度的反演及应用引入了不确定性, 这种问题在城市地表显得尤为突出.发展了一种近似用于高发射率城市地表热红外等效发射率的方向性变异(Urban Surface Emissivity Anisotropy, USEA)核驱动模型, 并分析了具体应用时的不确定性, 其中USEA用非垂直观测的发射率与垂直观测时的发射率之比定量表示.模型有两个基本假设: (1) 白天, USEA具有热点效应, 热点位置与太阳位置接近;(2) 夜晚, USEA无明显热点效应, 且主要与观测天顶角相关.该核驱动模型由各向同性核、多次散射核、以及温差核组成, 其中各向同性核为常数1, 多次散射核描述了USEA与观测天顶角的关系, 温差核描述了USEA的热点效应.基于计算机模拟数据的模型评价结果表明, 核驱动模型可以表达USEA的时空变化, 但城市地表热惯量会导致模型的适用性降低.该核驱动模型在MODIS等传感器的方向性比辐射率数据上, 具有一定的应用潜力.
|
| [14] |
Research on the simple target directional radiance temperature of city [J].城市简单目标方向亮温研究 [J].
本研究以哈尔滨野外试验数据为基础,分析了城市表面亮温分布地表测量中,典型目标选择、目标亮温变化以及分类等方面的问题。结果表明,城市典型目标的选择,不仅需用材料特性划分,而且还需考虑阳光与周围环境的变化。此外,城市典型目标的亮温在数值上均随测量时间改变,并且变化比较复杂,需深入研究。在以上实验分析的基础上,建立了一种简单情况下的城市方向亮温模拟模型。模型中,抓住部分建筑区楼房以行结构为主要空间分布特征的特点,将建筑物进行简化,得到了不同观测角度下城市方向亮温的数值。模拟结果显示,方向亮温极化图中出现了条带结构,这与实验结果很吻合,但未能发现热点效应,需要进一步深入研究。
|
| [15] |
3D thermal radiation directional model of urban simulation target [J].城市模拟目标的3维热辐射方向性模型 [J].
以城市3维结构场景为研究目标,考虑其光影遮蔽关系,模拟传感器视场内目标的可见表面,实现视场尺度内城市模拟目标方向亮温的准确模拟。利用地面试验观测数据对3 维热辐射方向性模型进行验证。结果表明,该模型对城市3 维结构目标的方向亮温具有较好的模拟精度,均方根误差为0.7 K,能够描述微观尺度下城市3维模拟目标的热辐射方向性。利用该热辐射方向性模型对城市区域物理模型的方向亮温进行模拟,发现城市区域物理模型热辐射存在显著的方向差异,并伴有热点效应产生。
|
| [16] |
Geometric-optical bidirectional reflectance modeling of the discrete crown vegetation canopy: Effect of crown shape and mutual shadowing [J]. |
| [17] |
Validation of remotely sensed surface temperature over an oak woodland landscape—The problem of viewing and illumination geometries [J]. |
| [18] |
Modeling directional brightness temperature over mixed scenes of continuous crop and road: A case study of the Heihe River Basin [J]. |
| [19] |
Analysis of the field of view effect of bright temperature observation in urban target direction [J].城市目标方向亮温观测的视场效应分析 [J].
基于简化的城市目标三维结构模型,利用计算机图形学中辐射度方法,对城市目标的热辐射方向性规律进行模拟.在传感器分别位于近地面和卫星轨道时,研究了城市目标各组分在视场内的权重随观测天顶角、方位角和观测距离改变的变化规律.结果表明:城市目标方向亮温地面辐射测量存在显著视场效应.当传感器位于近地面时.在垂直太阳主平面附近,视场效应达到最大.方向亮温随观测距离的改变有明显变化.随着观测距离的增加,视场效应急剧减小.将近地面测量得到的方向亮温与卫星影像计算所得的方向亮温对比时,视场效应是一个必须考虑的因素.<dt><strong><t>Abstract:</t></strong></dt><dd>Thermal anisotropy regime for urban targets was investigated using a simplified urban structure model based on the radiosity principles and OpenGL. Each component fraction's variation regime was examined by computer simulation in different observation zeniths,azimuths and distances between the sensor and targets. Results indicate that: (1) significant field of view (FOV) effect exists in the DBT (directional brightness temperature) ground-based platform observations. It is able to reach the maximum values near the plane perpendicular to the solar main plane. (2) Analysis about FOV effect for a physical model of typical urban surface and cover patterns at different spatial locations and time series reveals that it can achieve several centigrade or so in a sunny day. (3) There is a significant "scale effect" in near-ground observations and it varies along with the distance between the sensor and urban targets. (4) The FOV effect cannot be neglected in comparisons between DBTs observed in ground-based field experiments and in images acquired from satellites.
|
| [20] |
3-D scene modeling of semidesert vegetation cover and its radiation regime [J].
To explore the potential of multiangle remote sensing for estimating biophysical or ecological parameters over a variety of landscapes, a modeling tool that is capable of handling three-dimensional (3-D) heterogeneous structures, deriving ecological parameters from the vegetation structure, and effectively working on different scene scales is very desirable. A 3-D scene modeling approach for these purposes is presented in this paper. This 3-D model fulfills its goal by taking advantage of radiosity theory and computer graphics techniques. It consists of two major modules: a modified extended L-systems (MELS) method to generate a 3-D realistic scene and a radiosity-graphics combined method (RGM) to calculate the radiation regime based on the 3-D structures rendered with MELS. The 3-D simulation tool is then evaluated using field measurements of both plant structure and spectra collected during the NASA Earth Observing Satellite Prototype Validation Exercise Jornada field campaign near Las Cruces, NM. The modeled scene reflectance is compared with measurements from three platforms (ground, tower, and satellite) at various scales (from the size of individual shrub component to satellite pixels of kilometers). The agreement with measured reflectances is excellent at all sampling scales tested. As an example of the model's application, we use the model output to examine the validity of a linear mixture scheme over the Jornada semidesert scene. The result shows that the larger the sampling size (at least larger than the size of the shrub component), the better the hypothesis is satisfied because of the unique structure of the Jornada scene: dense plant clumps (shrub component) sparsely scattered on a predominantly bare soil background. A range of possible applications of this 3-D scene model is highlighted, and further work needed for 3-D modeling is also discussed.
|
| [21] |
The calculation of the directional reflectance of a vegetative canopy [J].
The non-Lambertian directional reflectance of a multilayer vegetative canopy is derived. Cause of the reflectance of the canopy is made traceable to the properties of the biological elements of the canopy. A new and possibly useful canopy property leading to the down sun “hot spot” is discussed.
|
| [22] |
Light scattering by leaf layers with application to canopy reflectance modeling: The SAIL model [J].
The scattering and extinction coefficients of the SAIL canopy reflectance model are derived for the case of a fixed arbitrary leaf inclination angle and a random leaf azimuth distribution. The SAIL model includes the uniform model of G. H. Suits as a special case and its main characteristics are that canopy variables such as leaf area index and the leaf inclination distribution function are used as input parameters and that it provides more realistic angular profiles of the directional reflectance as a function of the view angle or the solar zenith angle.
|
| [23] |
3D radiation transmission model of vegetation canopy and simulation of thermal radiation directionality [J].植被冠层3D辐射传输模型及热辐射方向性模拟 [J].
研究了植被冠层的热辐射方向性并建立了有关模型.从辐射传输机理出发, 建立了3D冠层场景, 并将场景以微分体元方式进行离散, 根据给定的观测几何参数进行逐个体元内部与体元之间的多次散射及发射辐射传输计算, 最终通过积分运算得到所有微分体在半球空间上对给定观测方向上的热辐射, 得出整个冠层的热辐射方向性.利用两个时相的地面观测数据对3D辐射传输模型及模拟结果进行了验证和分析, 相关系数分别为0.91和0.79, RMSE分别为0.4K和0.6K, 证明建立的模型是有效的, 能改进热红外温度反演精度和实现组分温度反演.
|
| [24] |
Unified optical-thermal four-stream radiative transfer theory for homogeneous vegetation canopies [J]. |
| [25] |
Effect of tassel on the directionality of corn canopy heat radiation [J].雄穗对玉米冠层热辐射方向性的影响分析 [J].
通过三维计算机模型TRGM模拟分析了抽穗期雄穗对玉米冠层热辐射方向性的影响, 并利用高架车平台和热像仪进行了地面遥感观测验证.结果表明, 雄穗的存在对整体冠层的热辐射方向性特征影响较小, 在建模和反演过程中可以忽略.
|
| [26] |
An extended 3-D radiosity-graphics combined model for studying thermal-emission directionality of crop canopy [J]. |
| [27] |
Modeling radiative transfer in heterogeneous 3-D vegetation canopies [J].
The DART (discrete anisotropic radiative transfer) model simulates radiative transfer in heterogeneous 3-D scenes that may comprise different landscape features;i.e., leaves, grass, trunks, water, soil. The scene is divided into a rectangular cell matrix, i.e., building block for simulating larger scenes. Cells are parallelipipedic. Their optical properties are represented by individual scattering phase functions that are directly input into the model or are computed with optical and structural characteristics of elements within the cell. Radiation scattering and propagation are simulated with the exact kernel and discrete ordinate approaches; any set of discrete direction can be selected. In addition to topography and hot spot, leaf specular and first-order polarization mechanisms are modeled. Two major iterative steps are distinguished: 1) Cell illumination with direct sun radiation: Within cell multiple scattering is accurately simulated. 2) Interception and scattering of previously scattered radiation: Atmospheric radiation, possibly anisotropic, is input at this stage. Multiple scattering is stored as spherical harmonics expansions, for reducing computer memory constraints. The model iterates on step 2, for all cells, and stops with the energetic equilibrium. Two simple accelerating techniques can be used: 1) Gauss Seidel method, i.e.,simulation of scattering with radiation already scattered at the iteration stage, and (2) decrease of the spherical harmonics expansion order with the iteration order. Moreover, convergence towards the energetic equilibrium is accelerated with an exponential fitting technique. This model predicts the bidirectional reflectance distribution function of 3-D canopies. Radiation components associated with leaf volume and surface mechanisms are distinguished. It gives also the radiation regime within canopies, for further determination of 3-D photosynthesis rates and primary production. Accurate modeling of multiple scattering within cells, combined with the fact that cells can have different x,y,z dimensions, is well adapted to remote sensing based studies, i.e., scenes with large dimensions. The model was successfully tested with homogeneous covers. Preliminary comparisons of simulated reflectance images with remotely acquired spectral images of a 3-D heterogeneous forest cover stressed the usefulness of the DART model for conducting studies with remotely acquired information.
|
| [28] |
Thermal infrared radiative transfer within three-dimensional vegetation covers [J].
[1] The angular distribution of thermal infrared (TIR) radiation emitted by vegetation covers can vary widely depending on environmental conditions and canopy structure. As an aid in the interpretation of TIR remotely sensed data from vegetated surface with incomplete canopies, we developed a three-dimensional radiative transfer model in the thermal infrared domain. The model simulates the TIR radiative budget and upward spectral radiance of vegetation covers. The model is an extension to the TIR region of the DART (Discrete Anisotropic Radiative Transfer) model developed for the short wave domain. Radiative transfer simulation relies on discrete 3-D scene representations, which include any distribution of trees and ground covers, possibly with topography. Propagation of emitted and scattered radiation is tracked with a ray-tracing approach and the discrete ordinate method. The model was successfully tested against a physically based model for homogeneous canopies, and a partial validation was carried out with directional TIR measurements on a cotton row crop. Model simulations are presented to illustrate the influence of the canopy geometric structure on the directional apparent temperature of hypothetical vegetation covers.
|
| [29] |
Bidirectional Reflectance Modeling of Non-homogeneous Plant Canopies [R]. |
| [30] |
Model and validation of radiated radiated rejected rate for row crops [J].行播作物热辐射双向间隙率模型及验证 [J]. |
| [31] |
Modeling the gap probability of a discontinuous vegetation canopy [J].
ABSTRACT A model is presented for the gap probability of a discontinuous vegetation canopy, such as forest, savanna, or shrubland. The case in which the distribution of individual canopy sizes and shapes is known and individual canopies are randomly distributed but do not overlap, and the case in which the canopies to intersect and/or overlap such that foliage density remains constant with the overlap area are both considered, although an exact solution is provided only for the latter. A comparison of modeled gap probabilities with observed gap probabilities for a Maryland (US) pine stand (as taken from the literature) shows good agreement for zenith angles of illumination up to about 45掳. Above 45掳, the fit worsens, presumably because the horizontal branch structure of the pine canopy is less attenuating as the illumination angle approaches the horizon
|
| [32] |
Thermo-directional directional porosity model of row crops [J].行播作物热辐射方向性孔隙率模型 [J].
行播作物是介于离散植被和连续植被的一种典型植被类型,Kimes等人从纯几何光学角度研究了行结构的热辐射方向性,但视行结构为“箱型”实体,不考虑作物组分间的孔隙因素与大气下行辐射效应.在太阳光照方向和观测方向上同时考虑了作物间的孔隙率因素,根据离散植被孔隙率模型和连续植被的交相关概率思想,分别从行结构中的无遮挡、单向投影和双向重叠投影3个方面出发,建立行结构孔隙率模型.模型应用体系总有效发射率概念,解决了不同天顶角时非同温目标的环境辐射效应计算问题.经与实际观测结果对比,孔隙率模型比Kimes模型能更准确地描述行结构热辐射方向性.由于考虑了光照方向和观测方向的交相关关系,孔隙率模型可以解释热辐射中的热点现象.
|
| [33] |
RAPID: A radiosity applicable to porous indivi dual objects for directional reflectance over complex vegetated scenes [J]. |
| [34] |
Three-dimensional simulation model for thermal radiation directivity of nonuniform canopy: A case study of corn canopy [J].非匀一冠层热辐射方向性3维模型构建——以玉米冠层为例 [J]. |
| [35] |
Modeling of 3D canopy’s radiation transfer in the VNIR and TIR domains [J].基于3D真实植被场景的全波段辐射传输模型研究 [J].
本文基于3D真实场景CLAMP模型模拟的植被冠层,对冠层在可见一近红外波段和热红外波段的辐射传输进行了综合建模。针对CLAMP模型生成场景的通用和近似特征,在可见一近红外波段,对植被和土壤的单次散射贡献利用光子逆向追踪算法进行了精确计算,多次散射的贡献则采用四流近似理论来计算,以提高运算效率。模型结果与SAILH模型结果进行了比较,具有较好的一致性,并且体现出了优于一维辐射传输模型的模拟结果。在热红外波段,采用几何光学原理,冠层方向亮度温度由可视光照叶片、遮荫叶片、光照土壤和遮荫土壤的比例与对应组分亮温乘积之和得到,模拟结果体现了合理的变化趋势。对冠层主要结构参数LAI和ALA的敏感性进行了比较分析,不同波段模型模拟的方向性辐射结果,很好地反映了结构参数对冠层辐射特性的影响。
|
| [36] |
Simulating images of passive sensors with finite field of view by coupling 3-D radiative transfer model and sensor perspective projection [J]. |
| [37] |
Modeling directional brightness temperature over a maize canopy in row structure [J].
A study on modeling the variations of directional brightness temperature (DBT) for row-structure crops was carried out with the images captured by a large-aperture thermal infrared camera over a maize canopy. The model assumes that the DBT is a function of target component brightness temperatures and their directional fractions. The canopy has three brightness temperature components: the sunlit soil, the shaded soil, and the vegetation. Their fractions in the scene depend on the sun-view geometry and the distributions of gaps within and between plant rows. To describe canopy geometrical features, a series of porous hedgerows with a rectangular cross section is used. The directional variations of gap fractions are described by the Kuusk function. The model demonstrated how the features of DBT depend on the sun-view geometry, canopy geometrical structure, and component brightness temperatures. In the simulation of DBT over a middle-density canopy near the local noontime, the results revealed an evident row-direction-oriented hot stripe in DBT polar maps, where the hot spot appeared along the sun direction. The sensitivities of the model to the input parameters were tested. Further validation demonstrated a close correlation between predicted DBT and field observations.
|
| [38] |
Contribution of thermal infrared remote sensing data in multiobjective calibration of a dual-source SVAT model [J]. |
| [39] |
Review of methods for simulating land surface temperature at the pixel scale based on ground measurements over heterogeneous surface [J].基于地面观测的异质性下垫面像元尺度地表温度模拟研究进展 [J].
遥感反演的地表温度是研究全球气候变化和区域水分与能量交换的关键参数,准确获取地表温度对诊断地球环境变化意义重大。然而在异质性下垫面,像元尺度地表温度相对真值获取困难,导致遥感反演的地表温度的不确定性难以准确评估,影响了遥感反演的地表温度的深入应用。梳理了基于地面观测数据的异质性下垫面像元尺度地表温度模拟研究进展,依据模型是否构建真实空间分布,归纳了修正几何投影模型、真实结构三维模型和其他模型等,并对比了几种模型的优缺点。最后,指出了异质性下垫面像元尺度地表温度模拟中尚待解决的问题,并探讨了以后的研究方向。
|
| [40] |
Computer simulating of land surface thermal anisotropy based on realistic structure: A review [J].基于真实结构的地表热辐射方向性计算机模拟研究进展 [J].
地表温度是地质学、水文学和陆面过程研究中的重要参数.由于地表 的三维结构和异质性,大部分不同类型陆地表面均存在不同程度热辐射方向性现象.总结了基于真实结构的地表热辐射方向性计算机模型研究进展,归纳了真实结构 模型中蒙特卡罗光线追踪法和辐射度方法的理论基础,阐明了两种方法的区别和联系,并从理论和物理意义上分别推导和阐释了其与几何光学模型及辐射传输模型的 关系,指出了真实结构模型在算法效率、非同温系统蒙特卡罗模拟、参数获取、模型反演和应用等方面存在的主要问题,并展望了其在未来的发展趋势.
|
| [41] |
Directional effect on radiative surface temperature measurements over a semiarid grassland site [J].
In this study, an experimental design was conceived, as part of the Semi-Arid-Land-Surface-Atmosphere (SALSA) program, to document the effect of view angle variation on surface radiative temperature measurements. The results indicated differences between nadir and off-nadir radiative temperature of up to 5 K. The data also illustrated that, under clear sky and constant vegetation conditions, this difference is well correlated with surface soil moisture. However, the correlation decreased when the same comparison was made under changing vegetation conditions. To investigate the possibility of deriving component surface temperatures (soil and vegetation) using dual-angle observations of directional radiative temperature, two radiative transfer models (RTM) with different degrees of complexity were used. The results showed that despite their differences, the two models performed similarly in predicting the directional radiative temperature at a third angle. In contrast to other investigations, our study indicated that the impact of ignoring the cavity effect term is not very significant. However, omitting the contribution of the incoming long-wave radiation on measured directional radiance seemed to have a much larger impact. Finally, sensitivity analysis showed that an accuracy of better than 10% on the plant area index (PAI) was required for achieving a precision of 1 K for inverted vegetation temperature. An error of 1 K in measured directional radiative temperature can lead to an error of about 1 K in the soil and vegetation temperatures derived by inverting the RTM.
|
| [42] |
Thermal infrared radiative transfer within three-dimensional vegetation covers [J].
[1] The angular distribution of thermal infrared (TIR) radiation emitted by vegetation covers can vary widely depending on environmental conditions and canopy structure. As an aid in the interpretation of TIR remotely sensed data from vegetated surface with incomplete canopies, we developed a three-dimensional radiative transfer model in the thermal infrared domain. The model simulates the TIR radiative budget and upward spectral radiance of vegetation covers. The model is an extension to the TIR region of the DART (Discrete Anisotropic Radiative Transfer) model developed for the short wave domain. Radiative transfer simulation relies on discrete 3-D scene representations, which include any distribution of trees and ground covers, possibly with topography. Propagation of emitted and scattered radiation is tracked with a ray-tracing approach and the discrete ordinate method. The model was successfully tested against a physically based model for homogeneous canopies, and a partial validation was carried out with directional TIR measurements on a cotton row crop. Model simulations are presented to illustrate the influence of the canopy geometric structure on the directional apparent temperature of hypothetical vegetation covers.
|
| [43] |
Daytime thermal anisotropy of urban neighbourhoods: Morphological causation [J].
Surface temperature is a key variable in boundary-layer meteorology and is typically acquired by remote observation of emitted thermal radiation. However, the three-dimensional structure of cities complicates matters: uneven solar heating of urban facets produces an “effective anisotropy” of surface thermal emission at the neighbourhood scale. Remotely-sensed urban surface temperature varies with sensor view angle as a consequence. The authors combine a microscale urban surface temperature model with a thermal remote sensing model to predict the effective anisotropy of simplified neighbourhood configurations. The former model provides detailed surface temperature distributions for a range of “urban” forms, and the remote sensing model computes aggregate temperatures for multiple view angles. The combined model’s ability to reproduce observed anisotropy is evaluated against measurements from a neighbourhood in Vancouver, Canada. As in previous modeling studies, anisotropy is underestimated. Addition of moderate coverages of small (sub-facet scale) structure can account for much of the missing anisotropy. Subsequently, over 1900 sensitivity simulations are performed with the model combination, and the dependence of daytime effective thermal anisotropy on diurnal solar path (i.e., latitude and time of day) and blunt neighbourhood form is assessed. The range of effective anisotropy, as well as the maximum difference from nadir-observed brightness temperature, peak for moderate building-height-to-spacing ratios (H/W), and scale with canyon (between-building) area; dispersed high-rise urban forms generate maximum anisotropy. Maximum anisotropy increases with solar elevation and scales with shortwave irradiance. Moreover, it depends linearly on H/W for H/W < 1.25, with a slope that depends on maximum off-nadir sensor angle. Decreasing minimum brightness temperature is primarily responsible for this linear growth of maximum anisotropy. These results allow first order estimation of the minimum effective anisotropy magnitude of urban neighbourhoods as a function of building-height-to-spacing ratio, building plan area density, and shortwave irradiance. Finally, four “local climate zones” are simulated at two latitudes. Removal of neighbourhood street orientation regularity for these zones decreases maximum anisotropy by 3%–31%. Furthermore, thermal and radiative material properties are a weaker predictor of anisotropy than neighbourhood morphology. This study is the first systematic evaluation of effective anisotropy magnitude and causation for urban landscapes.
|
| [44] |
Dynamics Simulation of Angular Effects on the Forest Canopy Temperature Observed by Remote Sensing Methods[D] .遥感观测林冠温度的角度效应动态模拟研究[D] . |
| [45] |
Simulation of time effect on thermal emission directionality measurement [J].热辐射方向性测量中的时间效应模拟 [J].
由于测量仪器的限制,热辐射方 向性测量很难直接获得瞬时方向亮温分布,耗时较长,存在明显的时间效应。目前通常采用线性近似方法纠正,但是无法进行定量误差分析。以冬小麦为例,结合小 气候模型CUPID和计算机真实结构模型RGM模拟测量过程中的组分温度和方向亮温变化,对采用线性近似算法进行时间效应纠正的误差进行了评估。结果表 明,采用线性近似纠正可以满足测量要求,纠正误差(RMSE)小于0.3K。通过相关性分析得出结论:组分温度时间差异是方向亮温时间差异的主要影响因 素。
|
| [46] |
Thermal emission hot-spot effect of crop canopies—Part I: Simulation [J].
This paper is the first part of a three-part article series. Simulations of directional brightness temperature over both simple canopies with triangular leaves and the row-planted wheat and corn were used to analyze the thermal emission hot-spot effect on crop canopies. Two models, Cupid and TRGM, were successively used to simulate the thermal hot-spot signatures under conditions which cannot be easily captured in reality. The investigation includes the planting row structure, the leaf area index (LAI), the leaf angle distribution (LAD), the component temperature distribution as well as variations in the microclimate. The results show that there are typically three types of directional emission shapes in the solar principle plane: the bowl, dome and bell shape. Regardless of the shape, the hot spot is significant and can be accurately fitted (R2 = 0.98 and RMSE = 0.04°C) with a function of the phase angle (ξ), the hot-spot amplitude (ΔTHS) and the half width of the hot spot (ξ0)> which can be quantified with the half width in the RED band. The planting row structure can reduce the ΔTHS by a maximum amount (about 1.2°C) when compared with an unstructured horizontal canopy. The ΔTHS is linearly related to the component temperature differences between sunlit and shadowed parts. The linear equation can be used to predict the component temperature differences from ΔTHS. The accuracy is very good for the horizontal canopies with triangular leaves (RMSE 0.99), and acceptable for the virtual wheat and corn canopies (RMSE 0.81).
|

 甘公网安备62010202000687
/
| 〈 |
|
〉 |
