
裔传祥 , 辛晓洲
, 辛晓洲
Yi Chuanxiang, Xin Xiaozhou
中图分类号: P405
文献标识码: A
文章编号: 1001-8166(2018)04-0425-10
通讯作者:
收稿日期: 2017-10-9
修回日期: 2018-02-10
网络出版日期: 2018-04-20
版权声明: 2018 地球科学进展 编辑部
基金资助:
作者简介:
First author:Yi Chuanxiang(1992-), male, Yancheng City, Jiangsu Province, Master student. Research areas include application of meteorological.E-mail:18761808890@163.com
作者简介:裔传祥(1992-),男,江苏盐城人,硕士研究生,主要从事应用气象研究.E-mail:18761808890@163.com
展开
摘要
为研究低分辨率气象卫星数据云检测的尺度误差及其给下行辐射计算带来的影响,利用高分辨率静止卫星GF-4数据进行云检测并进行误差分析。首先运用可见光通道阈值法和时间序列法,对GF-4数据进行云检测,以GF-4云检测结果为基准,分析Himawari-8和FY-2(FY-2G和FY-2E)云检测结果的误差。在研究区内FY-2G,FY-2E与Himawari-8云图能够将云和晴空较好的区分开,造成误差的主要原因是不同空间分辨率卫星所产生的尺度效应(云检测算法不同造成的差异在此不予讨论),误差大多发生在薄云以及碎云较多的区域,高分辨率数据能够较好地检测出碎云,而低分辨率数据则会产生误检、检等情况。在此基础上对下行短波辐射遥感计算的误差进行分析,发现像元中实际云量的误差会给下行辐射的估算带来明显误差,所选试验区瞬时下行辐射相对误差最大为-173.52%,日总下行短波辐射相对误差最大为-20.20%。研究结果表明,在碎云较多的区域,利用高分辨率静止卫星数据可以显著提高下行短波辐射的估算精度。
关键词:
Abstract
In order to study the scale error of low resolution meteorological satellite cloud detection and its impact on the calculation of downlink radiation, cloud detection using high resolution stationary satellite GF-4 data and error analysis were carried out. Firstly, the cloud detection of GF-4 data is carried out by using visible channel threshold method and time series method, and the error of cloud detection results of Himawari-8 and FY-2 (FY-2G, FY-2E) is analyzed based on the results of GF-4 cloud detection.In the study area, FY-2G, FY-2E and Himawari-8 cloud images could distinguish the clouds and clear sky. The main reason for the error was the scale effect produced by different spatial resolution satellites(the differences caused by cloud detection algorithms are not discussed here).Most of the errors occurred in the areas of thin clouds and broken clouds.High resolution data could detect broken clouds, while low resolution data lead to false and missed detection. On this basis, the error of remote sensing calculation of short wave radiation was analyzed,and it was found that the error of the actual cloud amount in the pixel would bring significant error to the estimation of the downward radiation.The relative error of the instantaneous downward radiation in the selected test area was -173.52%, and the maximum relative error of shortwave radiation was -20.20%.The results show that the high resolution stationary satellite data can significantly improve the estimation accuracy of the downlink shortwave radiation in the regions with more broken clouds.
Keywords:
下行短波辐射是地表辐射收支平衡的重要组成部分,直接影响着地表的气候状况,准确计算下行短波辐射的时空分布及其变化对地球系统能量平衡和全球变化研究有着重要的科学意义,因此,利用卫星遥感数据估算下行短波辐射一直被众多学者所研究[1,2]。太阳辐射在经过大气时会受到云、水汽、气溶胶等大气因子的吸收和散射作用[36],其中云对辐射的削弱作用尤为明显:李霞等[7]发现短波中云体吸收小于1 100 nm的辐射量大于总短波辐射的60%。Liepert[8]和Stjern等[9]指出云量是影响美国和北欧太阳辐射年际变化的主要原因;王学锋等[10]同样发现云量是影响云南地区太阳辐射的主要因子之一。此外,在下行辐射遥感估算中,需要根据像元云检测标志区分云天和晴天,进而采用不同的模型和参数分别计算,余珊珊等[11]分析了12个晴天大气下行辐射参数化模型与8个云天模型,指出不同模型间的差异;在计算短波辐射时引入天空有效云覆盖度与区域真实云覆盖度2个参数,能够有效提高短波辐射遥感反演精度[12]。因此云检测结果的准确性对下行短波辐射的遥感估算会产生很大影响。云检测是气象卫星资料应用研究最基本的工作之一,也是实际中对卫星遥感资料分析首要解决的问题之一[13,14]。在云检测方法方面,国内外学者对多种卫星数据进行了大量研究,并取得了显著成果,形成诸多较为成熟的算法,包括阈值法、多光谱云检测法以及树判别结构云检测法等[1519]。
现今卫星云产品空间分辨率呈多样化,如MODIS云产品空间分辨率为1 km,向日葵8号(Himawari-8)云产品空间分辨率为2 km,风云二号(FY-2)系列云产品空间分辨率为5 km,国际卫星云气候计划(International Satellite Cloud Climatology Project,ISCCP)云气候资料集空间分辨率为280 km。利用遥感数据进行云检测时,出现误差的原因除了云检测算法带来的影响外,不同空间分辨率卫星所产生的尺度效应也是一个重要的影响因素[20]。 云覆盖着地球约2/3的面积,丁守国等[21]基于ISCCP资料统计出的全球低云量约占总云量的41%,低云中存在着大量碎积云、碎雨云以及碎层云,由于这些破碎的云体较小,且比较零散地分布在天空,面积远小于低分辨率卫星数据单个像元,使得低分辨率卫星云检测结果产生尺度误差。随着卫星遥感技术的普及,影像空间分辨率以及探测通道也变得多样化,不同空间分辨率卫星影像云检测结果的尺度误差是客观存在且不可避免的。
对于卫星云检测结果的误差,本文主要分析不同空间分辨率卫星所产生的尺度效应这一原因(云检测算法不同造成的差异在此不予讨论),运用高空间分辨率卫星云图检验低分辨率卫星云检测结果的误差,并在此基础上对计算下行短波辐射所产生的影响进行分析。进行卫星云图对比时,需要源数据时间与空间的一致。考虑到云变化快,卫星过境时间需一致的特点,本文选择静止卫星数据进行研究:利用分辨率为50 m的高分四号(GF-4)静止卫星影像为基准影像,检验2 km空间分辨率Himawari-8和5 km空间分辨率FY-2(FY-2G和FY-2E)云检测结果的尺度误差。其次利用大气辐传输模型(Santa Barbara DISORT Atmospheric Radiative Transfer,SBDART)模型,针对FY-2卫星云检测结果的误差,分析其对计算下行短波辐射产生的影响。
静止卫星具有高频次观测的优势,非常适合用于下行辐射遥感估算,但是较低空间分辨率卫星对于碎云、小尺度云等识别能力不高,容易造成云检测误差,从而造成下行辐射的计算误差。本文选择GF-4,Himawari-8和FY-2卫星研究不同分辨率数据对下行辐射计算的影响。GF-4卫星幅宽为400 km,能够对中国以及周边地区(约占地球表面1/3区域)进行观测,配置着我国目前最大口径的凝视光学遥感相机,分辨率由之前数公里或几百米提高到了几十米的级别。GF-4卫星具有6个波段。GF-4卫星具有多项技术创新,如高轨高分辨率光学遥感卫星设计技术、高轨道遥感卫星成像品质技术等[22],这为本文的研究奠定了基础;Himawari-8卫星由日本气象厅发射,其卫星图像的质量及观测频率都有很大的提高;风云二号气象卫星是我国自行研制的第一代静止气象卫星,共发射6颗,构成我国气象卫星应用体系。由于GF-4没有云产品,由此选取的GF-4数据为1级相对辐射校正产品,并进行云检测;Himawari-8为云检测产品;FY-2G为云检测产品,FY-2E为云分类产品。
为进行本文的研究,需要Himawari-8,FY-2G和FY-2E卫星成像时间、范围与GF-4一致,GF-4卫星虽然是静止卫星,但是由用户定制,并不能全天候开机,不能对全国范围进行连续观测,经过筛选,获取本文的研究数据以及研究区。选取GF-4遥感影像时间为2016年12月14日和29日9:00,12:00和15:00检验Himawari-8与FY-2G云检测尺度误差;选取GF-4遥感影像时间为2016年12月14日和29日10:30,13:30,16:30检验FY-2E云检测尺度误差,数据源详细介绍见表1。
表1 数据源统计表
Table 1 Data source statistics table
| 数据名称 | 卫星类型 | 数据介绍 | 空间分辨率 | 时间分辨率 | 时间序列 |
|---|---|---|---|---|---|
| GF-4 | 同步轨道 光学卫星 | 1A级产品 | 50 m | 无固定时间 分辨率 | 2016年12月14日和29日9:00,10:30,12:00,13:30,15:00,16:30 |
| Himawari-8 | 静止气象卫星 | 云产品 | 2 km | 1 h(整点) | 2016年12月14日和29日9:00,12:00,15:00 |
| FY-2G | 静止气象卫星 | 云检测产品 | 5 km | 1 h(整点) | 2016年12月14日和29日9:00,12:00,15:00 |
| FY-2E | 静止气象卫星 | 云分类产品 | 5 km | 1 h(半点) | 2016年12月14日和29日10:30,13:30,16:30 |
所选地区的范围为22.36°25.73°N,111.53°114.90°E,区域大致为广东省及其周边地区。研究区地处东亚季风区,受台风影响较为频繁。其中,广东年均温在20 ℃以上,12月均温远高于0 ℃,研究区内海拔较低,没有冰雪因素给云检测带来的误差。
进行卫星云图对比时,均需要对检验源数据与被检验数据进行时空属性匹配处理。首先需要对GF-4数据进行预处理,主要包括:几何校正、辐射定标以及配准,影像裁剪;由于Himawari-8云产品已经过几何校正,只需对其进行裁剪即可获得研究区域对应的数据;根据风云二号的经纬度查找表文件对FY-2G和FY-2E产品进行几何校正,并裁剪出经纬度范围相同的区域。为保证投影信息一致,将上述数据的投影统一转换为WGS_84投影。以50 m空间分辨率GF-4云检测结果作为“真值影像”,对其他不同分辨率的遥感影像云检测结果进行评价。根据待检验像素的几何信息,计算其覆盖范围的边界,然后统计落入其中的GF-4像元总数与云像元数量,从而得到“真实云含量”。
为了更好地分析Himawari-8,FY-2G和FY-2E云检测的尺度误差,以及评估运用FY-2卫星数据计算下行短波辐射所带来的影响。本文运用可见光通道阈值法与时间序列法对GF-4卫星数据进行云检测,其次引入SBDART模型,对低分辨率云检测结果的尺度误差及下行短波辐射遥感估算所产生影响进行系统测算。
在本研究中,我们使用可见光波段对GF-4影像进行云的粗检测。对GF-4卫星可见光与近红外波段影像进行分析后发现,近红外影像中由于陆地部分的色调较亮,导致部分薄云难以与地表区分开来,从而会形成云的误检。在可见光波段中,不同地物类型的反射率有很大区别,其中云的反射率较高,即使对于云顶温度较高的低云,其反射率也远高于地表[23],所以可基于云的反射率特性使用阈值法对GF-4影像进行粗略的云检测[24,25],将云与其他地物区分开来。
GF-4影像经过云的粗检测之后仍有部分检的云,尤其是云边缘。这是因为云边缘存在大量的薄云,薄云的穿透力强,从单一的反射率很难检测出来,因此,将云边缘检测出来将会大大提高云检测的准确性。本文利用杨昌军等[26]提出的时间序列云检测法来判断云区边缘的薄云。其原理是根据云移动的性质,通过GF-4影像时间序列表现出反射率的变化,判断像元是否为移动的有云像元。云边缘检测本质就是利用不同物体反射率的不连续性,同一种物体反射率有着相似性这一特点进行检测。将GF-4图像云的粗检测与薄云检测相结合可以得到云检测的结果。
本文使用SBDART模型计算下行短波辐射,它是由美国加利福尼亚大学所开发,用于计算有云与晴空下的平面平行辐射传输。辐射传输方程利用离散纵坐标法程序(Discrete Ordinate Radiative Transfer,SIDORT)来计算发生在紫外线、可见光和红外波段的所有重要辐射过程[27]。为使下行短波辐射的模拟相对准确,参数气候模型、光谱起止值、表面海拔根据研究区域的条件来设置;水汽含量、云层光学厚度、气溶胶光学厚度均由MODIS卫星反演产品得到,其中晴空区域的云层光学厚度为0,云区则有值;太阳天顶角可从相对应的GF-4卫星头文件资料中查找获得;其余参数则为模型默认值。
当使用卫星数据计算下行短波辐射时,由于晴空区与云区下行短波辐射计算的算法不一样,由此会给下行短波辐射的计算带来误差。若像元为云,则有:
式中:Lestimated为下行短波辐射估测值,L云为有云状况的下行短波辐射。
本文针对这一现象对下行短波的计算做出改进:有云天气的下行短波辐射计算方案包括云与晴空之和,若低分辨率卫星一个云像元实际云所占百分比为c,则下行短波辐射可表示为[28]:
式中:Ltrue为下行短波辐射值,L晴为晴空状况下行短波辐射,c为云像元实际云面积所占比。同样当像元为晴空时计算公式与上述相似。并利用绝对误差(Absolute Error,AE)以及相对误差(Relative Error,RE)分析低分辨率数据短波辐射遥感估算的误差。
在利用GF-4数据分析Himawari-8与FY-2云检测误差之前,首先需对GF-4云检测结果进行评价;其次采用不同时空分析尺度进行评估;最后选取FY-2数据作为对象,分析低分辨率云检测结果的尺度误差给计算下行短波辐射所带来的影响,探讨误差产生的内在因素。
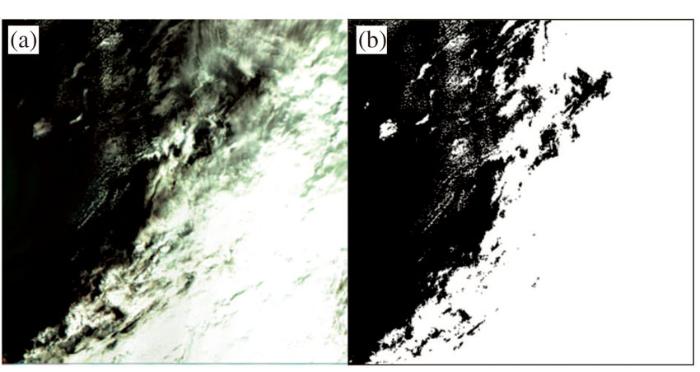
为验证本文所用云检测方法对GF-4数据的适用性,选取多幅影像云检测结果对其进行论证。图1a为一幅GF-4的5,4,3波段合成影像,经过目视判别可以清晰地看出该区域包含黑色的晴空和大量白色的云。经云检测之后,从云检测结果(图1b)可以发现大面积的高云、成片的薄云以及分散的碎云被检测出来,云与晴空被较好地区分开。使用目视解译方法进行验证发现GF-4云检测结果可靠,已达到预期检测效果。因此可用GF-4云图为基准影像,对低分辨率的FY-2与Himawari-8卫星云检测结果进行评价。
图1 GF-4彩色合成图以及云检测结果图
(a)5,4,3波段合成图;(b)云检测结果
Fig.1 GF-4 color composite map and cloud detection result
(a)5, 4 and 3 band composite graph;(b)Cloud detection result
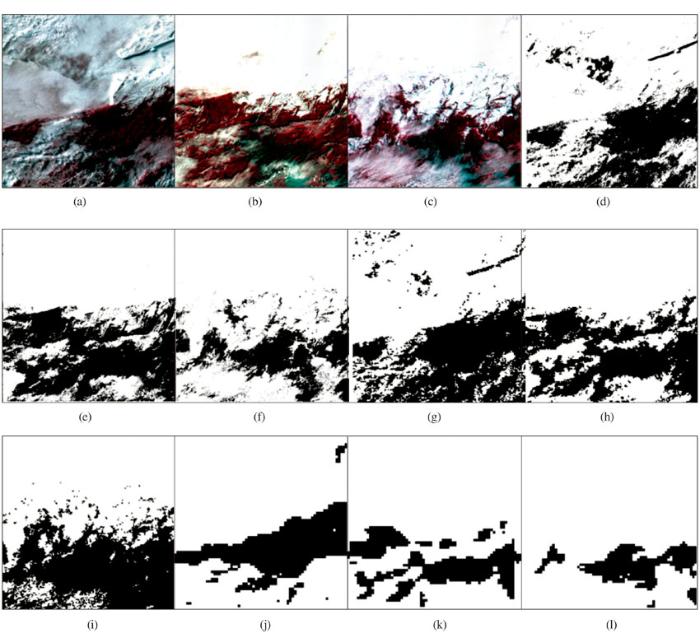
图2列出了2016年12月14日9:00,12:00和15:00 3个时刻GF-4,Himawari-8以及FY-2G云图,可以发现分辨率不同的云图结果差异明显。对比GF-4与Himawari-8,2种卫星云图在空间分布上基本一致,Himawari-8 3个时刻上半部分的密云区域与GF-4相差不大,但下半部分区域的薄云检测结果相比GF-4稍显粗略。同样,FY-2G较另外2种卫星而言略显模糊,存在着少许“马赛克”现象。在碎云较多的区域,随着单个像元的增大,混合像元中云面积比不固定,导致像元类型难以判别,这使得不同空间分辨率影像云检测结果的尺度差异客观存在且显著。
选取14日12:00的Himawari-8与FY-2G,13:30的FY-2E云图进行误差分析,发现这3种数据云像元对应的GF-4云面积比小于0.1的百分比稍多,FY-2G与FY-2E分别达到11.85%和12.83%,Himawari-8为9.17%,晴空像元也存在类似现象,这说明2 km与5 km空间分辨率卫星云检测结果存在着一定的误差。
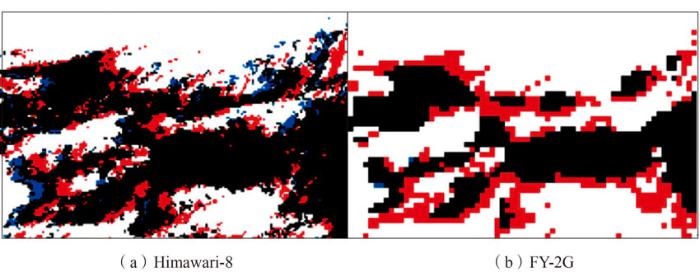
针对以上所表现出的误差现象,找出对应时刻Himawari-8与FY-2G云图误检的部分(图3),其中红色部分为云像元误判(GF-4云面积比小于0.1),蓝色部分为晴空像元误判(GF-4云面积比大于0.9)。可以发现,GF-4下半部分有许多不规则分布的碎云,对应的区域Himawari-8碎云成分则显得较少,而FY-2G中的云成连续性,无法将碎云表现出来。从图3可以看出不管是云还是晴空像元,由于空间分辨率较低所造成尺度误差的部分,大多发生在云边缘以及碎云较多的区域。分析其原因,是对于分散的碎云,随着空间尺度增大,会有更多的混合像元较难被识别,加大云检测结果的尺度误差。在分散云较多的区域,须使用更高分辨率的遥感影像才能达到准确度高的云检测。
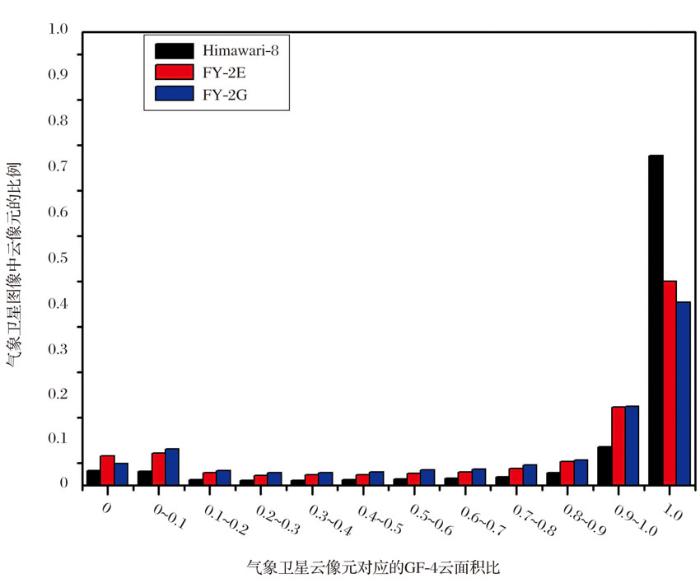
统计本文研究区FY-2G,FY-2E和Himawari-8云像元中GF-4云面积所占比例统计结果(图4)发现,FY-2G与FY-2E云像元中GF-4云面积所占比例分布基本一致:云像元所对应的GF-4云面积比为1的百分比最大,所占比例分别为40.46%和44.98%,远大于其他比例。分辨率较高的Himawari-8云像元中GF-4云面积比为1的比例高达72.73%。气象卫星云像元所对应GF-4云面积比为00.1的比例稍高,分辨率更低的FY-2G与FY-2E云检测结果出现误差的比例更多。空间分辨率的差异导致Himawari-8在检测小尺度云时具有优势,可以发现5 km空间分辨率的FY-2卫星对云的检测,由于尺度效应产生的误差现象更明显。
气象卫星云图晴空像元中GF-4云面积所占比出现相似的分布,Himawari-8晴空像元中GF-4云面积所占比为10.9的比例稍高,占3.00%,结合单一时刻云图的分析可以发现FY-2与Himawari-8会将少量碎云区域判断为云像元。研究区内FY-2G,FY-2E和Himawari-8云产品中纯像元所占的比例分别为54.98%,57.06%和77.16%。总体来说,FY-2G,FY-2E与Himawari-8云图能够将云和晴空较好的区分开,Himawari-8卫星云检测结果的尺度误差小于FY-2卫星,不同卫星云检测由于空间分辨率差异所产生尺度误差的部分,大多发生在薄云以及碎云较多的区域。
图2 GF-4的5,4,3波段合成图(a,b,c)以及GF-4(d,e,f)、Himawari-8(g,h,i)和FY-2G(j,k,l)云图结果
第一列时间为2016年12月14日9:00;第二列时间为12:00;第三列为15:00
Fig.2 GF-4, 5, 4 and 3 band composite graphs (a, b, c), and GF-4 (d, e, f),Himawari-8 (g, h, i) and FY-2G (j, k, l) cloud picture results
The first column is at 9 o’clock in December 14, 2016; The second column is at 12 o’clock; The third is at 15 o’clock
图3 14日12点Himawari-8与FY-2G云检测误检示意图
蓝色为晴空像元误检,红色为云像元误检
Fig.3 At 14, 12 o’clock Himawari-8 and FY-2G schematic diagram of cloud detection error detection
The blue part is the clear sky pixel error detection,the red part is the cloud pixel error detection
运用遥感卫星数据计算下行短波辐射时,若影像中云与晴空像元为非纯像元,则会给估算的结果带来误差。统计本文所选云产品中纯像元的比例(图4),可以看出FY-2G,FY-2E和Himawari-8中纯像元的比例都相对较高,但仍分别有45.02%,42.94%和22.84%的像元会给下行短波辐射计算带来误差,可以看出空间分辨率较低的FY-2会给下行短波辐射估算带来更大的影响。
图4 FY-2G,FY-2E,Himawari-8云像元对应GF-4云所占比例统计结果
Fig.4 FY-2G,FY-2E,Himawari-8 cloud pixels of cloud products statistical results corresponding to the GF-4 cloud
在FY-2数据中选取1天(2016年14日)6个时刻中8个具有代表性的区域进行分析,标为序号18,从表2可以看出其中有云检测结果尺度误差较小的(如序号7),也有误差较大的(如序号2),以及云与晴空都存在,并且像元标志会随时间变化。运用SBDART模型模拟出各区域下行短波辐估算值,并以GF-4云图作为基准影像计算FY-2各像元云所占比例,以此算出辐射值,并进行误差统计(表2)。
由表2可以看出,下行短波辐射误差随云量变化的大小是不相同的。当FY-2像元为云,实际云所占的比例很高时,下行辐射的相对误差相对较小;而当实际云所占比例较低时,也会出现下行辐射误差较小的现象,产生这样的原因是下行短波辐射与大气水汽含量、云层光学厚度、太阳天顶角等都有一定关系。假设每个时刻的下行短波辐射误差为该时段的平均误差,则该地区下行辐射会产生一个累积误差,由表3可以看出所选择的区域瞬时绝对误差最大达到-591.86 W/m2,相对误差最大为-173.52%,一天相对误差最大为20.20%(序号2),最小为1.32%(序号1)。比较序号2与1各时刻像元类型中实际云所占比例,可以发现序号2中云像元中实际云所占比例相对较少,像元类型与实际情况不符,导致下行短波辐射误差总和较大。从上述误差分析可以看出运用低分辨率卫星数据时,会给该地区瞬时下行短波辐射的估算带来影响,继而会使一天的下行短波辐射量产生累积误差。在进行下行短波辐射遥感估算时,由于低分辨率卫星云检测尺度误差的存在会给计算结果带来偏差,因此在碎云较多的区域,使用高分辨率静止卫星数据可提高下行短波辐射的估算精度。
表2 风云二号数据模拟下行短波辐射误差统计表
Table 2 Short wave radiation error statistics table for FY-2 data simulation
| 序号 | 时间 | 像元标志 | 实际云所占 比例/% | 绝对误差 /(W/m2) | 下行短波辐射 相对误差/% | 一天相对误差 /% |
|---|---|---|---|---|---|---|
| 1 | 9:00 | 云 | 91.56 | -46.97 | -10.51 | 1.32 |
| 10:30 | 晴 | 100.00 | 490.67 | 153.07 | ||
| 12:00 | 云 | 82.70 | -76.79 | -22.00 | ||
| 13:30 | 云 | 99.16 | -3.30 | -0.97 | ||
| 15:00 | 云 | 100.00 | 0.00 | 0.00 | ||
| 16:30 | 云 | 32.00 | -327.76 | -39.34 | ||
| 2 | 9:00 | 云 | 98.70 | -6.63 | -1.50 | -20.20 |
| 10:30 | 晴 | 100.00 | 452.99 | 56.07 | ||
| 12:00 | 云 | 30.77 | -285.02 | -94.57 | ||
| 13:30 | 云 | 64.44 | -178.82 | -78.21 | ||
| 15:00 | 云 | 100.00 | -0.00 | 0.00 | ||
| 16:30 | 云 | 8.65 | -591.86 | -173.52 | ||
| 3 | 9:00 | 云 | 54.16 | -45.06 | -5.17 | -9.70 |
| 10:30 | 晴 | 53.47 | 56.02 | 7.71 | ||
| 12:00 | 云 | 64.44 | -38.04 | -6.12 | ||
| 13:30 | 云 | 100.00 | 0.00 | 0.00 | ||
| 15:00 | 云 | 61.36 | -126.90 | -19.32 | ||
| 16:30 | 云 | 27.33 | -251.82 | -28.43 | ||
| 4 | 9:00 | 云 | 59.84 | -65.18 | -8.52 | -8.70 |
| 10:30 | 晴 | 97.59 | 161.06 | 20.51 | ||
| 12:00 | 云 | 46.85 | -86.73 | -16.39 | ||
| 13:30 | 云 | 64.12 | -67.45 | -12.61 | ||
| 15:00 | 云 | 23.22 | -147.12 | -22.14 | ||
| 16:30 | 云 | 20.07 | -151.52 | -19.21 | ||
| 5 | 9:00 | 晴 | 36.11 | 12.12 | 1.33 | -10.73 |
| 10:30 | 晴 | 56.77 | 21.32 | 2.81 | ||
| 12:00 | 云 | 48.57 | -20.50 | -3.07 | ||
| 13:30 | 云 | 80.26 | -50.51 | -9.72 | ||
| 15:00 | 云 | 15.59 | -230.01 | -28.19 | ||
| 16:30 | 云 | 19.63 | -225.85 | -24.40 | ||
| 6 | 9:00 | 晴 | 10.53 | 0.87 | 0.09 | -3.62 |
| 10:30 | 晴 | 80.97 | 7.53 | 0.97 | ||
| 12:00 | 云 | 1.10 | -9.92 | -1.46 | ||
| 13:30 | 云 | 21.13 | -71.97 | -11.42 | ||
| 15:00 | 云 | 46.59 | -46.03 | -5.99 | ||
| 16:30 | 云 | 29.77 | -55.97 | -6.24 | ||
| 7 | 9:00 | 云 | 0.81 | -102.09 | -19.54 | -4.39 |
| 10:30 | 云 | 1.00 | 0.00 | 0.00 | ||
| 12:00 | 云 | 0.94 | -26.37 | -8.43 | ||
| 13:30 | 云 | 1.00 | 0.00 | 0.00 | ||
| 15:00 | 云 | 1.00 | 0.00 | 0.00 | ||
| 16:30 | 云 | 1.00 | 0.00 | 0.00 | ||
| 8 | 9:00 | 晴 | 0.00 | 0.00 | 0.00 | -14.76 |
| 10:30 | 晴 | 0.05 | 0.97 | 0.12 | ||
| 12:00 | 云 | 0.23 | -15.96 | -2.40 | ||
| 13:30 | 云 | 0.27 | -250.91 | -65.37 | ||
| 15:00 | 云 | 1.00 | 0.00 | 0.00 | ||
| 16:30 | 云 | 0.04 | -392.80 | -68.34 |
本文利用GF-4,Himawari-8,FY-2G和FY-2E等不同空间分辨率的遥感影像数据,研究了低空间分辨率卫星云检测结果的尺度误差,并结合SBDART模型,探讨了FY-2卫星云检测结果的误差对计算下行短波辐射产生的影响。
研究结果表明,使用可见光通道阈值法并结合时间序列法对GF-4遥感数据进行云检测,可以将云与晴空较好地区分开,能够达到预期检测效果。在研究区内FY-2G,FY-2E与Himawari-8云图能够将云和晴空较好地区分开。不同空间分辨率卫星所导致的云检测结果的尺度误差现象客观存在且显著,随着空间分辨率由2 km下降到5 km,研究区内云产品纯像元所占比例也由Himawari-8的77.16%下降到FY-2G的54.98%与FY-2E的57.06%。造成这种状况的原因是,在碎云较多的区域随着空间尺度增大,会有更多的混合像元难以被准确识别,导致云检测结果的误差变大。
上述研究表明,较低空间分辨率影像会造成卫星云检测结果的尺度误差,从而影响下行短波辐射遥感估算。下行短波辐射误差随云量变化的大小是不相同的,原因是下行短波辐射与大气水汽含量、云层光学厚度、太阳天顶角等都有一定关系。由于低分辨率卫星云检测结果的尺度误差,会给瞬时下行辐射的估算带来误差,从而给一天的下行辐射量带来累积误差:所选研究区基于FY-2数据计算的瞬时下行短波辐射相对误差最大为-173.52%,日总相对误差最大为-20.20%。随着卫星数据空间分辨率的提高,建议逐步使用高分辨率影像进行辐射遥感估算,有效提高大区域尺度下行短波辐射计算精度。
在对低分辨率卫星云检测结果的尺度误差研究中,由于数据条件限制本研究只选取Himawari-8以及FY-2静止卫星进行分析。本文在分析低分辨率气象卫星数据云检测的尺度误差及其给下行辐射计算带来的影响时,可能会存在一些误差,原因可能有以下3种:①对GF-4影像的云检测效果理想,但做不到百分之百的准确,可能会对精度判断产生影响;②不同卫星几何校正不精确造成的像元偏移,导致低分辨率卫星数据格点与相对应的GF-4像元经纬度范围可能不会完全相同,这也是产生误差的原因;③当运用SBDART模型进行下行辐射模拟时,由于得不到一整天连续的风云二号卫星与相对应的GF-4数据,所以并不是一整天真实的模拟值,会给下行辐射的误差分析带来影响。
本文主要在较小的区域上对低空间分辨率影像云检测结果的尺度误差给计算下行短波辐射产生的影响进行研究。随着遥感数据空间及时间分辨率的不断提高,在后续工作中将进一步研究更长时间尺度及更大区域尺度情况下,进一步揭示低空间分辨率卫星对下行短波辐射遥感估算的影响。
致 谢:感谢中国科学院遥感与数字地球研究所胡斯乐图研究员研究小组提供Himawari-8云产品的数据,谨此致谢。
The authors have declared that no competing interests exist.
| [1] |
A method for estimating hourly Photosynthetically Active Radiation (PAR) in China by combining geostationary and polar-orbiting satellite data [J].
Photosynthetically active radiation (PAR) is an important parameter in ecosystem and land surface models. PAR represents the amount of solar radiation in the spectral range of 400–70002nm that travels through the atmosphere to the top of the vegetation canopy. In recent years, various methods using different input data to estimate PAR and produce different PAR products have been developed. However, most of the algorithms used in these state-of-the-art studies have not fully compensated for the low spatial and temporal resolution of the data, which affects the accuracy of the PAR estimates. In this study, we have developed a method for estimating hourly PAR based on a combination of geostationary and polar-orbiting satellite data. The Multifunctional Transport Satellite (MTSAT) was selected to retrieve cloud optical depth (COD) with a higher spatial resolution, and the polar orbit satellite data of the Moderate Resolution Imaging Spectroradiometer (MODIS) products were used to derive surface parameters based on multispectral characteristics. A look-up table was established by the Second Simulation of a Satellite Signal in the Solar Spectrum-Vector (6SV) model and the Santa Barbara DISORT Atmospheric Radiative Transfer (SBDART) model consisting the following parameters: solar zenith angle, total water vapor, total ozone column, aerosol optical depth (AOD), COD, surface elevation, surface albedo and PAR. The instantaneous PAR was linearly interpolated from the input data for the selected parameters and the look-up table. The root mean square error (RMSE) between the estimated and observed instantaneous PAR at the Huailai station was 45.7202W/m 2 for all sky conditions. The RMSE between the estimated and observed daily PAR at the meteorological stations was 17% in the eastern regions of China. The mean bias error (MBE) was between 61022.83 and 32.4302W/m 2 for the Tibetan Plateau. These results indicated that the proposed method can significantly improve the accuracy of PAR estimates and can be used to produce PAR products with high spatial and temporal resolution. However, the method requires further improvement, especially with respect to cloudy conditions.
|
| [2] |
Estimation of surface energy balance from HJ-1 satellite data [J].HJ-1卫星数据估算地表能量平衡 [J].
利用遥感数据估算和监测地表能量平衡的研究和应用一直以来都是学术探索的前沿和焦点,目前针对国际主流卫星数据(如MODIS,Landsat TM等)的算法研究有很多,且在不同的尺度上发展了一系列遥感技术和应用方法。本文以环境一号卫星(HJ-1)数据为主要数据源,研究和分析了地表能量平衡遥感估算方法。在下行短波和长波辐射,以及地表净辐射估算的基础上,重点研究了地表显热和潜热通量(蒸散)的估算方法,针对辐射温度代替空气动力学温度所引起的误差校正,对比分析了基于KB-1系数的热力学粗糙度长度,以及附加阻抗两种方法。使用2010年HJ-1B数据反演得到海河流域地表能量平衡各分量瞬时值,利用3个地面站点的测量数据对反演结果进行验证和误差分析。结果表明下行短波辐射的反演误差是地表净辐射反演误差的主要来源,地表温度的反演精度以及地表粗糙度的模拟精度是影响显热通量反演精度的主要因素。利用两种方法估算的显热通量趋势基本一致,但KB-1系数法的反演结果一般低于附加阻抗法。在下垫面较为复杂的区域,模型结果误差较大,需要更加精细的模型以刻画地表非均匀性的影响。
|
| [3] |
The influence of cloud layer and aerosol on absorption of solar radiation [J].云层与气溶胶对大气吸收太阳辐射的影响 [J].
云通过辐射过程对地气系统的能量平衡起着特别显著的调节作用,是影响天气、气候以及全球变化的重要因子。近年来,有云大气对太阳短波辐射的"异常吸收"又成为云-辐射研究中的一个争论热点。有云大气的短波吸收受到多种因素的影响,关于这方面的研究还不够充分。本文通过计算,从理论上探讨了若干因素的组合对大气吸收的综合影响。在计算中,同时考虑了不同太阳辐射波段、不同太阳入射天顶角、不同云顶高度以及不同下垫面的影响,并考虑了包含大气分子、气溶胶和云滴的吸收与散射,以及在近红外波段大气自身的热辐射等过程,阐明了云与气溶胶在不同波段对大气吸收太阳辐射的影响。
|
| [4] |
Microphysical examination of excess cloud absorption in the tropical atmosphere [J].
To investigate the excess shortwave absorption by clouds, a numerical cloud generation model has been coupled to a plane-parallel discrete ordinates radiative transfer model. The former was used in a time-dependent fashion to generate a cumulonimbus turret and three types of cirrus anvil (precipitating, extended, detached) representing three stages of cloud evolution outward from the turret. The cloud particle size distributions, as a function of altitude, were used as input to the radiative transfer model using indices of refraction for pure water and pure ice and equivalent sphere Mie theory. The radiative transfer model was used to calculate the ratio of cloud forcing at the surface to cloud forcing at the top of the atmosphere, both for the broadband shortwave and as a function of wavelength. Recent empirical studies have placed this cloud forcing ratio at around 1.5, and our coupled model results approach this value for small solar zenith angles, when the cloud contains large (>100 m) ice particles that absorb significantly in the near infrared (primarily the 1.6-m window). However, the empirical studies are based on diurnal averages, and our plane-parallel radiative transfer model yields an area and diurnally averaged cloud forcing ratio of only 1.18 for a tropical cumulonimbus and cirrus anvil system, primarily because of the rapid decrease of the ratio with solar zenith angle. The ratio decreases because of the increase in albedo with solar zenith angle, which is a characteristic feature of plane-parallel clouds. Adding dust or aerosol to the cloud layers, to make them absorb at visible wavelengths, makes the instantaneous cloud forcing ratio larger for an overhead Sun but also makes the solar zenith angle dependence in the cloud forcing ratio more pronounced. These two effects cancel, eliminating interstitial aerosol as a possible explanation for the excess cloud absorption in plane-parallel radiative transfer modeling. The strong dependence of the surface/top of the atmosphere cloud forcing ratio on solar zenith angle may be a fundamental defect with the plane-parallel approach to solar radiative transfer in a cloudy atmosphere.
|
| [5] |
Observed relationship between surface specific humidity, integrated water vapor, and longwave downward radiation at different altitudes [J].
[1] Atmospheric water vapor and surface humidity strongly influence the radiation budget at the Earth's surface. Water vapor not only absorbs solar radiation in the atmosphere, but as the most important greenhouse gas it also largely absorbs terrestrial longwave radiation and emits part of it back to the surface. Using surface observations, like longwave downward radiation (LDR), surface specific humidity (q) and GPS derived integrated water vapor (IWV), we investigated the relation between q and IWV and show how water vapor influences LDR. Radiation data from the Alpine Surface Radiation Budget (ASRB) network, surface humidity from MeteoSwiss and GPS IWV from the STARTWAVE database are used in this analysis. Measurements were taken at four different sites in Switzerland at elevations between 388 and 3584 m above sea level and for the period 2001 to 2005. On monthly means the analysis shows a strong linear relation between IWV and q for all-sky as well as for cloud-free situations. The slope of the IWV-q linear regression line decreases with increasing altitude of the station. This is explained by the faster decrease of IWV than of q with height. Both q and IWV are strongly related with LDR measured at the Earth's surface. LDR can be parameterized with a power function, depending only on humidity. The estimation of LDR with IWV has an uncertainty of less than 5% on monthly means. At lower altitudes with higher humidity, the sensitivity of LDR to changes in q and IWV is smaller because of saturation of longwave absorption in the atmospheric window.
|
| [6] |
An analysis of diurnal variations of atmospheric features over the northern region of the himalayas in spring [J].喜马拉雅北部地区春季大气特征及日变化分析 [J].Magsci 摘要
<p>利用珠峰北部地区的观测资料和AIRS卫星遥感资料,分析了喜马拉雅北部地区的大气日变化及其垂直结构。结果发现喜马拉雅北部地区气温日变化具有明显的单峰单谷型特征,一天气温最高值出现在18:00左右,最低值出现在早上7:00~9:00。风速的日变化呈现单峰型特征。气压的平均日变化呈双峰双谷型分布特征,气压极大值出现在2:00和12:00,气压极小值出现在6:00和19:00时,其中19:00出现气压最小值。感热通量、潜热通量的平均日变化和气温日变化具有一致性,春季感热通量大于潜热通量。净辐射通量的日变化特征是单峰型特征,每日最大值出现的时间比感热通量及潜热通量的最大值出现的时间早2个小时。引起高原地区日变化剧烈有2个主要原因:一是高原地区大气柱的质量较小,对太阳辐射的削弱较小,且相同的辐射加热和冷却可使较少大气产生较大温度变化;二是高原地区是大气云光学厚度较小的区域,由此可使地面在日间接受较强烈的太阳短波辐射而增温较大,在夜间又接受较小的大气长波逆辐射而降温较大。</p>
|
| [7] |
Analysis of aerosol radiative properties and surface radiation characteristics over Lanzhou in the winter of 2008 [J].2008年冬季兰州气溶胶辐射特性及地表辐射特征分析 [J].
利用2008年1月10日至2月16日兰州地区地面长短波辐射和 积分浑浊度仪等观测资料,分析了气溶胶光学厚度和散射特性、气溶胶对辐射能量平衡的影响、长短波辐射特征以及云对太阳短波辐射的影响.结果表明:观测期间 气溶胶光学厚度较大,869.5 nm气溶胶光学厚度平均为0.57,大气浑浊度系数较高,大于0.2.日平均气溶胶光学厚度与地表短波辐射变化趋势相反.气溶胶总散射系数呈双峰型日变化 特征,且与风速呈负相关,与相对湿度呈正相关.不同天气类型下地面长波辐射表现不同的特点,晴天波动小,阴天和降雪天振荡较大;短波辐射具有明显的日变化 特征,云对短波辐射的影响非常显著.
|
| [8] |
Observed reductions of surface solar radiation at sites in the United States and worldwide from 1961 to 1990 [J].
Surface solar radiation revealed an estimated 7 W/mor 4% decline at sites worldwide from 1961 to 1990. Here I find that the strongest declines occurred in the United States sites with 19 W/mor 10%. The clear sky optical thickness effect accounts for -8 W/mand the cloud optical thickness effect for -18 W/min three decades. If the observed increases in cloud cover frequencies are added to the clear sky and cloud optical thickness effect, the higher all sky reduction in solar radiation in the United States can be explained. It is shown that solar radiation declined below cloud-free sky because of the reduction of the cloud-free fraction of the sky itself and because of the reduction of clear sky optical thickness. Solar radiation exhibits no significant changes below cloud-covered sky because reduced cloud optical thickness is compensated by increased frequencies of hours with overcast skies.
|
| [9] |
Global dimming and global brightening-an analysis of surface radiation and cloud cover data in northern Europe [J].
There has been a general tendency to attribute the majority of the observed surface solar radiation trends to aerosol changes caused by changes in anthropogenic emissions. This study stresses the importance of the contribution of clouds and the atmospheric circulation to global dimming and global brightening. Copyright 2008 Royal Meteorological Society
|
| [10] |
Spatial temporal variations of solar global radiation in Yunnan Province during 1961-2007 [J].1961—2007年云南太阳总辐射时空变化特征 [J].
根据云南省7个辐射站太阳总辐射资料和113个台站日照百分率资料,建立了1961-2007年全省太阳总辐射时间序列,运用旋转主分量方法将全省分为4个区,并在此基础上研究云南太阳总辐射的时空分布和变化特征。结果表明:云南太阳总辐射呈中部多,西南部次之,东部及西北部少的分布特征。1961-2007年呈波段减少的变化趋势,线性倾向率为-0.64%/10a,其中中部及东部显著减少,西南部略有增加。其间出现两次突变,一次是1986年的显著减少,另一次是1993年以后的回升。分析表明,相对湿度和云量是影响太阳总辐射变化的主要气象因子。
|
| [11] |
Comparison of atmospheric downward longwave radiation parameterizations [J].大气下行长波辐射参数化模型的比较 [J].
<p>利用甘肃黑河流域不同下垫面的近地面气象和辐射观测数据,对已有的12个晴天大气下行长波辐射参数化模型和8个云天模型进行比较。指出晴天情况下Idso模型和Dilley & Obrien模型最适用,但后者一定要进行系数校正,云天情况下Maykut模型误差最小。经过平均日变化分析表明,晴天模型能较好地抓住大气下行长波辐射的日变化特征,模拟结果在夜间出现较大负偏差主要是由于逆温现象引起的;云天的平均日变化特征不明显。针对模型在不同季节模拟性能不同,将盈科绿洲站点的数据集分成春夏和秋冬季节,分别得到晴天模型在相应季节的拟合系数。</p>
|
| [12] |
Enhanced shortwave radiative transfer model based on SBDART [J].基于SBDART模型的改进短波辐射传输模型 [J]. |
| [13] |
Antarctic cloud radiative forcing at the surface estimated from the ISCCP D2 and AVHRR Polar Pathfinder data sets, 1985-1993 [ |
| [14] |
|
| [15] |
An improved method for detecting clear sky and cloudy radiances from AVHRR data [J].
To obtain accurate estimates of surface and cloud parameters from satellite radiance data a scheme has to be devised which identifies cloud-free and cloud-filled pixels (i.e. fields of view). Such a scheme has been developed for application to high resolution (11 km pixel) images recorded over Western Europe and the North Atlantic by the AVHRR on the TIROS-N/NOAA polar orbiters. The scheme consists of five daytime or five night-time tests applied to each individual pixel to determine whether that pixel is cloud-free, partly cloudy or cloud-filled. The pixel is only identified as cloud-free or cloud-filled if it passes all the tests to identify that condition; otherwise it is assumed to be partly cloudy. Surface parameters (e.g. skin temperature, reflectance, vegetation index, snow cover) can then be inferred from the cloud-free radiances, and cloud parameters (e.g. cloud top temperature, optical depth and liquid water content) from the cloud-filled radiances. Only fractional cloud cover is derived from the partly cloudy pixels which, together with the number of cloud-filled pixels, gives total cloud cover over a given area. The scheme has been successfully applied to data for all seasons, including images with unusually cold or warm surface temperatures. To assess the method both daytime and night-time NOAA-9 passes over the U.K. were obtained for a week in April 1985 and some results from this data set are presented here.
|
| [16] |
Remotely Sensed Data and Information .
|
| [17] |
An automatic cloud detection method for ZY-3 satellite [J].资源三号测绘卫星自动云检测 [J].
<p>光学卫星遥感影像自动云检测是卫星产品生产系统的一个重要环节.利用资源三号卫星编目生成的浏览图,采用树状判别结构进行云检测,对浏览图进行分块,提取子块图像的特征进行云地分类.由于云类和地物类过于繁杂,且浏览图的分辨率较低,传统通过图像特征对云地进行分类的算法有很大的局限性,针对这一问题,本文提出了在分类之前对原始的子块图像进行增强处理,扩大云和地物的纹理差异,然后以二阶矩、一阶差分等作为云地分类的图像特征,并在多尺度空间内进行特征延拓,经过综合分析估计云在影像中的比例.该云检测算法应用于资源三号卫星应用系统工程,实际测试结果表明,该算法能够较好地提升云量检测的准确率.</p>
|
| [18] |
A multi-temporal method for cloud detection, applied to FORMOSAT-2, VENμS, LANDSAT and SENTINEL-2 images [J]. |
| [19] |
Characterization of the Landsat-7 ETM+ Automated Cloud-Cover Assessment (ACCA) Algorithm [J].
A scene-average automated cloud-cover assessment (ACCA) algorithm has been used for the Landsat-7 Enhanced Thematic Mapper Plus (ETM+) mission since its launch by NASA in 1999. ACCA assists in scheduling and confirming the acquisition of global "cloud-free" imagery for the U.S. archive. This paper documents the operational ACCA algorithm and validates its performance to a standard error of 5 percent. Visual assessment of clouds in three-band browse imagery were used for comparison to the five-band ACCA scores from a stratified sample of 212 ETM+ 2001 scenes. This comparison of independent cloud-cover estimators produced a 1:1 correlation with no offset. The largest commission errors were at high altitudes or at low solar illumination where snow was misclassified as clouds. The largest omission errors were associated with undetected optically thin cirrus clouds over water. There were no statistically significant systematic errors in ACCA scores analyzed by latitude, seasonality, or solar elevation angle. Enhancements for additional spectral bands, per-pixel masks, land/water boundaries, topography, shadows, multi-date and multi-sensor imagery were identified for possible use in future ACCA algorithms.
|
| [20] |
The bias analysis of FY-2G cloud fraction in summer and winter [J].FY-2G卫星冬夏云量产品偏差分析 [J]. |
| [21] |
Using ISCCP D2 data to analyze the change of cloud cover and its possible impacts on climate in recent 20 years in the world [J].利用ISCCP D2资料分析近20年全球不同云类云量的变化及其对气候可能的影响 [J].
利用ISCCP最新的D2云气候资料集,给出总云量及高、中、低云在全球的分布特征;用趋势分析方法分析了近20年来全球不同云类云量的变化趋势.结果表明:这期间全球平均总云量总的变化趋势为减少,但在1987年以前总云量稍有增加,此后转为减少,减少量约占全球平均云量的4%.其中,低云和高云云量呈减少态势,而中云量稍有增加.从云量变化趋势在全球的分布看,存在较大的区域差异,不同云量变化趋势具有显著的区域性.初步分析指出,在全球增温的气候背景下,云量的变化对当前气候可能是一个正反馈过程,即近年来云量的减少可能促使全球气候更加趋于变暖。
|
| [22] |
GF-4 satellite remote sensing technology innovation [J].“高分四号”卫星遥感技术创新 [J].
“高分四号”卫星是中国首颗地球静止轨道高分辨率光学遥感卫星,是国家高分辨率对地观测系统重大专项工程的重要组成部分。“高分四号”卫星将高时间分辨率和较高空间分辨率相结合,为减灾、气象、地震和林业等多个行业的应用提供遥感数据服务,并为海洋、国土和水利等行业以及国防建设提供遥感数据支持,实现中国民用高分卫星研制和卫星遥感应用领域的新突破。文章分析了“高分四号”卫星在运行轨道、探测手段、控制体制等多方面的任务特点,总结了卫星总体设计技术、高精度控制技术、复杂条件下像质保障技术、高精度热控技术、高可靠长寿命技术等创新点,为中国静止轨道高分辨率光学遥感领域后续发展提出重要建议。
|
| [23] |
Cloud cover detection algorithm for EO-1 Hyperion imagery [ |
| [24] |
Research on cloud detection method based on GMS-5 satellite data [J].基于GMS-5卫星资料的云检测方法研究 [J].
由于云对地球气候变化起着重要作用,对云进行监测是研究全球气候变化的重要环节。目前,各国的气象专家和爱好者们都十分关注对云的监测研究,因此云检测已经成为了当前的热点话题。利用日本的GMS-5气象卫星资料进行了云检测研究。采用红外亮温法对云进行粗检测,然后利用相似离度法、空间一致性检测以及可见光反射率进行晴空检测。最终结果表明,通过结合使用这三种方法进行云检测,能够很好地判断是晴空辐射还是含云辐射。
|
| [25] |
Method of cloud detection with hyperspectral remote sensing image based on the reflective characteristics [J].基于反射率特性的高光谱遥感图像云检测方法研究 [J].
为了提高光谱遥感图像数据的利用率,提出了一种基于光谱反射率特性的星载高光谱图像云检测方法。首先分析了各类地物在不同光谱下的反射率特征,根据其特点从星载高光谱图像中选取特定5个波长的图像数据,然后依照图像地物反射率及阈值判定法区分出高云区和中低云区,最后对二者合并,得到目标云区。试验结果表明,该方法的云检测率可达90%以上,虚警率在1%以内,可以准确区分云与雪地区域、沙漠区域以及植被区域,实现云检测。
|
| [26] |
Application of time series in FY-2C cloud detection [J].时间序列在FY2C云检测中的应用 [J]. |
| [27] |
SBDART: A research and teaching software tool for plane-parallel radiative transfer in the Earth’s atmosphere [J].
SBDART is a software tool that computes plane-parallel radiative transfer in clear and cloudy conditions within the earth's atmosphere and at the surface. All important processes that affect the ultraviolet, visible, and infrared radiation fields are included. The code is a marriage of a sophisticated discrete ordinate radiative transfer module, low-resolution atmospheric transmission models, and Mie scattering results for light scattering by water droplets and ice crystals. The code is well suited for a wide variety of atmospheric radiative energy balance and remote sensing studies. It is designed so that it can be used for case studies as well as sensitivity analysis. For small sets of computations or teaching applications it is available on the World Wide Web with a user-friendly interface. For sensitivity studies requiring many computations it is available by anonymous FTP as a well organized and documented FORTRAN 77 source code.
|
| [28] |
Estimation of global and net solar radiation at the Earth surface under cloudy-sky condition [J].云天地表总辐射和净辐射瞬时值的计算方法 [J].
为减少计算机时,满足实时预报要求,全球数值预报模式中的辐射计算频率通常设定为3h。这样处理会大大减少计算量,但同时导致较大的辐射日变化偏差,并影响模式对地面能量平衡、对流及降水的模拟。为改进这一缺陷,建立了一种辐射快速计算方案,可用于计算瞬时地面太阳总辐射和净辐射,使到达地面的太阳辐射计算可与模式积分同步进行,改善地面太阳辐射日变化模拟。本文介绍云天情况下的总辐射和净辐射计算方案,该方案所用的输入变量均为预报模式或卫星观测提供。结果表明:该方案既可用于数值预报模式,也可利用观测资料独立计算地面太阳辐射。通过使用美国能源部大气辐射观测资料检验,证明该方案的精度高,地面总辐射瞬时值的平均计算误差小于7%。
|

/
| 〈 |
|
〉 |
