风成红黏土序列磁化率各向异性特征对区域应力变化的响应
高新勃1,2, 强小科1,*, 赵辉1,2, 陈艇1,2
1.中国科学院地球环境研究所,黄土与第四纪国家重点实验室,陕西 西安 710075
2.中国科学院大学,北京 100049
强小科(1969-),男,陕西岐山人,研究员,主要从事磁性地层学、岩石磁学、新生代地质与全球变化研究.

高新勃(1989-),男,陕西铜川人,硕士研究生,主要从事环境磁学研究.E-mail:gxbpaleomag@foxmail.com

摘要

对六盘山以西132 m水洛红黏土剖面磁化率各向异性特征的研究表明,水洛红黏土剖面记录的14.8~8.7 Ma沉积序列受到了同沉积时期不同程度的应力作用,磁化率各向异性变化特征对应于应力作用强度较弱的初期和应力作用强度有所加强的中期。进一步分析发现,14.8~11.0 Ma之间显示出3次应力增强和后续应力减弱交替变化的特点,这一应力作用事件可能与青藏高原东北缘在此阶段强烈构造活动的区域应力传递相关,而11.0~8.7 Ma期间存在一个相对较强的应力作用事件,可能是对局部地区应力增强事件的响应。

关键词: 磁化率各向异性; 红黏土; 应力变化
中图分类号:P318 文献标志码:A 文章编号:1001-8166(2014)03-0369-380
Anisotropy of Magnetic Susceptibility Response to the Regional Stress Variation in Aeolian Red Clay Sequence
Gao Xinbo1,2, Qiang Xiaoke1, Zhao Hui1,2, Chen Ting1,2
1. State Key Laboratory of Loess and Quaternary Geology, Institute of Earth Environment, Chinese Academy of Sciences, Xi#cod#x02019;an 710075
2. University of Chinese Academy of Sciences, Beijing 100049, China
Abstract

The Aeolian sediment sequences from the Chinese Loess Plateau record abundant paleoclimatic and paleoenvironmental information, while little is known about whether there were any stress effect during the sedimentary period. In terms of tracking stress variation, anisotropy of magnetic susceptibility(AMS) has some particular advantages in comparison with other traditional methods. Systematic magnetostratigraphy, rock magnetism and anisotropy of magnetic susceptibility analysis were carried out on Shuiluo Aeolian red clay profile, which is located at the western Liupan Mountain. In the field, there are not any obvious tectonic traces that can be observed, which indicates the primitive deposit, but AMS results have many distinct differences between Shuiluo aeolian red clay profile and other typical aeolian sediment sequences(loess/paleosol, red clay). These differences mainly manifest from the following aspects. Firstly, abundant magnetic ellipsoid is located in the prolate area; Secondly, the stereonet projections of theκmax andκmin principle axes of AMS ellipsoids show that theκmax axes are well grouped in an approximately east-west direction, while theκmin shows a slight girdle in an approximately north-south direction; and in addition, thePj-T diagram shows that the magnetic ellipsoid is being transition from oblate to prolate magnetic ellipsoid. These characteristics listed above suggested that Shuiluo red clay profile had gone through a weakly stress effect, and comparing with previous research we infer that these AMS characteristics be correspondent to the incipient deformation with a weaker stress intensity and the moderate deformation with a stronger stress intensity. After further classification, comparison and using a variety of analysis methods, we find that from 14.8 Ma to 11.0 Ma, the stress state is accompanied by three stress increase and decrease alternately, and these stress effects may correspond to the stress from the northwest Tibetan plateau. In about 11.0~8.7 Ma, AMS shows a strong stress effect, and almost all AMS ellipsoid is located in the prolate magnetic ellipsoid area. At the same time, theκminaxes shows a strong girdle in an approximately north-south direction and it should be in response to the stress increasing in the local area.

Keyword: Anisotropy of magnetic susceptibility; Red clay; Stress variation.
1 引言

近年来,磁化率各向异性(Anisotropy of Magnetic Susceptibility, AMS)研究主要集中于沉积动力方向判定和沉积序列构造扰动两大问题上。沉积动力方向判定方面,Hus[ 1]对亚洲、欧洲和西伯利亚黄土—古土壤剖面研究指出,中国午城黄土上部AMS最大轴方向可能指示了优势古风向;Lagroix等[ 2]研究了阿拉斯加黄土AMS特征,指出风成沉积物AMS信息能够指示沉积颗粒的搬运方向,由此可以推断当时盛行的动力方向;Zhu等[ 3]对末次间冰期以来黄土剖面的AMS研究,不仅论述了AMS所反映的古风向问题,而且提出AMS具有记录古气候、古环境信息的特点;张睿等[ 4, 5]和旺罗等[ 6]通过对中国黄土高原多个剖面的系统研究,利用各种统计方法分析AMS所指示的动力方向特征,提出了夏季风主导磁组构的观点;同时也有学者对长江三角洲河流沉积物AMS特征进行了研究,揭示出AMS记录的优势水动力方向[ 7]

沉积序列构造扰动方面,Piazolo等[ 8]提出磁线理的变化可能是颗粒原始粒径和变形重结晶后粒径比值的函数;Parés等[ 9]对比利牛斯山和阿巴拉契压山区的泥岩、板岩和片岩磁线理特征进行了研究,随后Parés[ 10]系统阐述了泥岩所记录的微弱构造扰动初期的磁组构(magnetic fabric)特征,文中观点对缺乏或没有野外构造遗迹沉积序列所涉及的构造扰动问题研究具有指导性意义;Lagroix等[ 11]指出阿拉斯加黄土剖面不同深度处可能经历了多次沉积后扰动作用,磁组构揭示的后期扰动方向可以与野外微弱的构造遗迹相对比;近期,Charreau等[ 12]、Huang等[ 13]和Tang等[ 14]对天山地区第三纪河流相、湖相和冲积扇沉积物进行了磁化率各向异性研究,用AMS特征揭示出天山在晚新生代时期的构造隆升过程。

可以看出,中国黄土高原风成沉积(黄土—古土壤、红黏土)磁化率各向异性特征不仅可以反映沉积固结期优势动力方向[ 3~ 6],而且也记录了一定的古气候和古环境信息[ 3],其他新生代沉积物也都广泛记录了沉积区的应力变化过程[ 12~ 14]。但是作为古气候、古环境和高原隆升研究的理想对象,中国风成沉积记录应力作用的报道却很少。磁化率各向异性为我们提供了一个快速灵敏的确定岩石磁组构的方法,它不仅可以研究特定环境下岩石的有限应变,而且可以对几乎显示无应变痕迹的沉积物进行应力分析[ 10, 15~ 17]。六盘山以西庄浪一带保存了迄今为止最厚、高分辨率的红黏土堆积[ 18],为进行详细古气候、古环境和构造活动研究提供了良好的研究对象。所以,本文主要通过对六盘山以西水洛风成红黏土序列进行详细的磁化率各向异性研究,旨在探讨中国黄土高原风成沉积序列是否具有经受应力作用信息的记录,以及揭示其所记录的应力变化特点和相关的构造地质背景信息。

2 研究区概况与样品采集

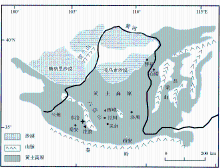
水洛剖面(35°13'N,106°05'E)位于甘肃中部,六盘山以西的黄土高原地区,为庄浪钻孔[ 18]附近一个露天剖面,距庄浪钻孔西北大约2 km,距秦安剖面[ 19]东北大约50 km(图1)。

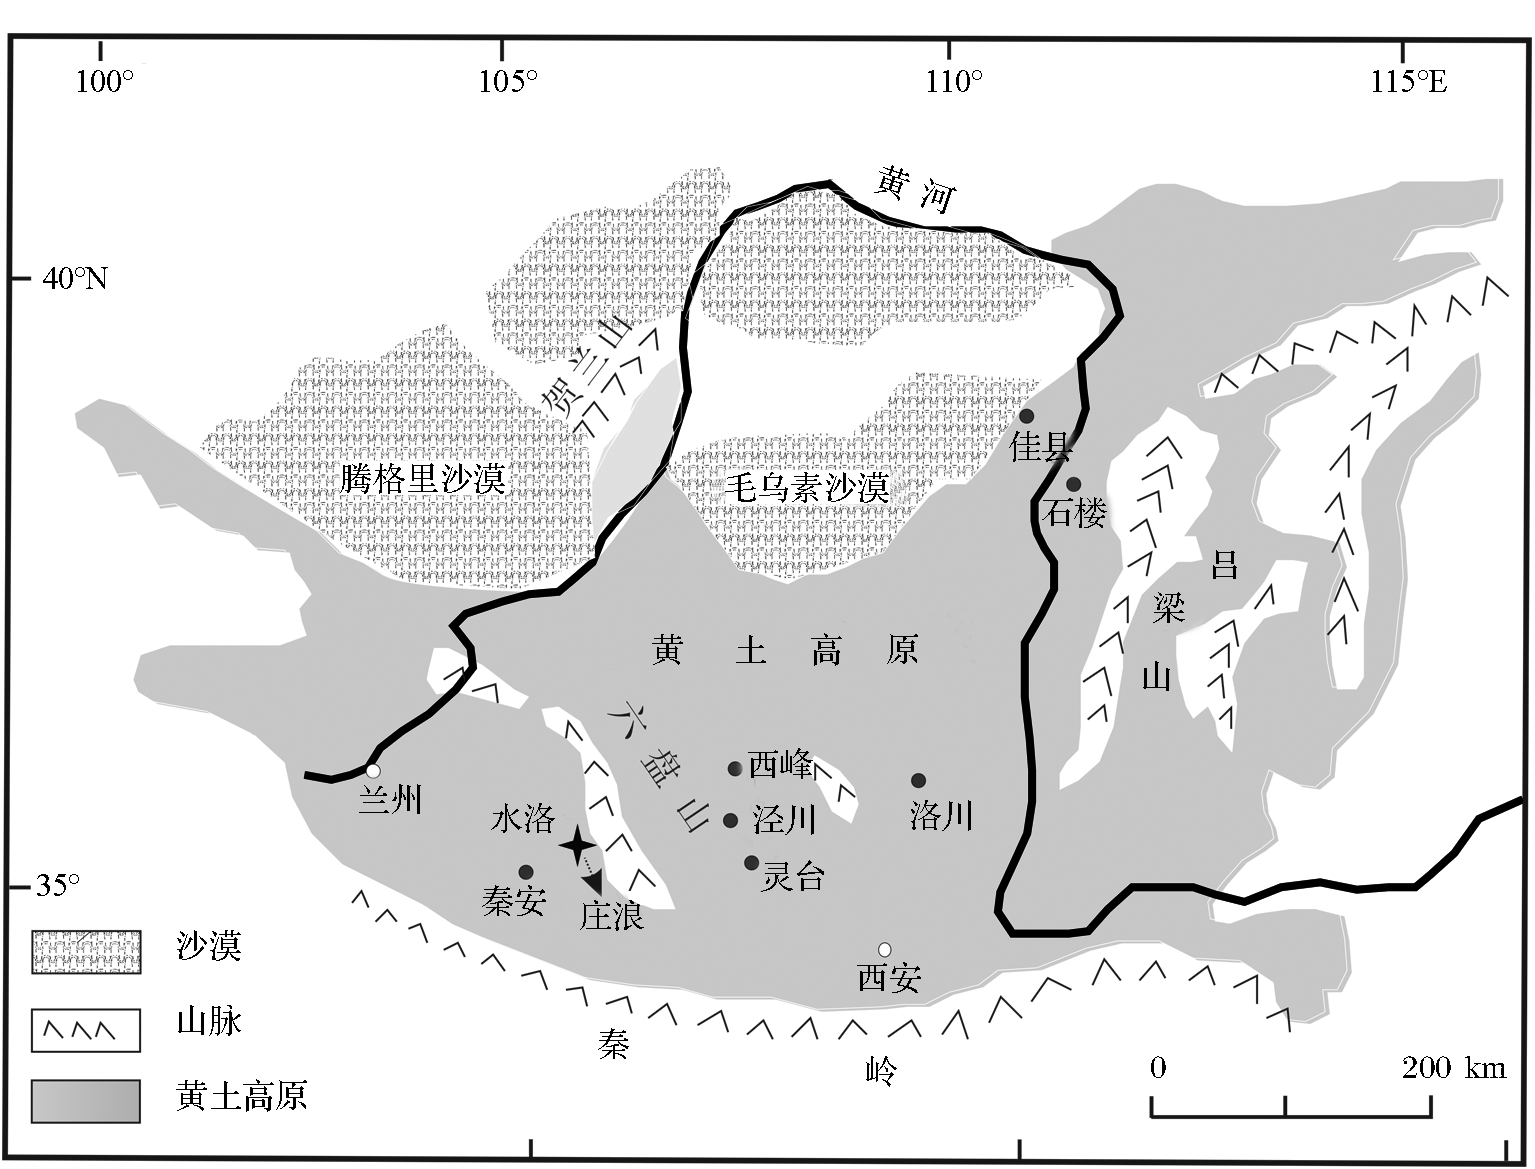
图1 黄土高原水洛剖面位置图(修改自文献[18])Fig.1 Location of Shuiluo profile on the Chinese Loess Plateau(modified after reference[18])

构造背景上,六盘山为青藏高原东北缘构造活跃的东祁连造山带与西秦岭造山带接合部,水洛剖面位于陇中盆地与六盘山西麓的交界地带,属祁连山—秦岭褶皱区。因此,研究区不但受到北秦岭和海源断裂等构造的直接控制,也受到青藏高原东北缘整体构造体系的影响[ 20, 21]

水洛红黏土剖面与其他红黏土剖面类似,显示出比较均一单调的变化特点:无水平层理,以棕红—棕黄色黄土/弱成壤黄土与古土壤和零星散布的钙质结核交替出现为特征,前者呈棕黄色,粉砂质结构,后者呈深棕红—棕红色,团粒结构明显,可见暗色胶膜;钙质结核在古土壤层呈颗粒状,黄土层内呈斑块状;剖面野外天然露头共计134 m,顶部2 m由于坡积物质较多而未采样。为了获得可靠的原始状态的样品,野外采样时将表层20~50 cm的风化层去掉,采集新鲜面的样品,从剖面顶部2 m开始以20 cm间距连续采集15 cm×15 cm×15 cm的定向块样和粉末样品,取样深度共计132 m,共得到661块古地磁定向样品和同等数量的粉末样品。在室内将野外采集的古地磁定向样品加工成2 cm×2 cm×2 cm的立方体小块,每块样品分别加工出3套平行样品,保证了古地磁和岩石磁学各项实验所需样品。

3 试验方法

样品系统热退磁采用ASC Scientific TD-48热退磁仪,以10~50 ℃为间隔逐步加热到690 ℃,每步退磁之后使用2G 755超导磁力仪进行剩磁测量,为了避免外界磁场的干扰,所有实验均在零磁空间内进行。质量磁化率( χ)使用Bartington MS 2 磁化率仪进行测量,磁化率随温度( χ-T)变化曲线采用捷克AGICO公司生产的卡帕桥MFK1A多频磁化率仪进行测量,为了避免加热过程中样品被氧化,整个实验均在氩气环境下进行。等温剩磁(IRM)利用ASC IM-10-30脉冲磁化仪对样品加脉冲场,之后用AGICO公司生产的JR6A双速自动旋转磁力仪完成剩磁的测量。样品的体积磁化率( κ)和磁化率各向异性(AMS)测量也使用卡帕桥MFK1A多频磁化率仪进行测量,测量精度为2×10⁻⁸SI,外场强度为200 A/m,测试频率为976 Hz,每个样品都进行了3个相互垂直方向的测量,磁化率各向异性椭球体由最小二乘法获得,所需的各向异性参数可由程序通过Jelinek[ 22]方法自动算出。所有试验均在中国科学院地球环境研究所环境磁学实验室完成。

4 岩石磁学结果与分析

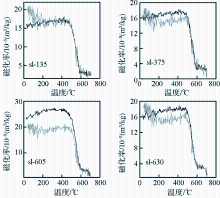
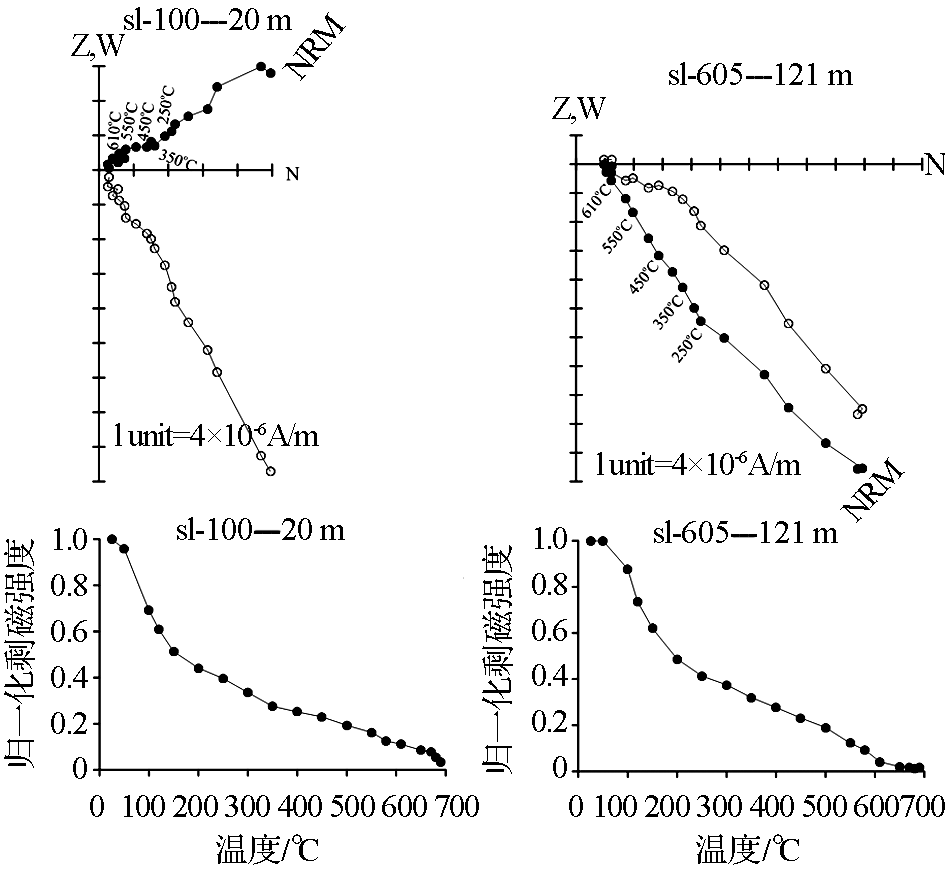
磁化率随温度( χ-T)变化曲线(图2)显示,加热过程中所有样品在磁铁矿的居里温度点585 ℃附近都显示了急剧的降低,表明沉积物含有大量磁铁矿。继续加热至685 ℃,样品的磁化率仍有所降低,表明样品中也含有赤铁矿[ 23]

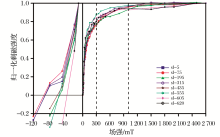
典型样品等温剩磁(IRM)获得曲线(图3)也显示了相同的结果,所有样品在300 mT以前显示了急剧升高的特征,反映低矫顽力磁铁矿的存在。但是300 mT时磁化强度只达到了饱和磁化强度的80%左右,而且所有样品在1 000 mT都未饱和,反映高矫顽力赤铁矿的存在,反向退磁场也证明了这一点。IRM获得曲线谱分析表明,高矫顽力组分贡献在14.8%~50.1%之间,平均为36.36%,也验证了高矫顽力组分的大量存在。

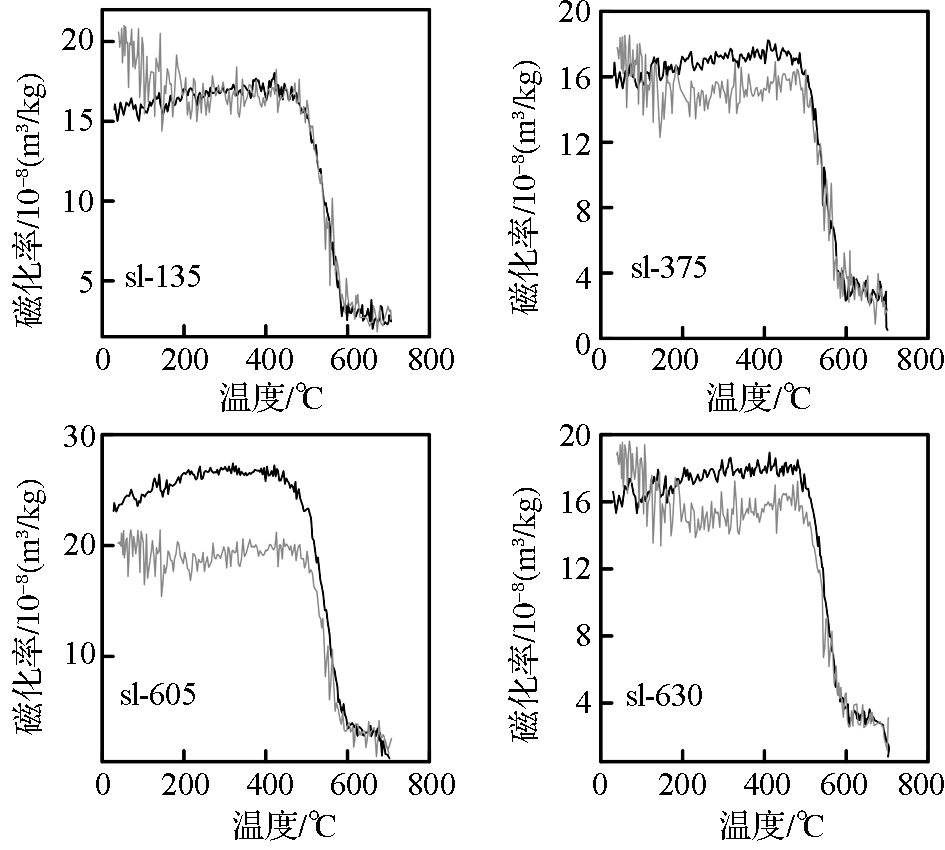
图2 水洛红黏土剖面典型样品的磁化率( χ) 随温度( T)变化曲线黑线代表加热过程,灰线代表冷却过程Fig.2 χ-T curves of the representative samples of Shuiluo red clayBlack and gray lines refer to heating and cooling curves, respectively

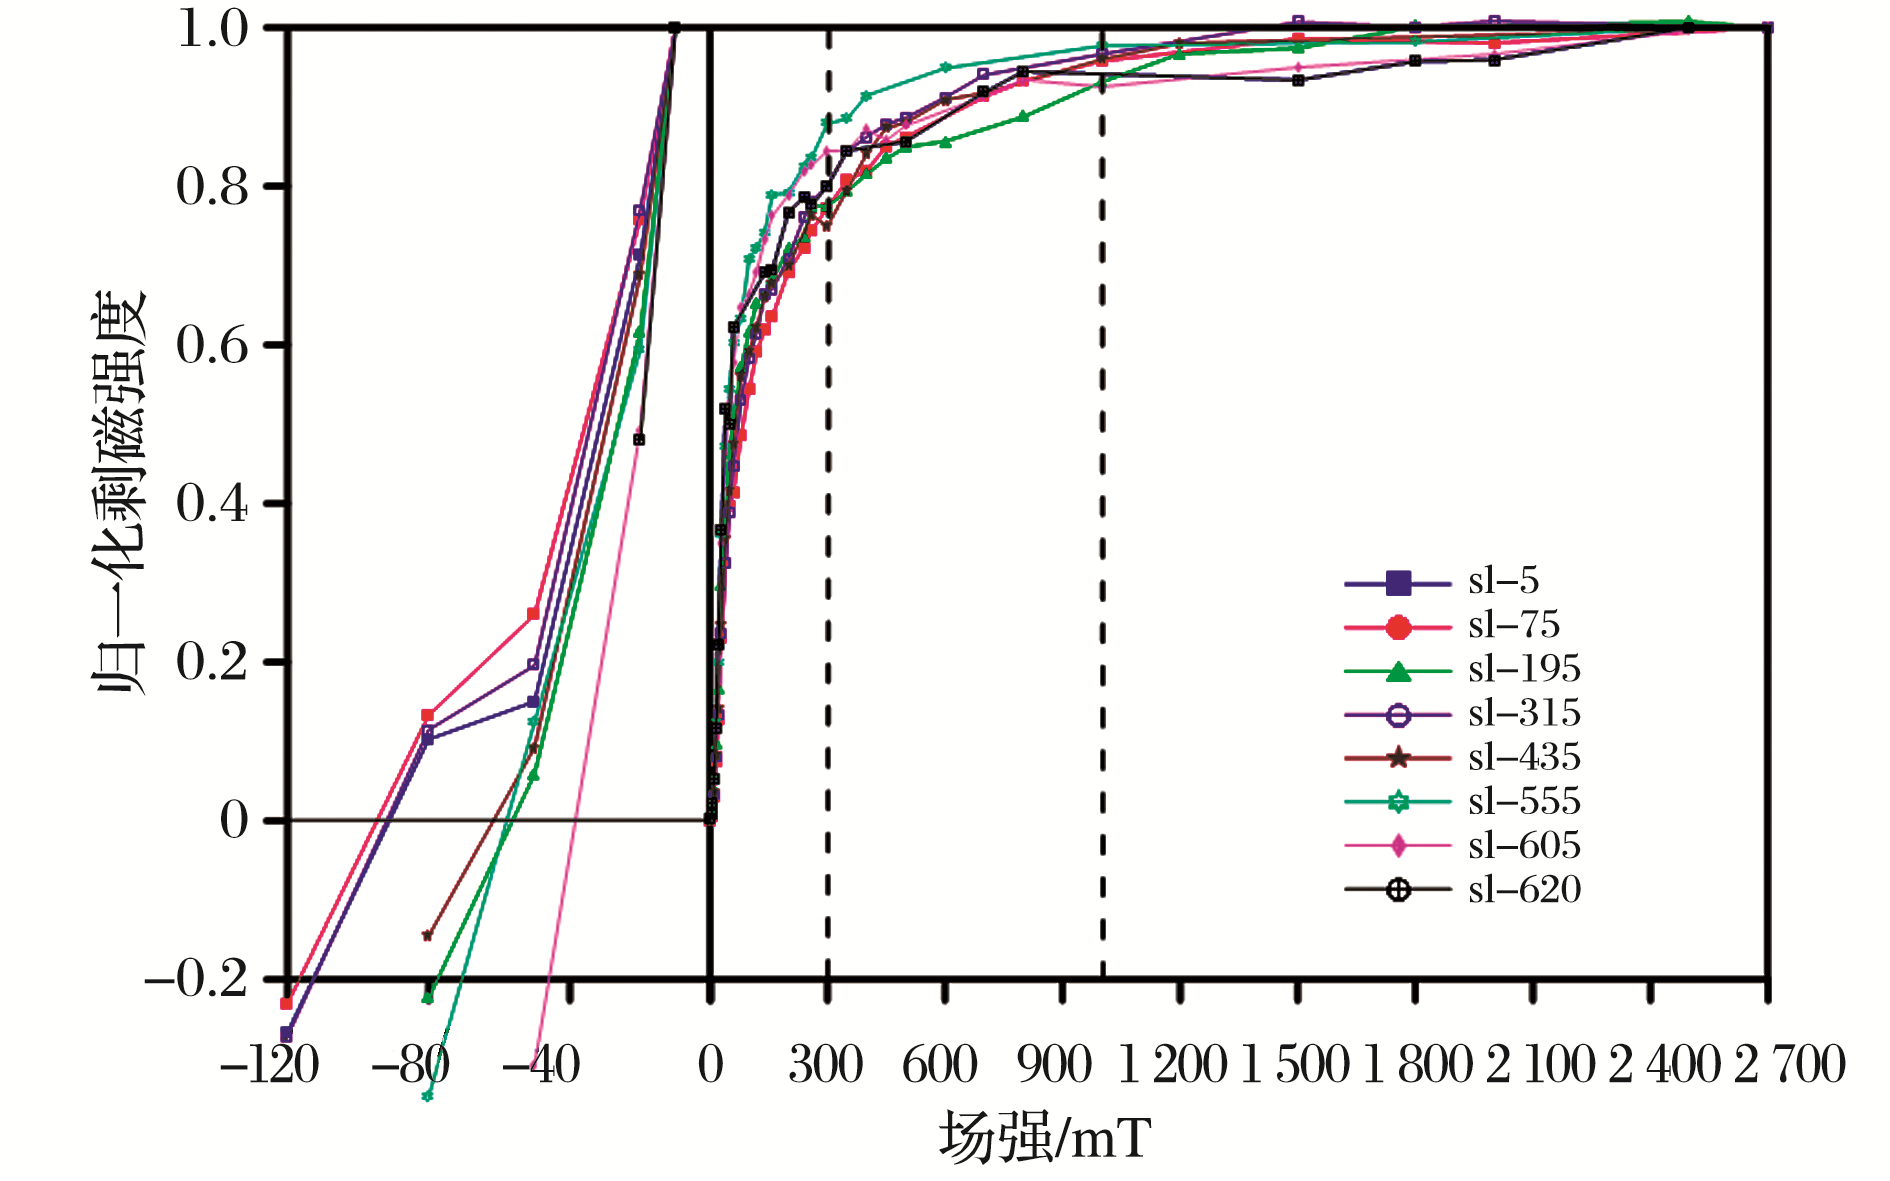
图3 水洛红黏土剖面典型样品的等温剩磁(IRM) 获得曲线与反向场退磁曲线Fig.3 IRM acquisition and demagnetization curves for the representative samples of Shuiluo red clay

综合上述实验证据可以得出,水洛红黏土磁性矿物以磁铁矿为主,同时含有大量高矫顽力的赤铁矿,即磁铁矿和赤铁矿共同决定了水洛红黏土的磁化率和磁化率各向异性特征。

5 磁性地层结果与分析

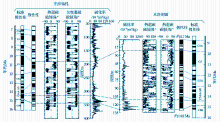
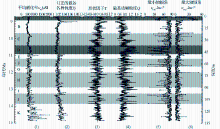
为了获得水洛红黏土序列的年代框架,我们对661块古地磁定向样品进行了系统热退磁实验,所有样品退磁温度点均为25~690 ℃,共计19步。使用正交投影法和主成分分析法对热退磁获得的特征剩磁(ChRM)进行分析[ 24],水洛红黏土典型样品热退磁结果的正交矢量投影图和剩磁衰减图(图4)显示,大多数样品在加热至585 ℃时就能分离出稳定的特征剩磁,表明磁铁矿是特征剩磁的主要载体。根据热退磁所获得的特征剩磁方向,建立了水洛红黏土剖面的磁极性序列(图5)。

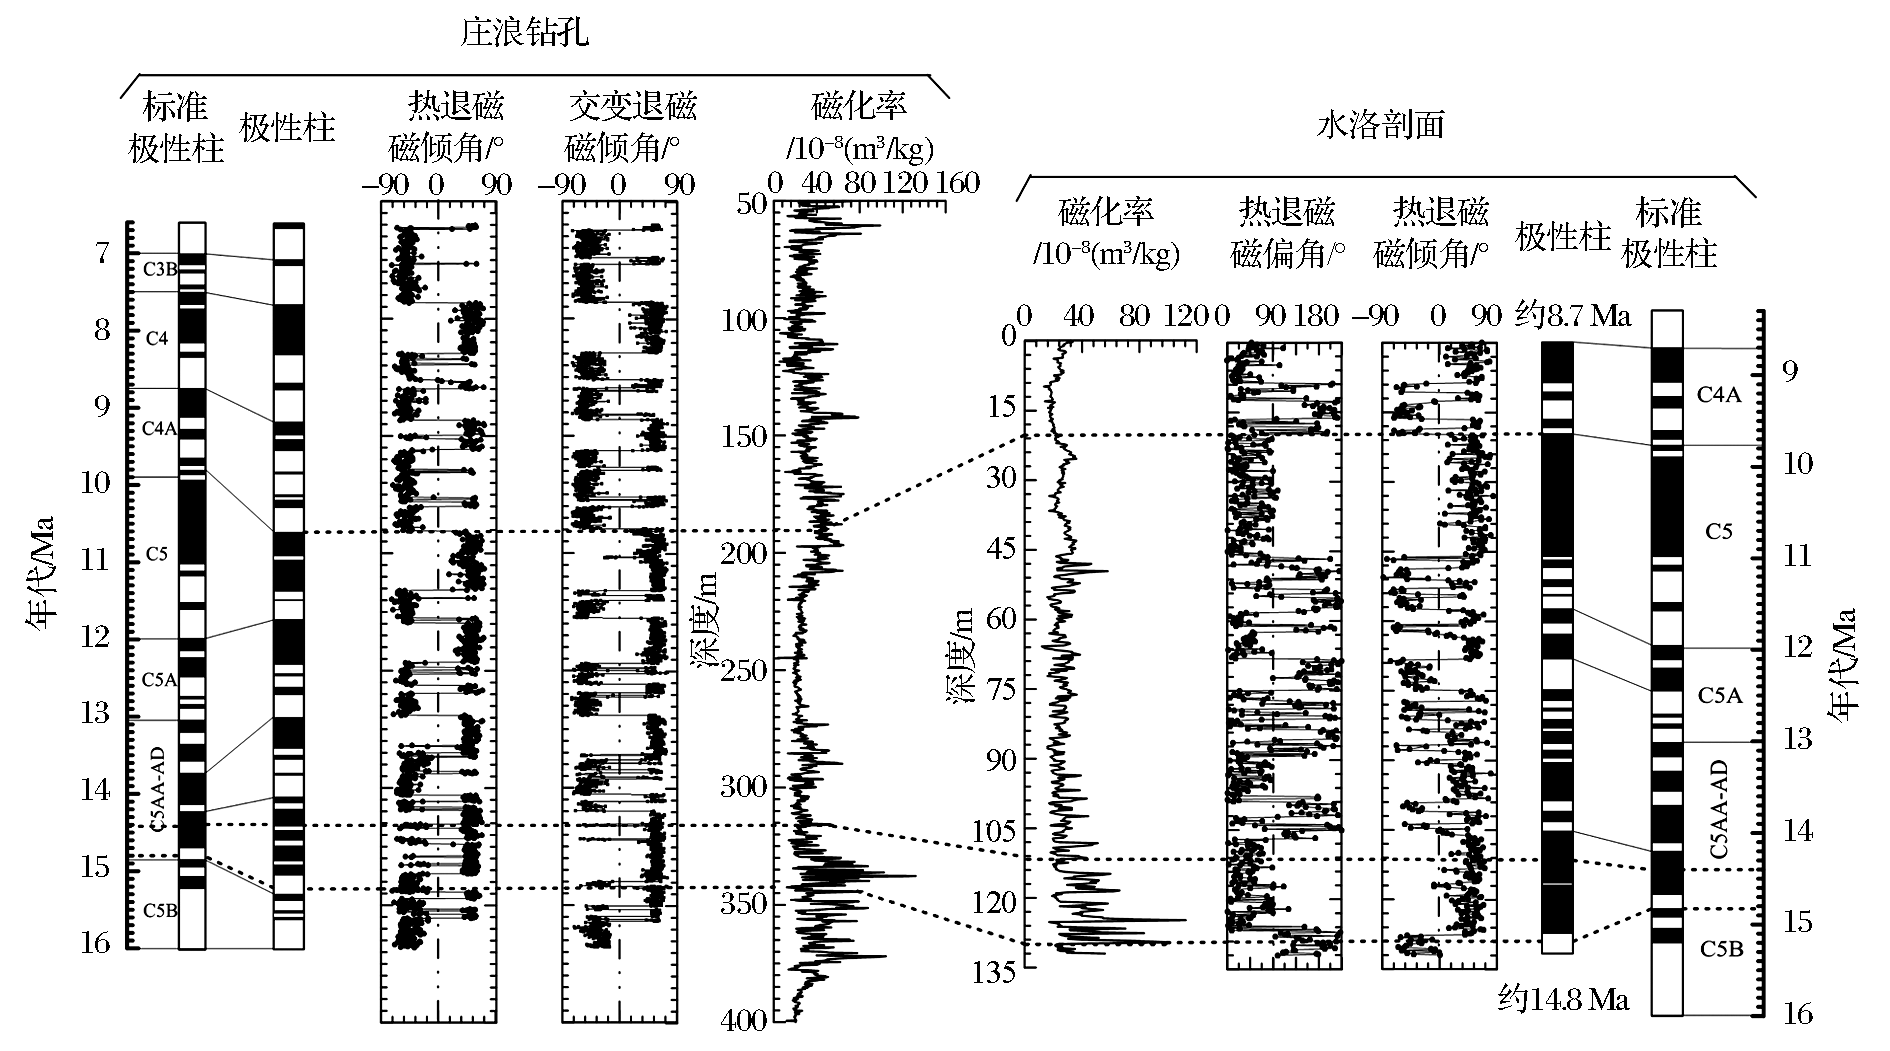
由于中新世风成堆积的磁化率可以作为远距离地层对比的有效指标[ 25~ 28],据此将获得的水洛剖面磁化率与其附近庄浪钻孔[ 18]磁化率进行对比。不同中新世红黏土剖面磁化率最为明显的特征是:在中中新世大暖期时期由于气候变暖[ 29~ 31],加上东亚冬夏季风增强导致磁铁矿和磁赤铁矿含量增加[ 32~ 35],最终使得中中新世大暖期红黏土磁化率值明显增高。水洛剖面红黏土磁化率也显示出明显增强的特征(图5),以此为特征与附近庄浪钻孔[ 18]磁化率进行对比,用以确定水洛剖面关键的年龄控制点。图5中显示水洛剖面在111.2~129.6 m之间的磁化率与庄浪钻孔316~344 m之间的磁化率可以进行很好的对比,局部可能由于沉积速率不同而略有差别。庄浪钻孔316~344 m深度分别对应于14.4~14.8 Ma之间的时间跨度,由此可以确定水洛剖面关键的年龄控制点,即水洛剖面底部年龄大致为14.8 Ma。根据该年龄控制点,将水洛剖面的磁极性序列与标准极性柱[ 36]进行对比(图5),从而确定了从C4A顶部到C5B顶部之间的磁性地层框架,大致时间跨度为14.8~8.7 Ma。

图4 水洛红黏土典型样品热退磁过程特征剩磁方向的正交投影图和剩磁衰减图Fig.4 Orthogonal projections of progressive thermal demagnetization and normalized intensity decay plots of Shuiluo red clay

图5 水洛剖面与庄浪钻孔磁化率[ 18]对比及水洛剖面磁性地层序列与标准极性柱[ 36]对比Fig.5 Comparison magnetic susceptibility and magnetostratigraphy of Shuiluo profile with Zhuanglang core[ 18] and Geomagnetic Polarity Time Scale[ 36]

6 磁化率各向异性结果与分析
6.1 水洛红黏土AMS与典型风成沉积AMS的差异

原始风成沉积物AMS表现为扁圆状(Oblate)各向异性椭球[ 2~ 4, 37, 38],各向异性椭球体下半球面赤平投影最小轴应垂直于层面并分布于层面中心( κmin- Inc>70°),最大轴( κmax)应离散分布于层面周围[ 2, 38, 39]。当经受弱应力作用时,最大轴就会趋向于垂直应力作用方向呈有规律的簇状分布,这时最小轴( κmin)仍然垂直于层面并分布于层面中心部位,对应磁各向异性椭球体应变为三维状(Triaxial)。当应力逐渐增大时,最小轴就会偏离层面中心位置,并沿应力作用方向展布,最大轴会变得更加集中,而且各向异性椭球体也会向长棒状(Prolate)发展( T<0)[ 10, 40, 41]。订正的各向异性度( Pj)与形状因子( T)的相关关系也可以近似表示随应力变化椭球体形状的变化,当应力增加时椭球体就会由扁圆状( T>0)向长棒状( T<0)发展[ 10]

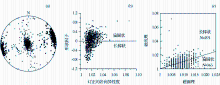
水洛红黏土AMS下半球面赤平投影(图6a)显示,最大轴呈簇状集中分布于投影层面近东西两侧,最小轴大多数显示了原始沉积的特点,同时最小轴也有一个微弱沿近南—北方向的带状展布。结合 T-Pj(图6b)也显示出各向异性椭球体有一个从原始扁圆状变成三维状再到长棒状的趋势。磁面理(F)与磁线理(L)的Flinn图(图6c)也显示了这一特征,图6c中在大量数据点处于扁圆状范围内的同时,也有几乎同等数量的数据点落在了长棒状范围内。水洛红黏土这一特点正好对应于原始沉积物受应力作用的初始阶段,或者说应力较弱阶段[ 10, 40, 41]。该应力作用使水洛红黏土AMS最大轴呈簇状垂直于近南北向分布,最小轴沿近南北向略微的展布,同时导致磁椭球体从扁圆状向三维状再到长棒状变化。

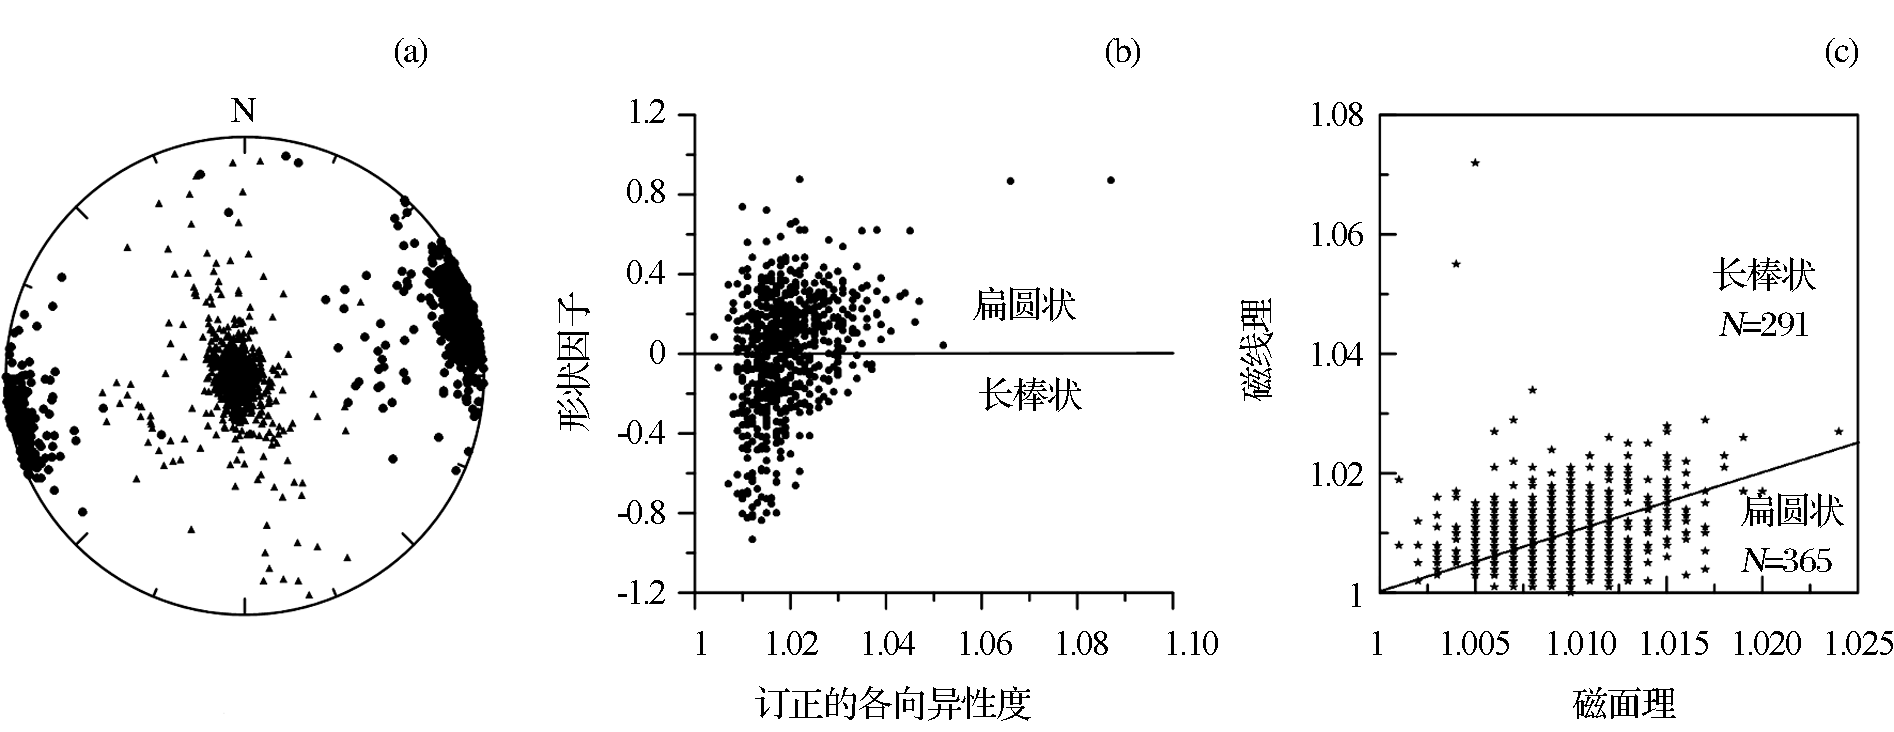
图6 水洛红黏土AMS参数综合图(a)水洛红黏土AMS最大轴和最小轴的赤平投影图,最大轴由实心的小圆形表示,最小轴由实心的小三角形表示;(b)水洛红黏土AMS T Pj的相关关系图;(c)水洛红黏土AMS F-L的Flinn图Fig.6 The systhesis AMS parameters diagram of Shuiluo red clay(a)Stereographic projection diagram for the AMS data from Shuiluo red clay, circles and triangles represent κmaxand κmin;(b) Pj-T(corrected AMS degree versus AMS shape parameter) diagram for the AMS data from Shuiluo red clay;(c) The Flinn diagram of Lineation against Foliation of Shuiluo red clay

6.2 水洛红黏土AMS结果分段

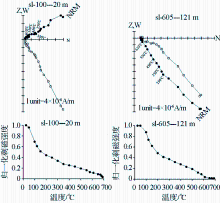
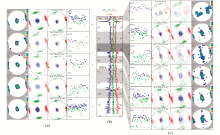
通过上述分析发现,水洛红黏土剖面可能记录了沉积过程中相对较弱初始阶段的应力作用特征。为了对这一预测进行进一步验证,对可以反映风成沉积物非原始沉积的磁各向异性参数:形状因子 T( T<0)、最小轴倾角 κmin- Inc( κmin- Inc<70°),进行随深度变化的细致划分(图7),并结合三轴磁化率( κmax, κint, κmin用以直观表示磁椭球体形状随深度的变化[ 11])、赤平投影、轮廓线和趋势图[ 4, 13, 14](图8)对水洛红黏土所记录的疑似应力作用信息进行进一步分析,结果如下:

110.8~132.0 m(层段K),89.6~97.4 m(层段I),63.4~70.6 m(层段G),48.0~53.4 m(层段E)4层段赤平投影图(图8a)都显示出最小轴分布在垂直于投影层面( κmin- Inc>70°)区域内,轮廓线图(图8a)和趋势图(图8b)也很直观地反映了这一特点,初步显示了原始沉积的磁化率各向异性特征。但是,这些层段的 T值(图7)却显示出有少量长棒状( T<0)椭球体形态, T Pj相关关系图(图8a)也显示了这一特征,三轴磁化率值(图8b)在这些层段也均显示出三维状形态( κmax> κint> κmin),最大轴呈簇状分布于近东西两侧,这些信息指示出这些层段可能受到了初始阶段微弱的应力作用[ 9, 12, 13, 40, 41]。该应力作用只对磁椭球体的形状进行了略微改变,还不足以使椭球体的位置进行翻转,所以,这些层段磁基质颗粒能够进行很好的排列,使得相应的 Pj值(图7)也比较高。

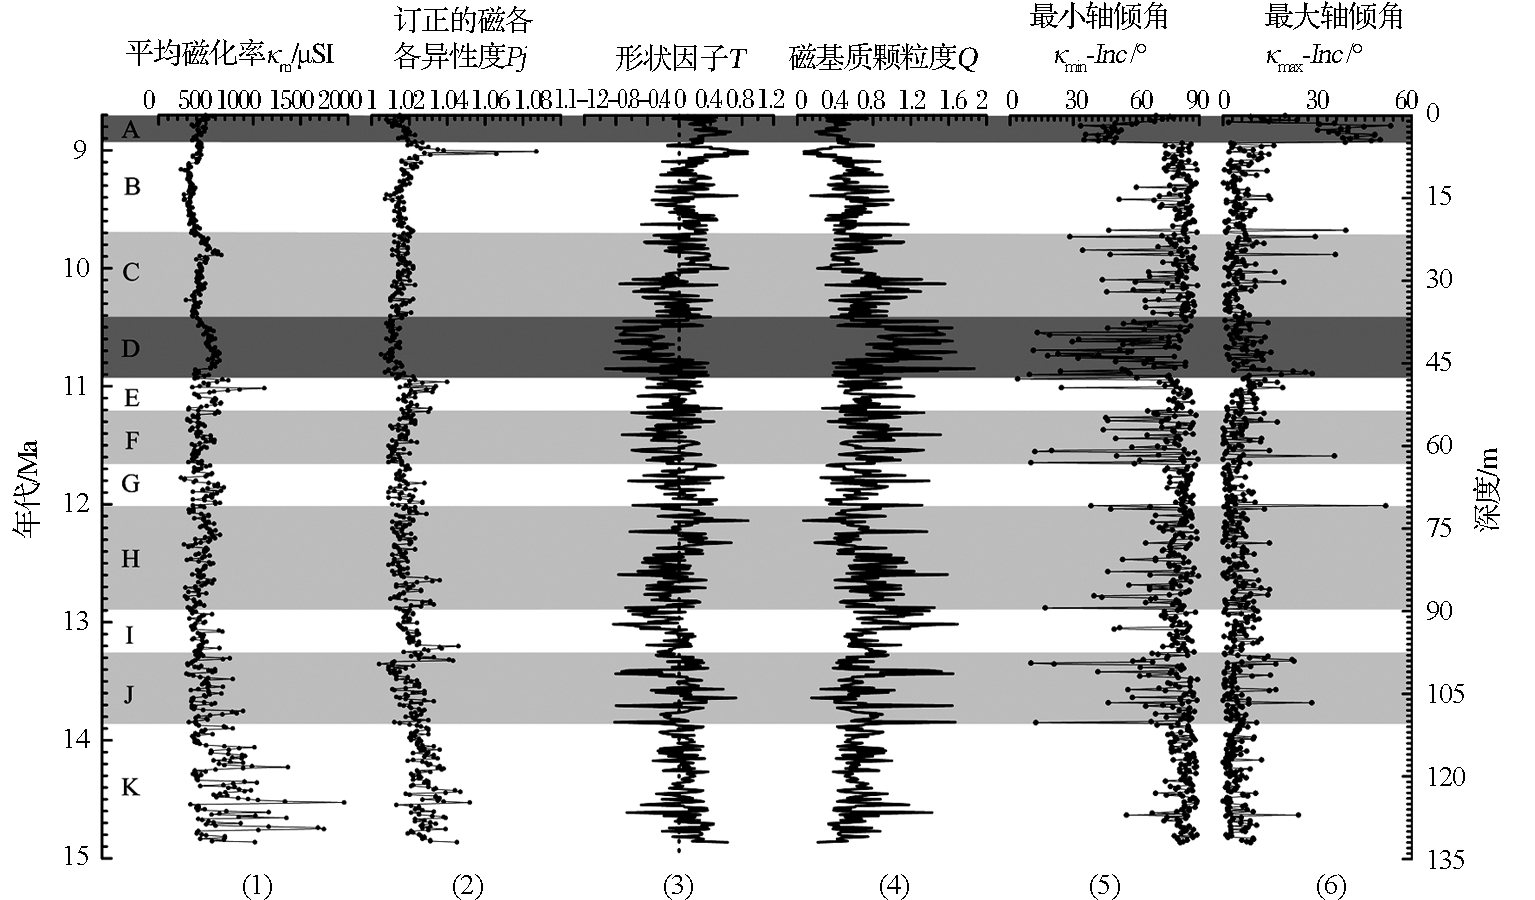
图7 水洛红黏土剖面AMS κm, Pj, T, Q, κmin- Inc, κmax- Inc随深度变化图Fig.7 Mean magnetic susceptibility( κm), corrected AMS degree( Pj), AMS shape parameter( T) and the inclinations of the maximum( κmax) and minimum( κmin) principle axes of the AMS ellipsoids from Shuiluo red clay all shown as a function of height

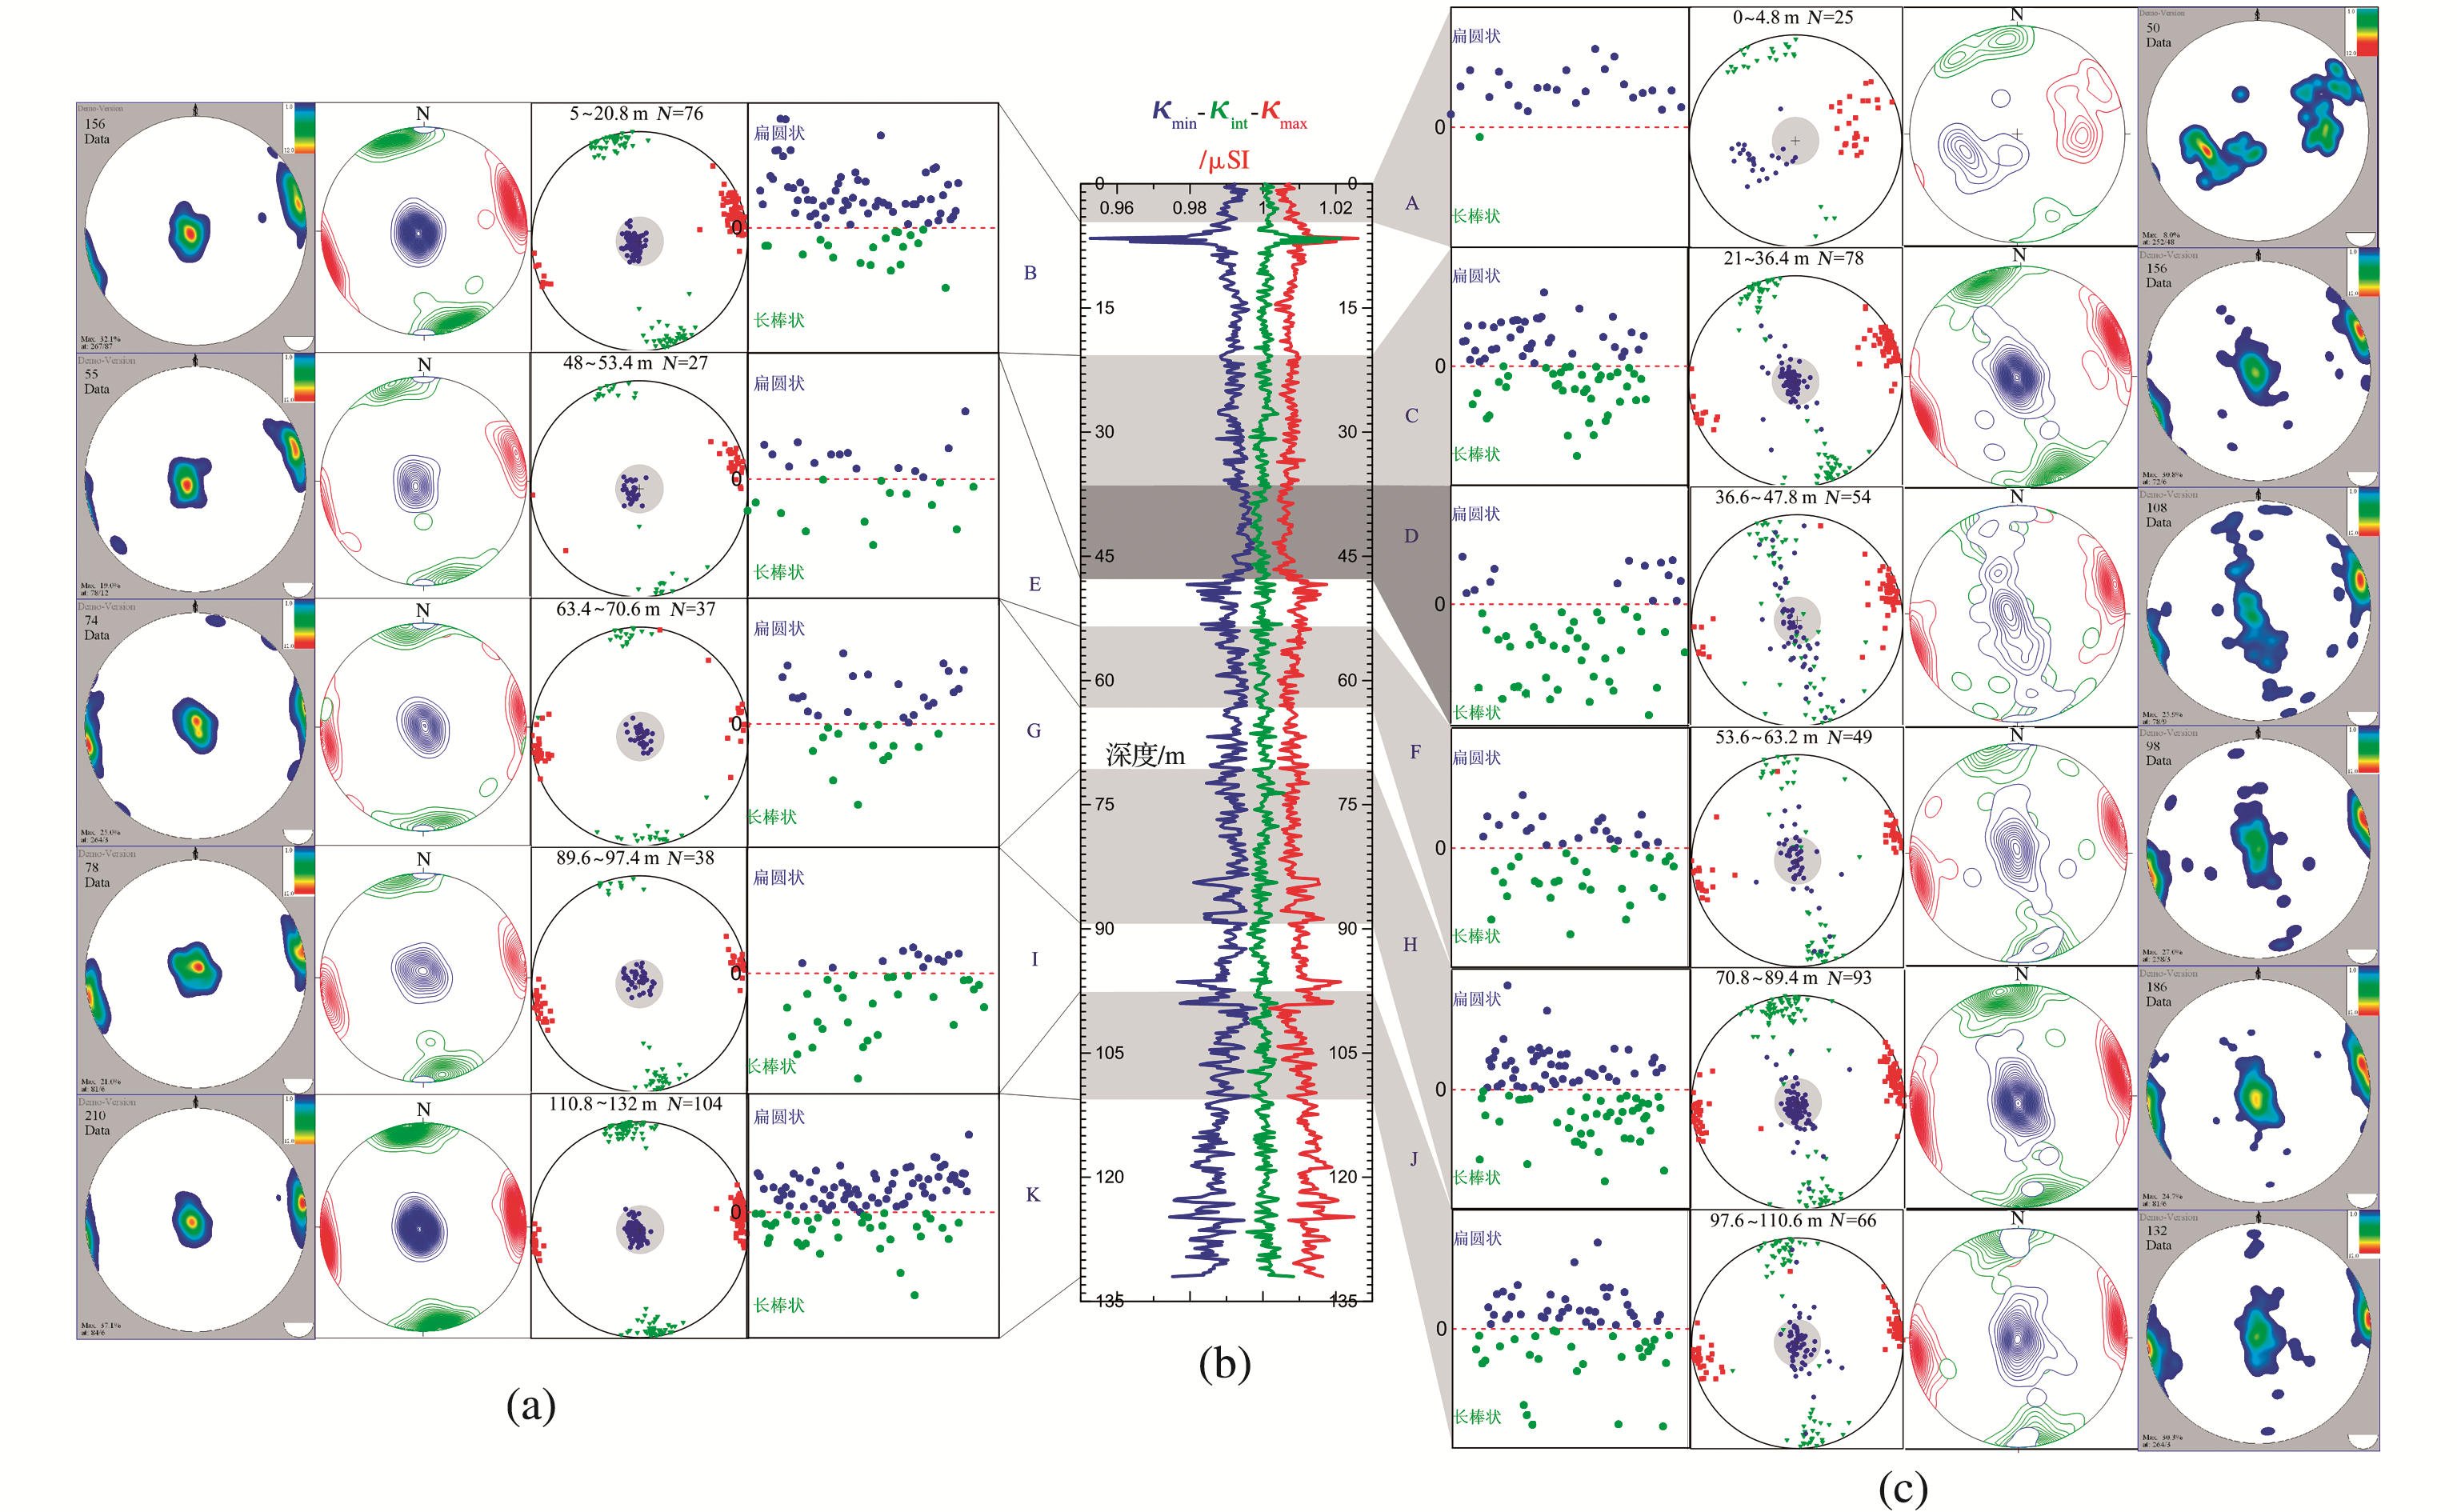
图8 应力作用随深度变化图(a)最小轴处于垂直位置的层段;(b)三轴磁化率随深度的变化趋势,不同的层段所对应的赤平投影图,图中红色小正方形指示最大轴、蓝色小圆点指示最小轴、绿色小三角指示中间轴,图中灰色区域指示的为理论上的垂直位置( κmin- Inc>70°);轮廓线图,红线表示最大轴的轮廓、蓝线表示最小轴的轮廓、绿线表示中间轴的轮廓;趋势图,图中红色区域指示的为最大轴和最小轴相对集中的位置,绿色到蓝色的过渡指示的是最大轴和中间轴的展布方向; T Pj的相关关系图,图中蓝色小圆点表示的是扁圆状( T>0)的椭球体形状,绿色小圆点表示的为长棒状( T<0)的椭球体形状;(c)最小轴偏离中心位置的层段Fig.8 The stress variation with depth of Shuiluo red clay profile(a) The sections with the minimum principle axes( κmin) perpendicular to the center position;(b)The three principle axes as a function of height, stereographic projection diagrams of different sections, the red squares, blue circles and green triangles represent κmax, κint, κmin, respectively, the gray circles marks the samples with κmin- Inc>70°;contours diagram of κmax(red line), κint(green line), κmin(blue line);tendency diagram of κmaxand κmin, the red area represent the centralized locations of κmax and κmin, the transition from green to blue indicates the distribution direction of κmax and κmin; Pj-T(corrected AMS degree versus AMS shape parameter) diagram;(c)The sections with the minimum principle axes( κmin) deviation from the center position

97.6~110.6 m(层段J),70.8~89.4 m(层段H),53.6~63.2 m(层段F)这3个层段赤平投影图(图8c)中虽然有绝大多数数据点都处于 κmin- Inc>70°,但是也有少量数据点偏离了层面中心位置,对应于 T值(图7)在正(Oblate)负(Prolate)之间的大幅度波动,显示出相对于K,I,G,E 4个层段较强的应力作用,三轴磁化率(图8b)也显示出,椭球体形状具有从三维状( κmax> κint> κmin)到长棒状( κmax> κint κmin)的发展趋势。轮廓线图(图8c)和趋势图(图8c)反映出,这3个层段最大轴呈簇状近东西向分布,最小轴沿近南北向展布的特点,表明这些层段可能受到近南北向的应力作用,而且磁各向异性度 Pj值也有相对减弱的趋势(图7),应该是由应力作用使磁基质颗粒的定向排列程度减弱导致的。

36.6~47.8 m(层段D)为整个剖面上最具特征的层段,赤平投影图(图8c)显示,绝大多数最小轴投影在偏离层面中心的位置,轮廓线图(图8c)和趋势图(图8c)显示出最小轴呈带状沿近南北向展布,最大轴呈簇状分布于近东西两侧,三轴磁化率(图8b)和 T值(图7,8c)反映出椭球体为长棒状( κmax> κint κmin, T<0)的特点。综合信息指出,该层段为受应力作用最强的层段。

21.0~36.4 m(层段C),为继D层段之后连续的一个层段,相应AMS信息反映出其受应力作用强度较D层段有所减小(图8c)。

5.0~20.8 m(层段B)具有和K,I,G,E 4层段相似的AMS特征(图8a),然而 T值(图7,8a)和三轴磁化率值(图8b)都显示磁椭球体有向扁圆状( T>0, κmax κint> κmin)发展的趋势,反映出该层段应力不断减弱的特征,对应 Pj值也有逐渐增大的趋势(图7)。

0~4.8 m(层段A)也是一个很有特点的层段,对应的 κmax- Inc κmin - Inc(图7)显示出很大的偏离,赤平投影图、轮廓线图和趋势图(图8c)也很直观地反映了这一特点,指示这一层段可能经受了较强的扰动作用,而其所对应的 T值和三轴磁化率值却显示出扁圆状的磁椭球体特征( T>0, κmax κint> κmin)(图7,8c),指示原始沉积的特点。

7 讨论

随着第四纪黄土—古土壤下伏第三纪红黏土序列底界年龄的不断更新[ 18, 19],及多种指示风成成因证据的不断提出[ 42~ 45],红黏土的风成成因已经被广泛接受和认可。水洛红黏土显示出与典型红黏土相似的成因特征,主要表现在以下几个方面:首先,上百米的剖面在野外可清晰辨别出数十层发育较好、具有典型成壤特征的黄土层和古土壤层[ 19],但未发现水平层理或流水改造痕迹,从而排除了水成及坡积的可能性;其次,水洛剖面粒度数据(未发表)显示,132 m沉积序列以细粉砂为主,粗颗粒(>63 μm)成分含量较少,中值粒径变化介于4~16 μm之间[ 46, 47];最后,水洛红黏土磁化率特征和庄浪钻孔[ 18]及秦安剖面[ 19]磁化率特征具有很好的空间对比性(图5),也是风成沉积所独有的特征。根据上述野外及实验证据,可以确定水洛红黏土的风成成因,从而排除了其他因素对磁化率各向异性的干扰。

水洛红黏土序列在不同层段,各向异性椭球体最大轴都存在近东西向成簇状的集中,最小轴也有近南北向呈带状延展的特点(图6a,8), T Pj显示磁椭球体向长棒状发展(图6b),Flinn图显示大量长棒状的磁椭球体等特征(图6c),都表明水洛风成红黏土AMS指示的并不是原始风动力方向的信息,而是应力作用的结果,应力作用方向为近南北向,对应于应力作用强度较弱的初期和应力作用强度稍微增强的中期AMS所应有的特征[ 10, 13, 14],但是,后期应力作用强度又不足以造成在早期沉积层段上的构造叠加。进一步细致的划分和对比(图8)发现,不同深度上不同层段AMS信息也不尽相同,具有随着深度变化而不断变化的特点,所以,水洛风成红黏土序列磁化率各向异性特征记录的应该为同沉积时期的应力作用事件,而非沉积序列沉积后期应力叠加的结果。

132.0~47.8 m(14.8~11.0 Ma)之间(层段K—层段E,图8)明显反映了3次应力相对集中与后期应力减弱交替发展,呈现出脉冲式分阶段的应力作用特征,磁椭球体的变化(图8b)也是从三维状(应力较弱,层段K,层段I,层段G,层段E)到长棒状(应力增强,层段J,层段H,层段F)之间交替变化。47.8~5.0 m(11.0~8.9 Ma)之间(层段D—层段B,图8)AMS特征明显反映了一次应力急剧增强(层段D)和后续应力逐渐减弱(层段C—层段B)的过程,磁椭球体形状也是从完全的长棒状(应力急剧增强,层段D)到三维状(应力减小,层段C)再到扁圆状(应力再次减小—原始沉积未受扰动,层段B)的渐变发展过程。4.8~0 m(8.9~8.7 Ma)(层段A,图8)之间红黏土AMS也反映了较强的扰动作用,但是引起磁椭球体位置翻转的同时并没有使磁椭球体形状发生任何改变,磁椭球体仍然保持了原始沉积的扁圆状特征,结合该层段(层段A)所处的剖面顶部位置,推测该部分扰动可能是区域风化、坡积、生物作用或人为扰动的结果,并不是一次真正的应力作用事件。

将剖面上132.0~47.8 m(14.8~11.0 Ma)之间应力相对增强与减弱的交替发展,和47.8~5.0 m(11.0~8.9 Ma)之间应力急剧增强及之后应力逐渐减弱,与青藏高原东北缘及六盘山附近的区域构造活动相联系,结合各层段对应的年代(图7),推断水洛剖面AMS记录的132.0~47.8 m(14.8~11.0 Ma)之间的应力作用,可能对应区域背景上青藏高原东北缘在14.8~11.0 Ma之间强烈构造活动的区域应力传递对该地区的影响,如青藏高原地区在该阶段岩石圈减薄[ 48]和青藏高原东北缘的隆升事件[ 49],以及由此引发海源六盘山断裂的左行走滑和海源地区附近断裂的走滑活动事件[ 50, 51];临夏盆地沉积物记录的14 Ma左右青藏高原东北缘的活动过程[ 52];贵德盆地在17~11 Ma的构造旋转[ 20];西宁盆地指示的青藏高原东北缘在14 Ma左右的阶段性抬升[ 53]

47.8~5.0 m(11.0~8.9 Ma)之间应力急剧增强到应力逐渐减弱过程,应该对应于局部地区11.0~8.9 Ma左右的应力增强事件及后续应力的减弱过程,如10~7 Ma时期阿尔金山、祁连山和六盘山[ 54~ 56]等均发生了明显的隆升事件;海源断裂在10 Ma以来的走滑活动[ 57],由于局部地区近距离的应力作用对水洛地区的强烈影响,所以在磁化率各向异性上也表现出强烈受应力作用的特征。

8 结论

通过对水洛风成红黏土进行系统的岩石磁学、磁性地层学和磁化率各向异性研究,可以得到以下认识:

(1) 以往认为的原始风成沉积物也可能经历了同沉积时期不同程度的应力作用事件,尽管有些应力作用事件是野外或使用其他常规手段无法识别的,磁化率各向异性可以揭示沉积物可能经历的微弱区域背景下的应力作用过程。

(2) 水洛风成红黏土记录的14.8~8.7 Ma沉积序列均受到了同沉积时期不同程度的应力作用,磁化率各向异性表现出的应力作用阶段为应力作用强度较弱的初期和应力作用强度有所加强的中期,但是,后期应力作用强度又不足以造成在早期沉积层段上的构造叠加。

(3) 磁化率各向异性揭示出水洛红黏土剖面14.8~11.0 Ma之间的应力作用过程具有3次应力相对集中与应力减弱相互交替的变化特点,为青藏高原东北缘强烈构造活动引发的应力传递对该地区应力作用的响应,11.0~8.7 Ma之间存在一次较强的应力作用事件,接着为一个应力不断减弱的过程,为局部地区应力集中对水洛地区的影响。

The authors have declared that no competing interests exist.

参考文献
[1] Hus J J. The magnetic fabric of some loess/palaeosol deposits[J]. Physics and Chemistry of the Earth, Parts A/B/C, 2003, 28(16/19): 689-699. [本文引用:1]
[2] Lagroix F, Banerjee S K. Palaeowind directions from the magnetic fabric of loess profiles in central Alaska[J]. Earth and Planetary Science Letters, 2002, 195(1): 99-112. [本文引用:3] [JCR: 4.349]
[3] Zhu R X, Liu Q S, Jackson M J, et al. Palaeoenvironmental significance of the magnetic fabrics in Chinese Loess-Palaeosols since the last interglacial(<130 ka)[J]. Earth and Planetary Science Letters, 2004, 221(1): 55-69. [本文引用:3] [JCR: 4.349]
[4] Zhang R, Kravchinsky V A, Zhu R X, et al. Palaeomonsoon route reconstruction along a W-E transect in the Chinese Loess Plateau using the anisotropy of magnetic susceptibility: Summer monsoon model[J]. Earth and Planetary Science Letters, 2010, 299(3): 436-446. [本文引用:3] [JCR: 4.349]
[5] Zhang Rui, Yue Leping, Gong Hujun, et al. Anisotropy of magnetic susceptibility of eolian sediments in the Chinese Loess Plateau[J]. Quaternary Sciences, 2012, 32(4): 719-726.
[张睿, 岳乐平, 弓虎军, . 黄土高原风成沉积物磁化率各向异性研究[J]. 第四纪研究, 2012, 32(4): 719-726. ] [本文引用:1] [CJCR: 1.911]
[6] Wang Luo, Liu Dongsheng, Han Jiamao, et al. Environmental magnetism of Chinese Quarternary Loess: A brief review[J]. Advances in Earth Sciences, 2000, 15(3): 335-341.
[旺罗, 刘东升, 韩家懋, . 中国第四纪黄土环境磁学研究进展[J]. 地球科学进展, 2000, 15(3): 335-341. ] [本文引用:2] [CJCR: 1.388]
[7] Liu B Z, Saito Y, Yamazaki T, et al. Palaeocurrent analysis for the Late Pleistocene—Holocene incised-valley fill of the Yangtze delta, China by using anisotropy of magnetic susceptibility data[J]. Marine Geology, 2001, 176(1): 175-189. [本文引用:1] [JCR: 2.732]
[8] Piazolo S, Passchier C W. Controls on lineation development in low to medium grade shear zones: A study from the Cap de Creus peninsula, NE Spain[J]. Journal of Structural Geology, 2002, 24(1): 25-44. [本文引用:1] [JCR: 2.285]
[9] Parés J M, Ben A, vand er Pluijm. Evaluating magnetic lineations(AMS) in deformed rocks[J]. Tectonophysics, 2002, 350(4): 283-298. [本文引用:2] [JCR: 2.684]
[10] Parés J M. How deformed are weakly deformed mudrocks? Insights from magnetic anisotropy[J]. Geological Society, London, Special Publications, 2004, 238(1): 191-203. [本文引用:6]
[11] Lagroix F, Banerjee S K. Cryptic post-depositional reworking in aeolian sediments revealed by the anisotropy of magnetic susceptibility[J]. Earth and Planetary Science Letters, 2004, 224(3): 453-459. [本文引用:2] [JCR: 4.349]
[12] Charreau J, Chen Y, Gilder S, et al. Neogene uplift of the Tian Shan Mountains observed in the magnetic record of the Jingou River section(northwest China)[J]. Tectonics, 2009, 28(2): TC2008, doi: 10.1029/2007TC002137. [本文引用:3] [JCR: 3.487]
[13] Huang B C, Piper J D A, Peng S D, et al. Magnetostratigraphic study of the Kuche Depression, Tarim Basin, and Cenozoic uplift of the Tian Shan range, western China[J]. Earth and Planetary Science Letters, 2006, 251(3): 346-364. [本文引用:4] [JCR: 4.349]
[14] Tang Z H, Huang B C, Dong X X, et al. Anisotropy of magnetic susceptibility of the Jingou River section: Implications for late Cenozoic uplift of the Tian Shan[J]. Geochemistry Geophysics Geosystems, 2012, 13: Q03022, doi: 10.1029/2011GC003966. [本文引用:4] [JCR: 2.939]
[15] Burmeister K C, Harrison M J, Marshak S, et al. Comparison of fry strain ellipse and AMS ellipsoid trends to tectonic fabric trends in very low-strain sand stone of the appalachian fold-trust belt[J]. Journal of Structural Geology, 2009, 31: 1028-1 038. [本文引用:1] [JCR: 2.285]
[16] Cifelli F, Mattei M, Hirt A M, et al. The origin of tectonic fabric in“undeformed” clays: The early stages of deformation in extensional sedimentary basins[J]. Geophysical Research Letters, 2004, 31: L09604, doi: 10.1029/2004GL019609. [本文引用:1] [JCR: 3.982]
[17] Kligfield R, Lowrie W, Hirt A, et al. Effect of progressive deformation on remanent magnetization of permian redbeds from the alpes maritimes[J]. Tectonophysics, 1983, 98: 59-85. [本文引用:1] [JCR: 2.684]
[18] Qiang X K, An Z S, Song Y G, et al. New eolian red clay sequence on the western Chinese Loess Plateau linked to onset of Asian desertification about 25 Ma ago[J]. Science in China(Series D), 2011, 54(1): 136-144. [本文引用:6]
[19] Guo Z T, Rudddiman W F, Hao Q Z, et al. Onset of Asian desertification by 22 Myr ago inferred from loess deposits in China[J]. Nature, 2002, 416(6 877): 159-163. [本文引用:4] [JCR: 38.597]
[20] Yan M D, Vand erVoo R, Fang X M, et al. Palaeomagnetic evidence for a mid-Miocene clockwise rotation of about 25 of the Guide Basin area in NE Tibet[J]. Earth and Planetary Science Letters, 2006, 241(1): 234-247. [本文引用:2] [JCR: 4.349]
[21] Liu Bing, Jin Heling, Sun Zhong, et al. Geochemical characteristics of aerolian deposits in Gonghe Basin, northeastern Qinghai-Tibetan Plateau and the indicating climatic changes[J]. Advances in Earth Science, 2012, 27(7): 788-799.
[刘冰, 靳鹤龄, 孙忠, . 青藏高原东北部共和盆地风成沉积地球化学特征及其揭示的气候变化[J]. 地球科学进展, 2012, 27(7): 788-799. ] [本文引用:1] [CJCR: 1.388]
[22] Jelinek V. Characterization of the magnetic fabric of rocks[J]. Tectonophysics, 1981, 79(3): T63-T67. [本文引用:1] [JCR: 2.684]
[23] Ao H, Dekkers M J, Deng C L, et al. Palaeoclimatic significance of the Xiantai fluvio-lacustrine sequence in the Nihewan Basin(North China), based on rock magnetic properties and clay mineralogy[J]. Geophysical Journal International, 2009, 177(3): 913-924. [本文引用:1] [JCR: 2.853]
[24] Kirschvink J. The least-squares line and plane and the analysis of palaeomagnetic data[J]. Geophysical Journal International, 1980, 62(3): 699-718. [本文引用:1] [JCR: 2.853]
[25] Guo Z T, Peng S Z, Hao Q Z, et al. Origin of the Miocene-Pliocene red-earth formation at Xifeng in Northern China and implications for palaeoenvironments[J]. Palaeogeography, Palaeoclimatology, Palaeoecology, 2001, 170(1): 11-26. [本文引用:1] [JCR: 2.745]
[26] Guo Z T, Sun B, Zhang Z S, et al. A major reorganization of Asian climate by the early Miocene[J]. Climate of the Past, 2008, 4(3): 153-174. [本文引用:1] [JCR: 3.556]
[27] Hao Q Z, Guo Z T. Magnetostratigraphy of an early-middle Miocene loess-soil sequence in the western Loess Plateau of China[J]. Geophysical Research Letters, 2007, 34(18): L18305, doi: 10.1029/2007G2031162. [本文引用:1] [JCR: 3.982]
[28] Liu Jinfeng, Guo Zhengtang, Hao Qingzhen, et al. Magnetostratigraphy of he Miziwan Miocene eolian deposits in Qin’an county(Gansu Province)[J]. Quaternary Sciences, 2005, 25(4): 503-509.
[刘进峰, 郭正堂, 郝青振, . 甘肃秦安糜子湾剖面中新世风尘堆积的磁性地层学研究[J]. 第四纪研究, 2005, 25(4): 503-509. ] [本文引用:1] [CJCR: 1.911]
[29] Zachos J. Trends, rhythms, and aberrations in global climate 65 Ma to present[J]. Science, 2001, 292(5 517): 686-693. [本文引用:1]
[30] Flower B P, Kennett J P. The middle Miocene climatic transition: East Antarctic ice sheet development, deep ocean circulation and global carbon cycling[J]. Palaeogeography, Palaeoclimatology, Palaeoecology, 1994, 108(3): 537-555. [本文引用:1] [JCR: 2.745]
[31] Li Chaozhu, Zhang Xiao, Xu Yuanbin, et al. Reviews on the reconstructed C3/C4 variations since the late Miocene in the Chinese Loess Plateau[J]. Advances in Earth Science, 2012, 27(3): 284-291.
[李朝柱, 张晓, 许元斌, . 黄土高原地区晚中新世以来陆地植被C3/C4 植物相对丰度演化研究进展[J]. 地球科学进展, 2012, 27(3): 284-291. ] [本文引用:1] [CJCR: 1.388]
[32] Kukla G, An Z S. Pleistocene climates in China dated by magnetic susceptibility[J]. Geology, 1988, 16(9): 811-814. [本文引用:1] [JCR: 4.087]
[33] An Z S, Wang S M, Wu X H, et al. Eolian evidence from the Chinese Loess Plateau: The onset of the late Cenozoic Great Glaciation in the Northern Hemisphere and Qinghai-Xizang Plateau uplift forcing[J]. Science in China(Series D), 1999, 42(3): 258-271. [本文引用:1]
[34] Ding Z L, Xiong S F, Sun J M, et al. Pedostratigraphy and palaeomagnetism of a~7. 0 Ma eolian loess-red clay sequence at Lingtai, Loess Plateau, north-central China and the implications for palaeomonsoon evolution[J]. Palaeogeography, Palaeoclimatology, Palaeoecology, 1999, 152(1): 49-66. [本文引用:1] [JCR: 2.745]
[35] An Z S. The history and variability of the East Asian palaeomonsoon climate[J]. Quaternary Science Reviews, 2000, 19(1): 171-187. [本文引用:1] [JCR: 4.076]
[36] Cand e S C, Kent D V. Revised calibration of the geomagnetic polarity timescale for the late Cretaceous and Cenozoic[J]. Journal of Geophys Research, 1995, 100: 6 093-6 095. [本文引用:1] [JCR: 3.174]
[37] Liu X M, Xu T C, Liu T S. The Chinese loess in Xifeng, II. A study of anisotropy of magnetic susceptibility of loess from Xifeng[J]. Geophysical Journal, 1988, 92(2): 349-353. [本文引用:1]
[38] Lagroix F, Banerjee S K. The regional and temporal significance of primary aeolian magnetic fabrics preserved in Alaskan Loess[J]. Earth and Planetary Science Letters, 2004, 225(3): 379-395. [本文引用:2] [JCR: 4.349]
[39] Borradaile G, Henry B. Tectonic applications of magnetic susceptibility and its anisotropy[J]. Earth Science Reviews, 1997, 42(1): 49-93. [本文引用:1] [JCR: 7.339]
[40] Kanamatsu T, Herroro-Bervara E, Taira A. Magnetic fabric development in the Tertiary Accretionary complex in the Boso and Miura Peninsulas of central Japan[J]. Geophysical Research Letters, 1996, 23(5): 471-474. [本文引用:3] [JCR: 3.982]
[41] Larrasoana J C, Pueyo E L, Parés J M. An integrated AMS, structural, palaeo-and rock-magnetic study of Eocene marine marls from the Jaca-Pamplona basin(Pyrenees, N Spain); New insights into the timing of magnetic fabric acquisition in weakly deformed mudrocks[J]. Geological Society London Special Publications, 2004, 238: 127-143. [本文引用:3]
[42] Ding Z L, Sun J M, Liu T S, et al. Wind-blown origin of the Pliocene red clay formation in the central Loess Plateau, China[J]. Earth and Planetary Science Letters, 1998, 161(1): 135-143. [本文引用:1] [JCR: 4.349]
[43] Lu H Y, Vand enberghe J, An Z S. Aeolian origin and palaeoclimatic implications of the ‘red clay’(north China) as evidenced by grain-size distribution[J]. Journal of Quaternary Science, 2001, 16(1): 89-97. [本文引用:1] [JCR: 2.939]
[44] Yang S L, Ding Z L. Comparison of particle size characteristics of the Tertiary ‘red clay’and Pleistocene loess in the Chinese Loess Plateau: Implications for origin and sources of the ‘red clay’[J]. Sedimentology, 2004, 51(1): 77-93. [本文引用:1] [JCR: 2.611]
[45] Li F J, Wu N Q, Pei Y P, et al. Wind-blown origin of Dongwan late Miocene-Pliocene dust sequence documented by land snail record in western Chinese Loess Plateau[J]. Geology, 2006, 34(5): 405-408. [本文引用:1] [JCR: 4.087]
[46] Qiao Yansong, Guo Zhengtang, Hao Qingzhen, et al. Grain-size features of a Miocene loess-soil sequence at Qin’an: Implications on its origin[J]. Science in China(Series D), 2006, 49(7): 731-738.
[乔彦松, 郭正堂, 郝青振, . 中新世黄土—古土壤序列的粒度特征及其对成因的指示意义[J]. 中国科学: D 辑, 2006, 36(7): 646-653. ] [本文引用:1]
[47] Liu Jinfeng, Guo Zhengtang, Qiao Yansong, et al. Eolian origin of the Miocene loess-soil sequence at Qin’an, China: Evidence of quartz morphologh and quartz grain size[J]. Chinese Sicence Bulletin, 2006, 51(1): 117-120.
[刘进峰, 郭正堂, 乔彦松, . 秦安中新世黄土—古土壤序列石英颗粒形态特征、粒度分布及其对成因的指示意义[J]. 科学通报, 2005, 50(24): 2 806-2 809. ] [本文引用:1]
[48] Wang E. Displacement and timing along the northern strand of the Altyn Tagh fault zone, northern Tibet[J]. Earth and Planetary Science Letters, 1997, 150(1): 55-64. [本文引用:1] [JCR: 4.349]
[49] Sun J M, Zhu R X, An Z S. Tectonic uplift in the northern Tibetan Plateau since 13. 7 Ma ago inferred from molasse deposits along the Altyn Tagh Fault[J]. Earth and Planetary Science Letters, 2005, 235(3/4): 641-653. [本文引用:1] [JCR: 4.349]
[50] Burchfiel B C, Zhang P Z, Wang Y P, et al. Geology of the Haiyuan fault zone, Ningxia-Hui Autonomous Region, China, and its relation to the evolution of the northeastern margin of the Tibetan Plateau[J]. Tectonics, 1991, 10(6): 1 091-1 110. [本文引用:1] [JCR: 3.487]
[51] Meyer B, Tapponnier P, Bourjot L, et al. Crustal thickening in Gansu-Qinghai, lithospheric mantle subduction, and oblique, strike-slip controlled growth of the Tibet Plateau[J]. Geophysical Journal International, 1998, 135(1): 1-47. [本文引用:1] [JCR: 2.853]
[52] Zheng Dewen, Zhang Peizhen, Wan Jinglin, et al. The late-cenozoic tectonic distortion of the north-west margin of Tibetan Plateau—The record of detrital apatite fission track dating in Linxia Basin[J]. Science in China(Series D), 2003, 33(Suppl. 1): 190-198.
[郑德文, 张培震, 万景林, . 青藏高原东北边缘晚新生代构造变形的时序——临夏盆地碎屑颗粒磷灰石裂变径迹记录[J]. 中国科学: D辑, 2003, 33(增刊1): 190-198. ] [本文引用:1]
[53] Lu Huayu, An Zhisheng, Wang Xiaoyong, et al. Geomorphologic evidence of phased uplift of the northeastern Qinghai-Tibet Plateau since 14 million years[J]. Science in China(Series D), 2004, 47(9): 822-833.
[鹿化煜, 安芷生, 王晓勇, . 最近14 Ma青藏高原东北缘阶段性隆升的地貌证据[J]. 中国科学: D辑, 2004, 34(9): 822-833. ] [本文引用:1]
[54] Jolivet M, Roger F, Arnaud N, et al. Exhumation history of the Altun Shan with evidence for the timing of the subduction of the Tarim block beneath the Altyn Tagh system, North Tibet Comptes Rendus de l’Academie des Sciences Series IIA[J]. Earth and Planetary Science Letters, 1999, 329(10): 749-755. [本文引用:1] [JCR: 4.349]
[55] Zheng H B, Powell C M, An Z S. Pliocene uplift of the northern Tibetan Plateau[J]. Geology, 2000, 28(8): 715-718. [本文引用:1] [JCR: 4.087]
[56] Zheng D W, Zhang P Z, Wan J L, et al. Rapid exhumation at~8 Ma on the Liupan Shan thrust fault from apatite fission-track thermochronology: Implications for growth of the northeastern Tibetan Plateau margin[J]. Earth and Planetary Science Letters, 2006, 248(1): 198-208. [本文引用:1] [JCR: 4.349]
[57] Tian Qinjian, Ding Guoyu, Shen Xuhui. Pull-apart basins and total lateral displacement along the Haiyuan fault zone in cenozoic[J]. Earthquake Research in China, 2001, 17(2): 167-175.
[田勤俭, 丁国瑜, 申旭辉. 拉分盆地与海原断裂带新生代水平位移规模[J]. 中国地震, 2001, 17(2): 167-175. ] [本文引用:1] [CJCR: 0.657]