风成红黏土序列磁化率各向异性特征对区域应力变化的响应
 , 强小科
, 强小科Anisotropy of Magnetic Susceptibility Response to the Regional Stress Variation in Aeolian Red Clay Sequence
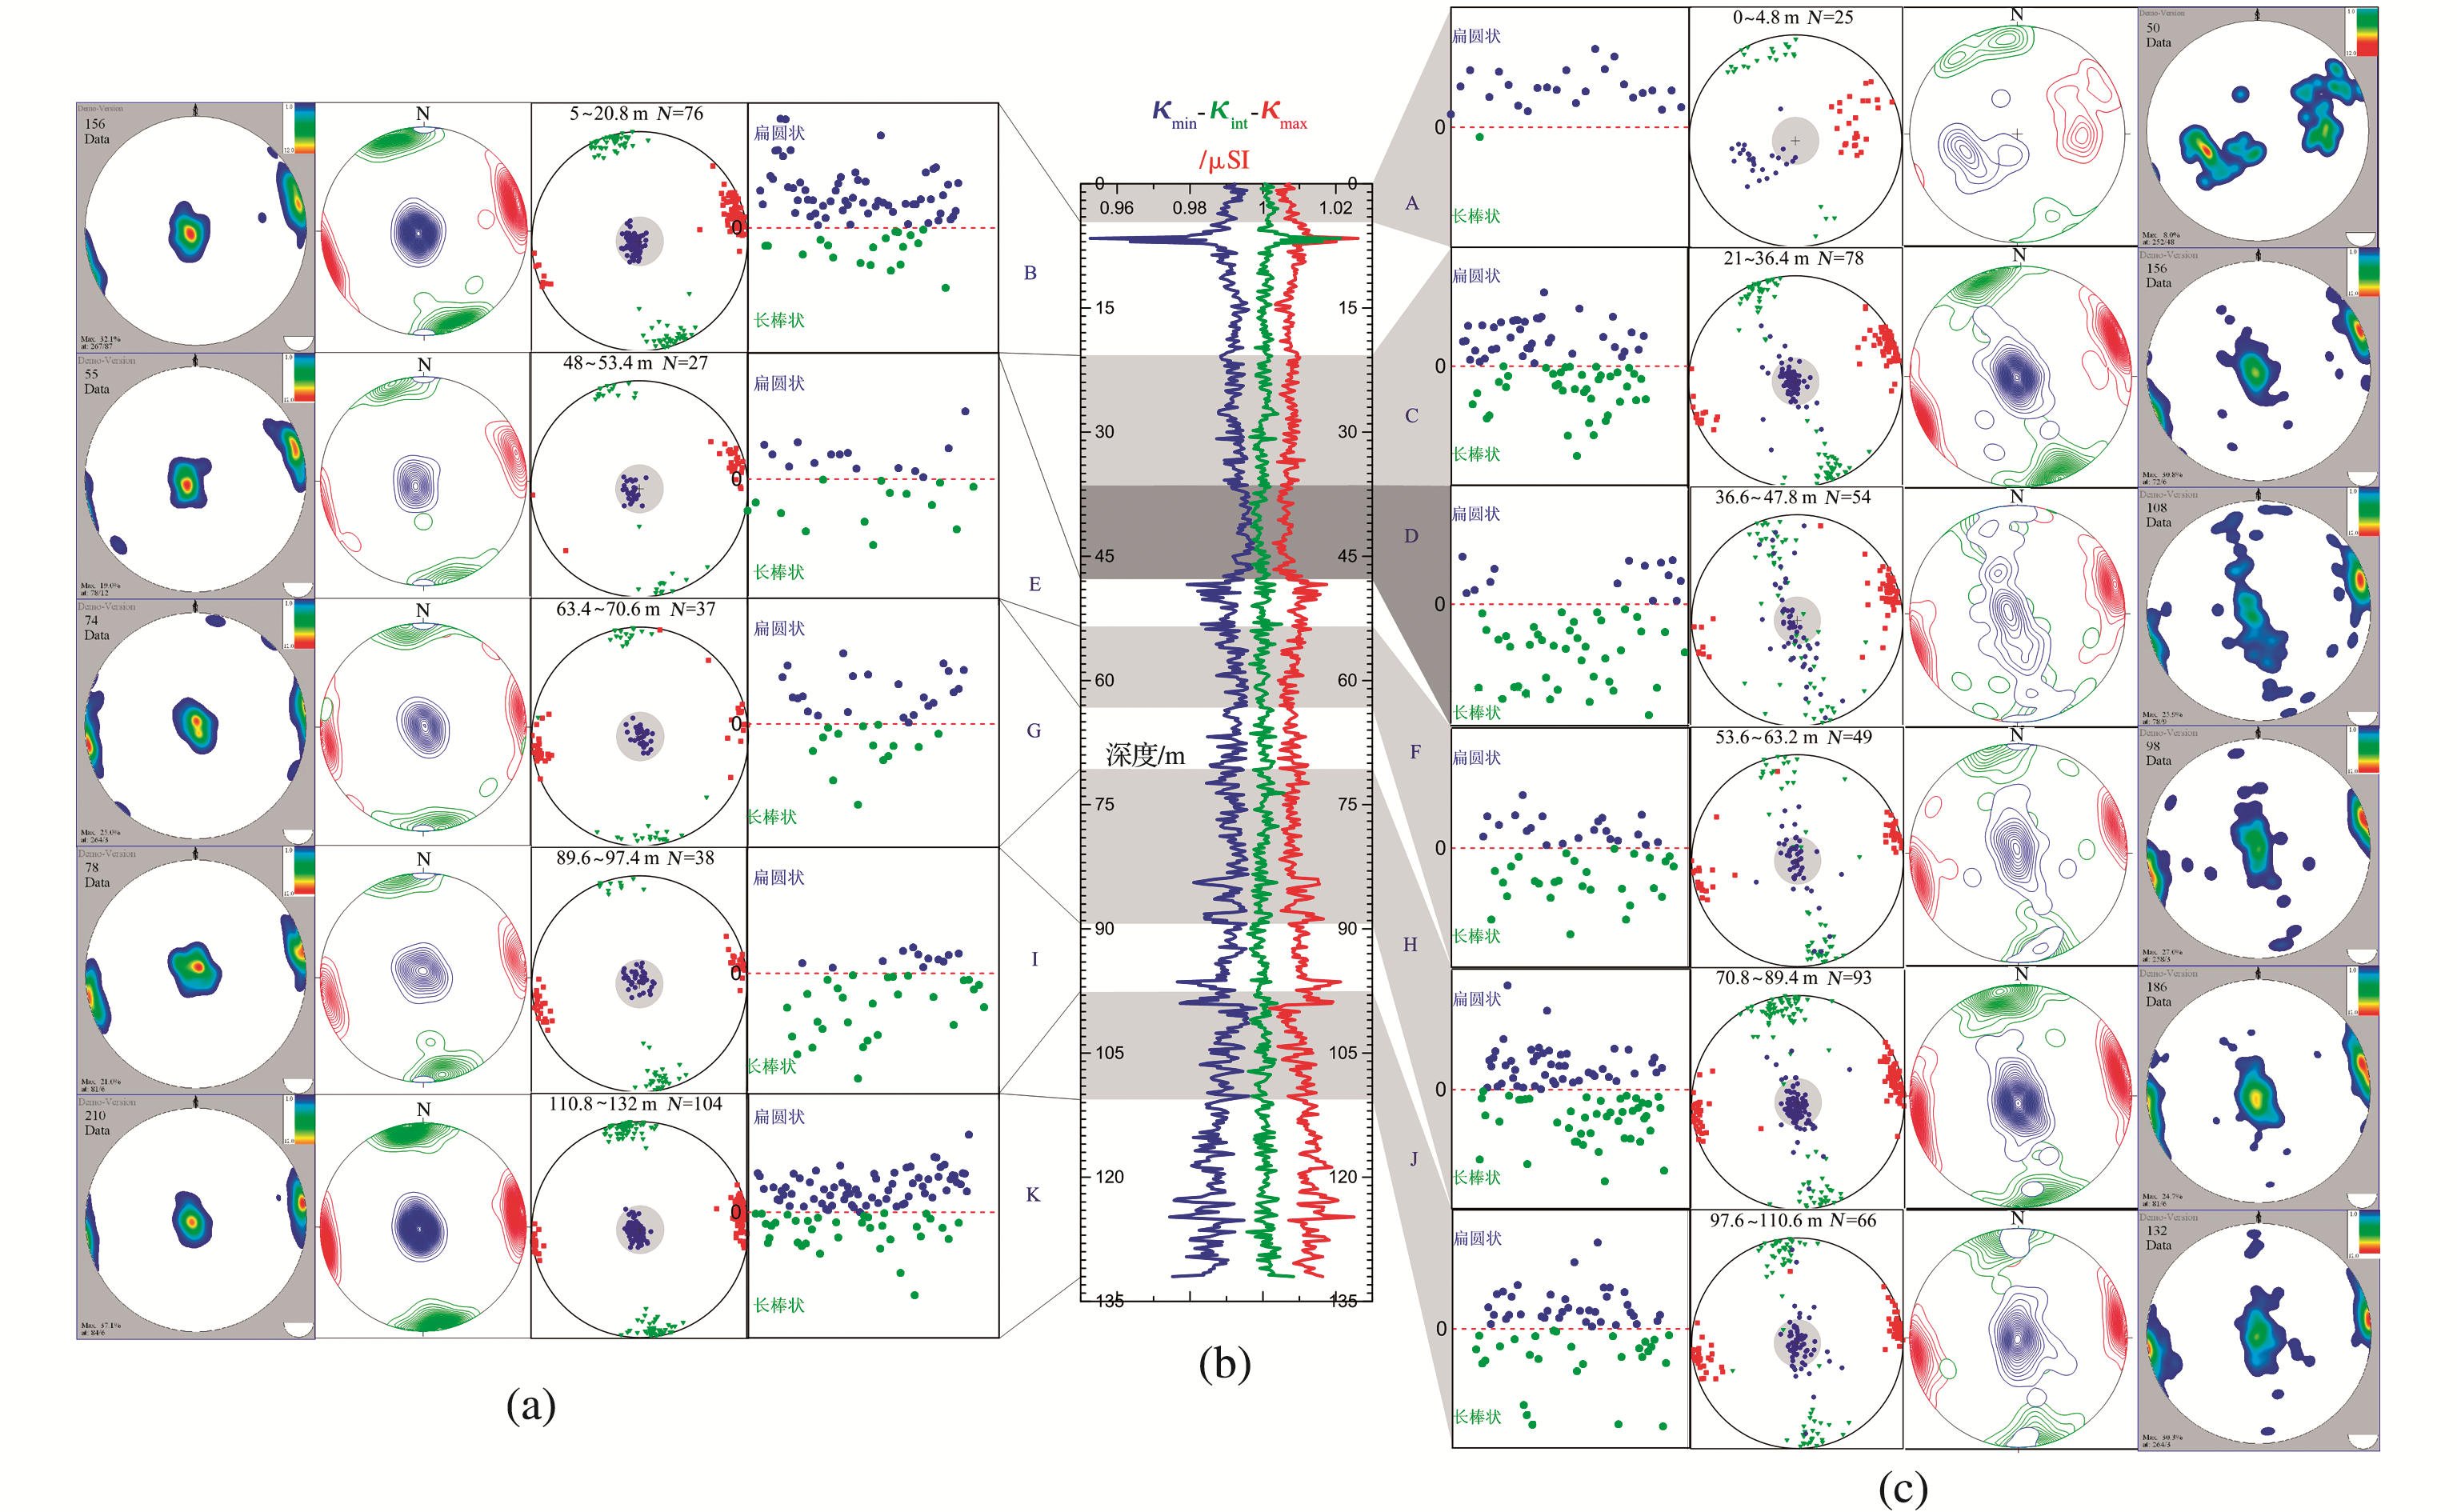
Fig.8 The stress variation with depth of Shuiluo red clay profile a The sections with the minimum principle axes #cod#x003ba; min perpendicular to the center position; bThe three principle axes as a function of height, stereographic projection diagrams of different sections, the red squares, blue circles and green triangles represent #cod#x003ba; max , #cod#x003ba; int , #cod#x003ba; min , respectively, the gray circles marks the samples with #cod#x003ba; min - Inc 70#cod#x000b0;;contours diagram of #cod#x003ba; max red line, #cod#x003ba; int green line, #cod#x003ba; min blue line;tendency diagram of #cod#x003ba; max and #cod#x003ba; min , the red area represent the centralized locations of #cod#x003ba; max and #cod#x003ba; min , the transition from green to blue indicates the distribution direction of #cod#x003ba; max and #cod#x003ba; min ; Pj-T corrected AMS degree versus AMS shape parameter diagram; cThe sections with the minimum principle axes #cod#x003ba; min deviation from the center position