


1 引 言
自20世纪30年代以来,虽然建立了许多SAD模型,但是哪种模型能更好地解释自然群落的实测数据,目前尚无定论[9]。起初,Motomura[10]根据生态位原理建立了SAD的几何级数模型(Geometric-series model),并对湖泊底栖动物群落进行了分析;Fisher等[11]和Preston[12]则先后建立了对数级数模型(Log-series model)和对数正态模型(Log-normal model),并在昆虫和鸟类群落中得到了验证;此后,断棍模型(Broken-stick model)、中性模型(Neutral model)和Zipf-Mandelbrot分形模型(Fractal model)等理论模型也相继被提出[13,14]。这些模型一方面为SAD研究提供了更加广阔的理论视野[15];另一方面,如何对它们进行区分与甄别,在学界也引起了很多争议和讨论[16~19]。
Su[20]重新建立的SAD分形理论模型似乎可以较好地满足这些要求:
2 研究方法
表1 以群落物种间生物个体数量降序排列,物种排序位数(r)、新增物种倍数(Kr)和第r个物种多度(Nr)之间的关系
Table 1
| 排序位数r | 新增物种 倍数Kr | Nr与Nr-1的 计算关系 | Nr与N1的 计算关系 |
|---|---|---|---|
| 1 | - | N1 | N1 |
| 2 | 2/1 | N1⋅(2)-1/d | N1⋅(2)-1/d |
| 3 | 3/2 | N2⋅(3/2)-1/d | N1⋅(3)-1/d |
| r | r/(r-1) | Nr-1⋅[r/(r-1)]-1/d | N1⋅(r)-1/d |
如表1所列,群落内各物种的个体数量可表示为:
……
令p=1/d,则有:
式中:S为群落内物种总数,r为物种的排序位数。
p模型对群落样本实测数据的拟合优度由R2判定,其计算公式为:
式中:SSR为回归平方和,SST为总平方和,
3 数据资料来源及说明
图1
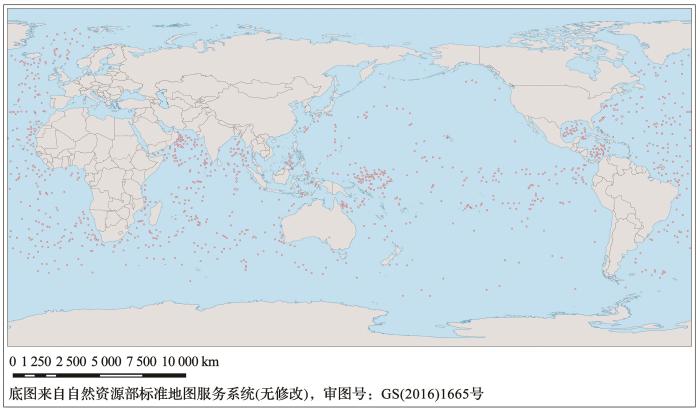
图1
布朗大学浮游有孔虫数据库(BFD)1 265个研究站位全球分布图
Fig. 1
Global distribution of 1 265 research stations in Brown University Foraminiferal Database (BFD)
表2 BFD中p值的计算结果与Su[21]对另外8个数据库p值的计算结果的详细信息
Table 2
| 数据库名称 | 最大值 | 最小值 | 中位数 | 平均数 | 样本数量 |
|---|---|---|---|---|---|
| BFD | 6.031 | 0.810 | 1.5336 | 1.649±0.032 | 1 265 |
| Diatom | 5.825 | 0.335 | 1.272 | 1.343±0.008 | 3 224 |
| Fish | 4.563 | 0.756 | 1.592 | 1.702±0.019 | 761 |
| BBS | 2.375 | 0.548 | 0.938 | 0.984±0.004 | 2 769 |
| CBC | 3.738 | 0.733 | 1.492 | 1.556±0.008 | 1 999 |
| FIA | 2.229 | 0.235 | 0.907 | 0.931±0.003 | 10 355 |
| Gentry | 1.851 | 0.352 | 0.827 | 0.872±0.019 | 222 |
| MCDB | 3.265 | 0.495 | 1.547 | 1.587±0.052 | 103 |
| NABC | 3.112 | 0.540 | 1.240 | 1.278±0.017 | 400 |
图2
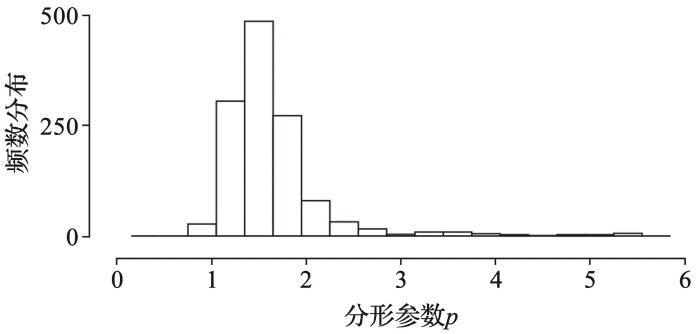
图2
BFD中1 265组群落样本分形参数p的频数分布
Fig. 2
The frequency distribution of the fractal parameter p of 1 265 groups of community samples in BFD
本研究选择该数据库的主要原因如下:
4 研究结果
p模型对BFD数据库群落样本拟合优度的计算结果显示,R2的最小值为0.632,最大值接近1.00,平均值和中值分别为0.883±0.004与0.894。其中,R2>0.8的样本占比为86.7%。图3为p模型对其中4个群落样本实测数据的拟合效果。
图3

图3
采用Su[20]提出的分形模型对从BFD中随机选取的4个自然群落的拟合
r按物种多度降序排列后的排序位数,N1和Nr分别表示降序排序中第1位和第r位物种的个体数量;R2为拟合优度,取值范围在0和1之间,R2越接近1,拟合结果越好
Fig. 3
The Su's fractal model[20] fits four natural communities randomly selected from BFD
The r was arranged in descending order of species abundance. N1 and Nr are the abundances of the 1st and r-th species in descending order of species abundance, respectively. R2 is the goodness of fit. The closer R2 is to 1, the better the fitting result is
5 讨 论
目前,不同SAD模型的对比研究已得到了广泛关注[9,25~27],但由于研究方法与数据资料的局限性,大多数结论未能在研究者中形成共识[19~21]。分形理论与其他生态学理论(如生态位理论和中性理论)的比较[13~15,18]及p模型与其他分形模型(如Zipf-Mandelbrot分形模型)在条件假设、适用范围、拟合结果及参数的生态学意义等方面的差异[20, 21]已在过去的研究中得到详细论证,在此不再赘述。基于现有的评判标准[18~20],如何考量p模型的研究价值和科学意义,本研究将从以下3个方面进行分析和探讨:
首先,研究结果表明p模型对BFD数据库群落样本拟合效果很好。一方面,所有样本的R2值均大于0.6。这说明,p模型的拟合曲线与BFD群落样本的实测数据基本一致;另一方面,R2>0.8的样本占比为86.7%。这说明p模型的拟合结果与绝大多数群落样本非常吻合。因此,p模型可以较好地拟合BFD的实测数据。
其次,根据分形参数p的统计分析结果,SAD的一般性规律可以得到BFD数据资料库的支持。BFD中群落样本p的中值和平均值分别为1.533、1.649±0.032,与Su[21]对另外8个数据库p值的计算结果进行对比(表2),9个数据库中p的平均值和中值均接近1。同时,根据p的频数分布图(图2),p值很少有远大于1或非常接近0的情况,其峰值集中在1.35~1.65。上述两点说明,BFD群落样本的p值在大于1的范围内趋近于1。根据
6 结 语
参考文献
Species abundance patterns and community structure
[J].
Dominance and diversity in land plant communities: numerical relations of species express the importance of competition in community function and evolution
[J].
Neutral theory and relative species abundance in ecology
[J].
Unveiling the species-rank abundance distribution by generalizing the Good-Turing sample coverage theory
[J].
Deep-sea coral forest
[J].
深水珊瑚林
[J].
Species abundance distribution pattern of typical grassland plant communities under different utilization patterns
[J].
不同利用方式下典型草原植物群落物种多度分布格局
[J].
Species abundance distribution models of Toona ciliata communities in Hubei Province, China
[J].
Fractal analysis of community species abundance pattern
[J].
群落物种多度格局的分形解析
[J].
A meta-analysis of species-abundance distributions
[J].
On the statistical treatment of communites
[J].
The relation between the number of species and the number of individuals in a random sample of an animal population
[J].
Species diversity as a fractal property of biomass
[C]// NOVAK M, ed.
Research progress on species abundance relationship model of multi species aggregation
[J].
多物种集合的种—多度关系模型研究进展
[J].
Modeling macroscopic patterns in ecology
[J].
A comment on Hubbell's zero-sum ecological drift model
[J].
Species abundance distributions: moving beyond single prediction theories to integration within an ecological framework
[J].
An extensive comparison of species-abundance distribution models
[J].
Analyzing fractal property of species abundance distribution and diversity indexes
[J].
A general pattern of the species abundance distribution
[J].
Environmental controls on the geographic distribution of zooplankton diversity
[J].
Research on the determinability of determinable coefficient in regression model
[J].
回归模型可决系数的可决性研究
[J].
Abundance inequality in freshwater communities has an ecological origin
[J].
Characterizing species abundance distributions across taxa and ecosystems using a simple maximum entropy model
[J].
Commonness and rarity in the marine biosphere
[J].
Challenges and development trend of species distribution model
[J].
物种分布模型面临的挑战与发展趋势
[J].
Neutral theory and niche theory of community construction
[J].
群落构建的中性理论和生态位理论
[J].
On measures of entropy and information
[C]//NEYMAN J.
Diversity and evenness: a unifying notation and its consequences
[J].
The impact of neutrality, niche differentiation and species input on diversity and abundance distributions
[J].
Review: on the species abundance distribution in applied ecology and biodiversity management
[J].
Testing species abundance models: a new bootstrap approach applied to Indo-Pacific coral reefs
[J].
A unified model of species immigration, extinction and abundance on islands
[J].
A new species abundance distribution model based on model combination
[J].

 甘公网安备62010202000687