印度洋偶极子研究进展回顾
|
|
姜继兰, 刘屹岷, 李建平, 张人禾
|
Indian Ocean Dipole: A Review and Perspective
|
|
Jilan JIANG, Yimin LIU, Jianping LI, Renhe ZHANG
|
|
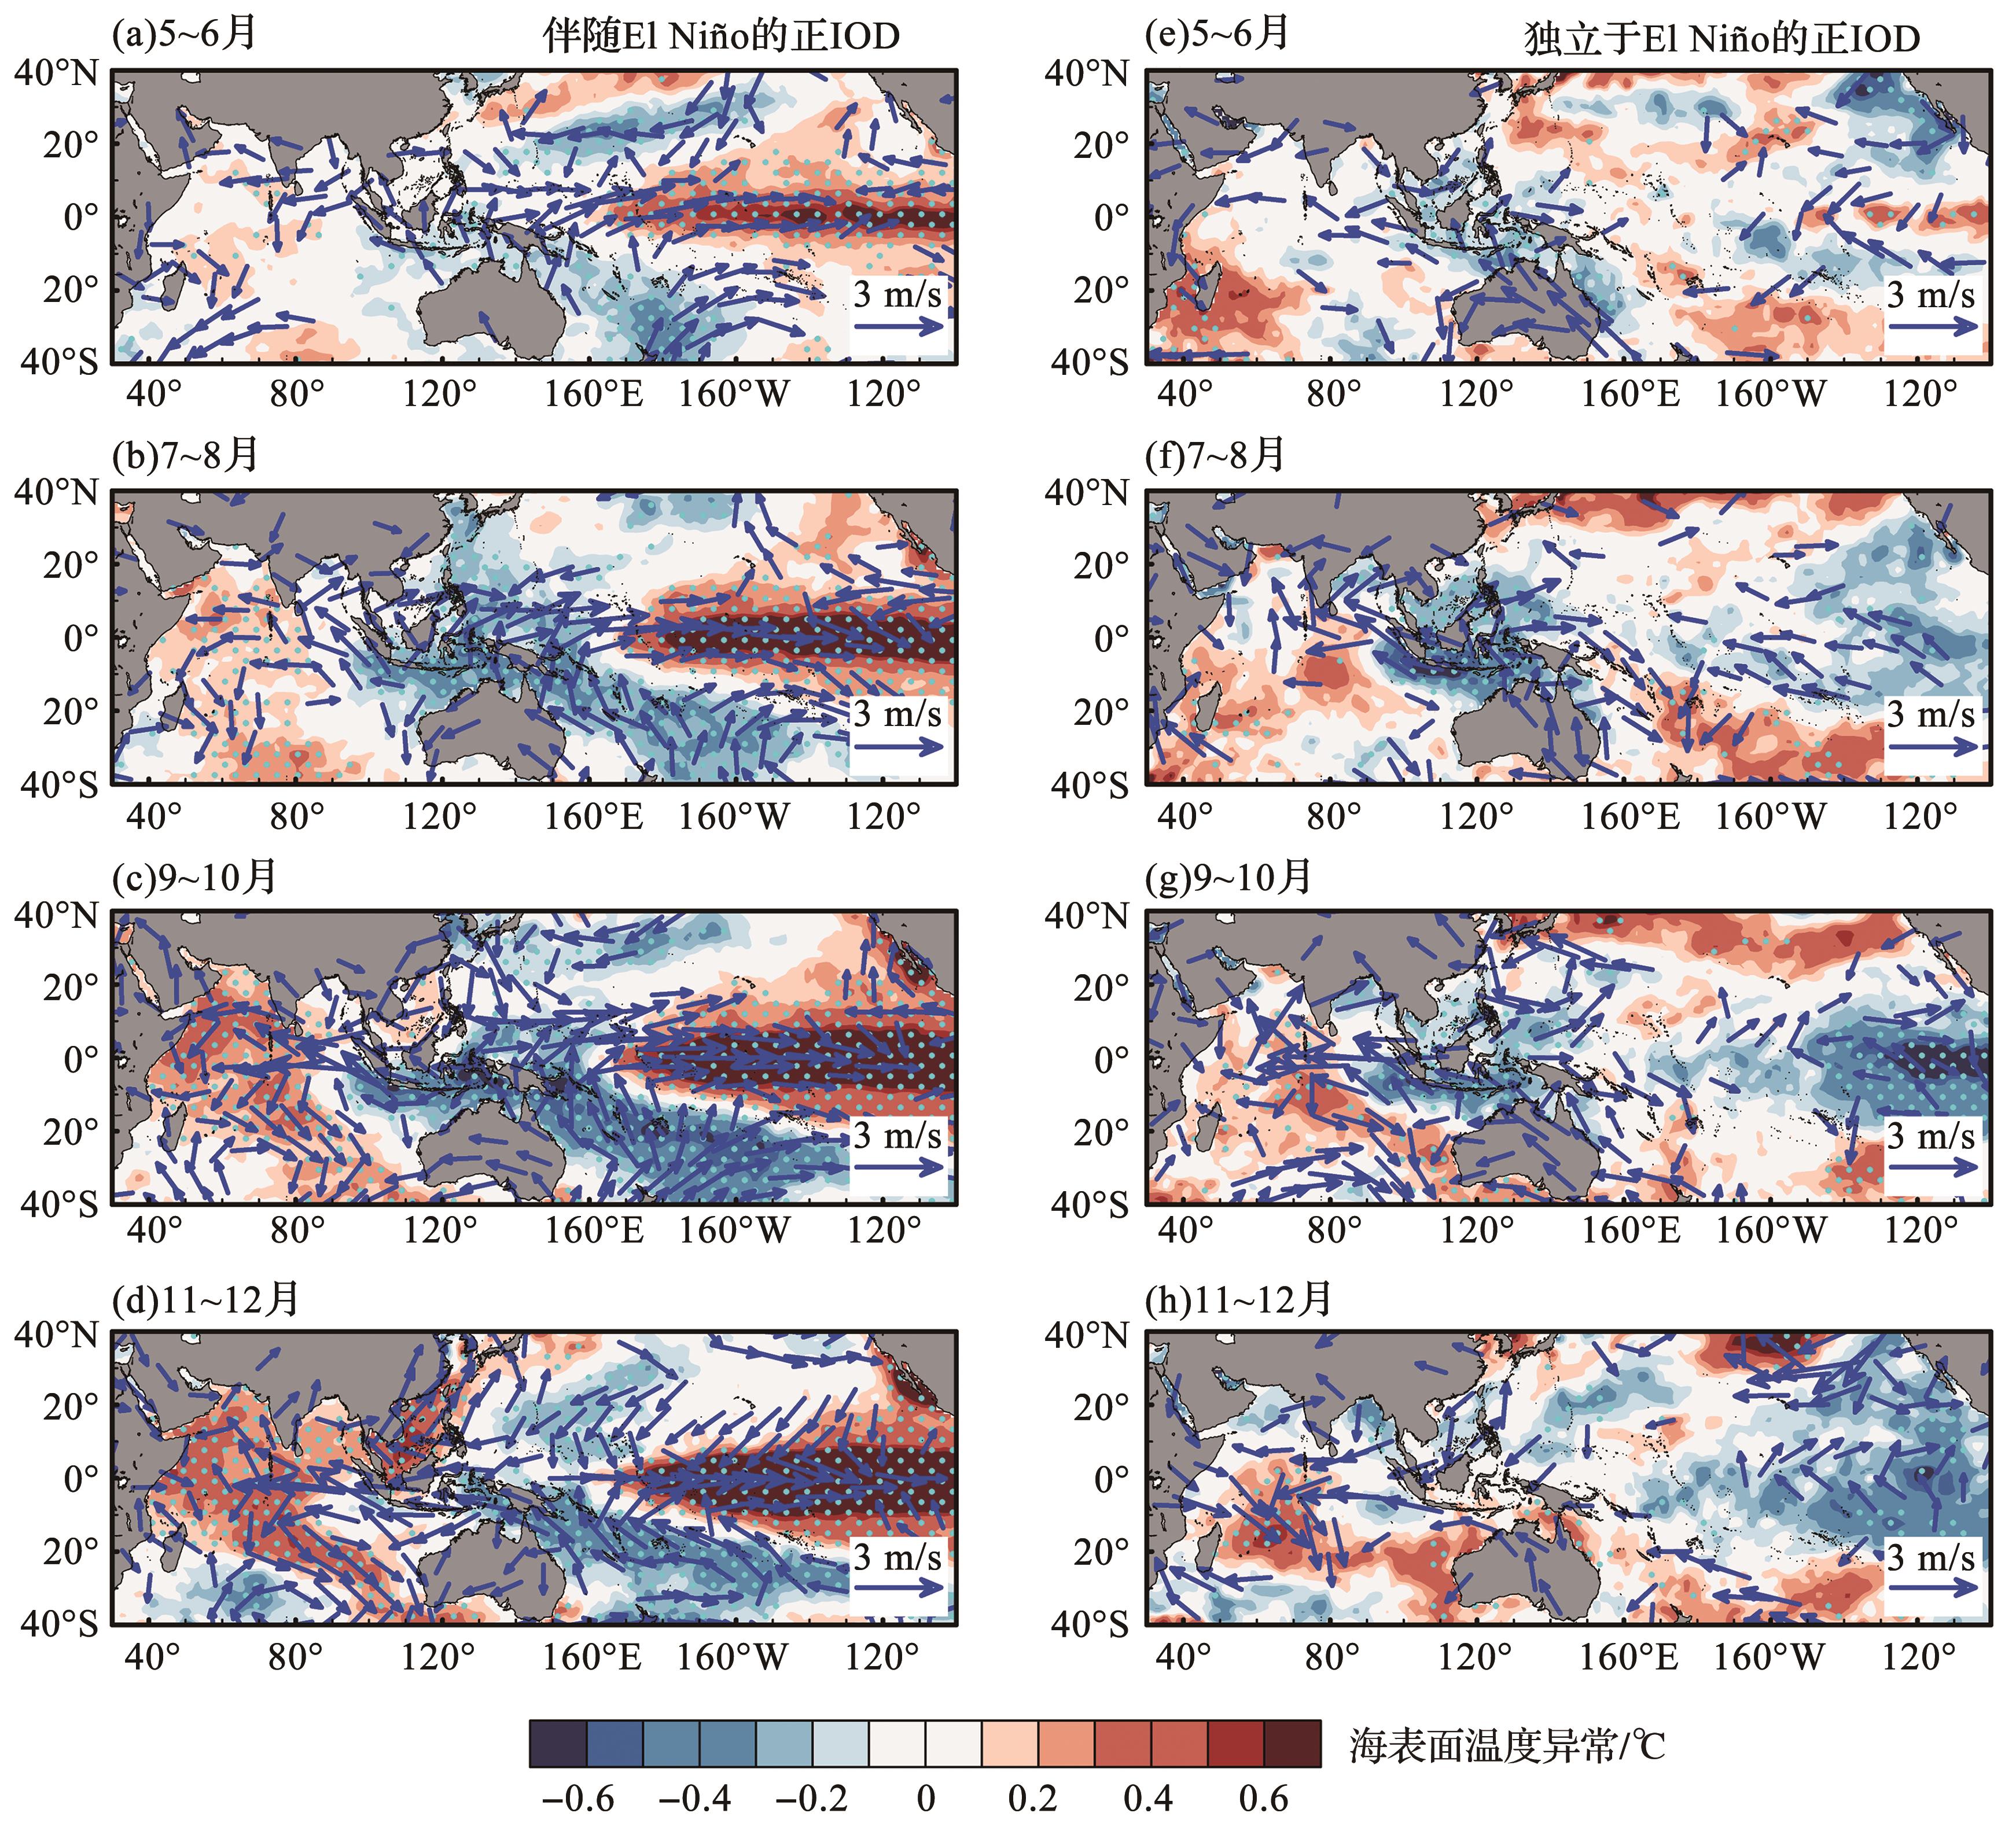
图1 正IOD年SST异常(阴影,单位:℃)和925 hPa风异常(矢量箭头,单位:m/s)的双月平均合成图
(a)~(d)伴随El Ni?o的正IOD年(包括:1951年、1963年、1972年、1977年、1982年、1987年、1991年、1994年、1997年、2002年、2006年和2015年)的合成图;(e)~(h)为独立于El Ni?o的正IOD年(包括:1961年、1967年、2011年和2019年)的合成图。数据为来自哈德莱中心的SST[53]和来自NCEP/NCAR再分析资料1[54]的风场。图中打点区域表示通过显著性水平α为0.1的双侧学生t检验,图中仅给出了通过显著性水平α为0.1的风矢量
|
Fig. 1 Bimonthly averaged composite SST anomaly (shading, ℃) and 925 hPa wind anomaly (vectors, m/s) for positive IODs
(a)~(d) for positive IODs co-occurring with El Ni?o, including 1951,1963,1972,1977,1982,1987,1991,1994,1997,2002,2006,2015; (e)~(h) for positive IODs independent on El Ni?o, including 1961,1967,2011,2019. SST and wind field data are obtained from Hadley Center[53] and NCEP/NCAR reanalysis1[54], respectively. Cyan stipples indicate the 0.1 significance level from a Student's two-tailed t test. Only wind vectors that are significant at the 0.1 significance level are plotted
|
|
|
|
|