“一带一路”沿线国家农作物虚拟水贸易时空格局及驱动因素分析
陈良侃1,2( ), 陈少辉1()
), 陈少辉1()
Analysis of Spatiotemporal Pattern and Drivers of Virtual Crops Water Trade Along the Belt and Road
Liangkan CHEN1,2(), Shaohui CHEN1()
), Shaohui CHEN1()
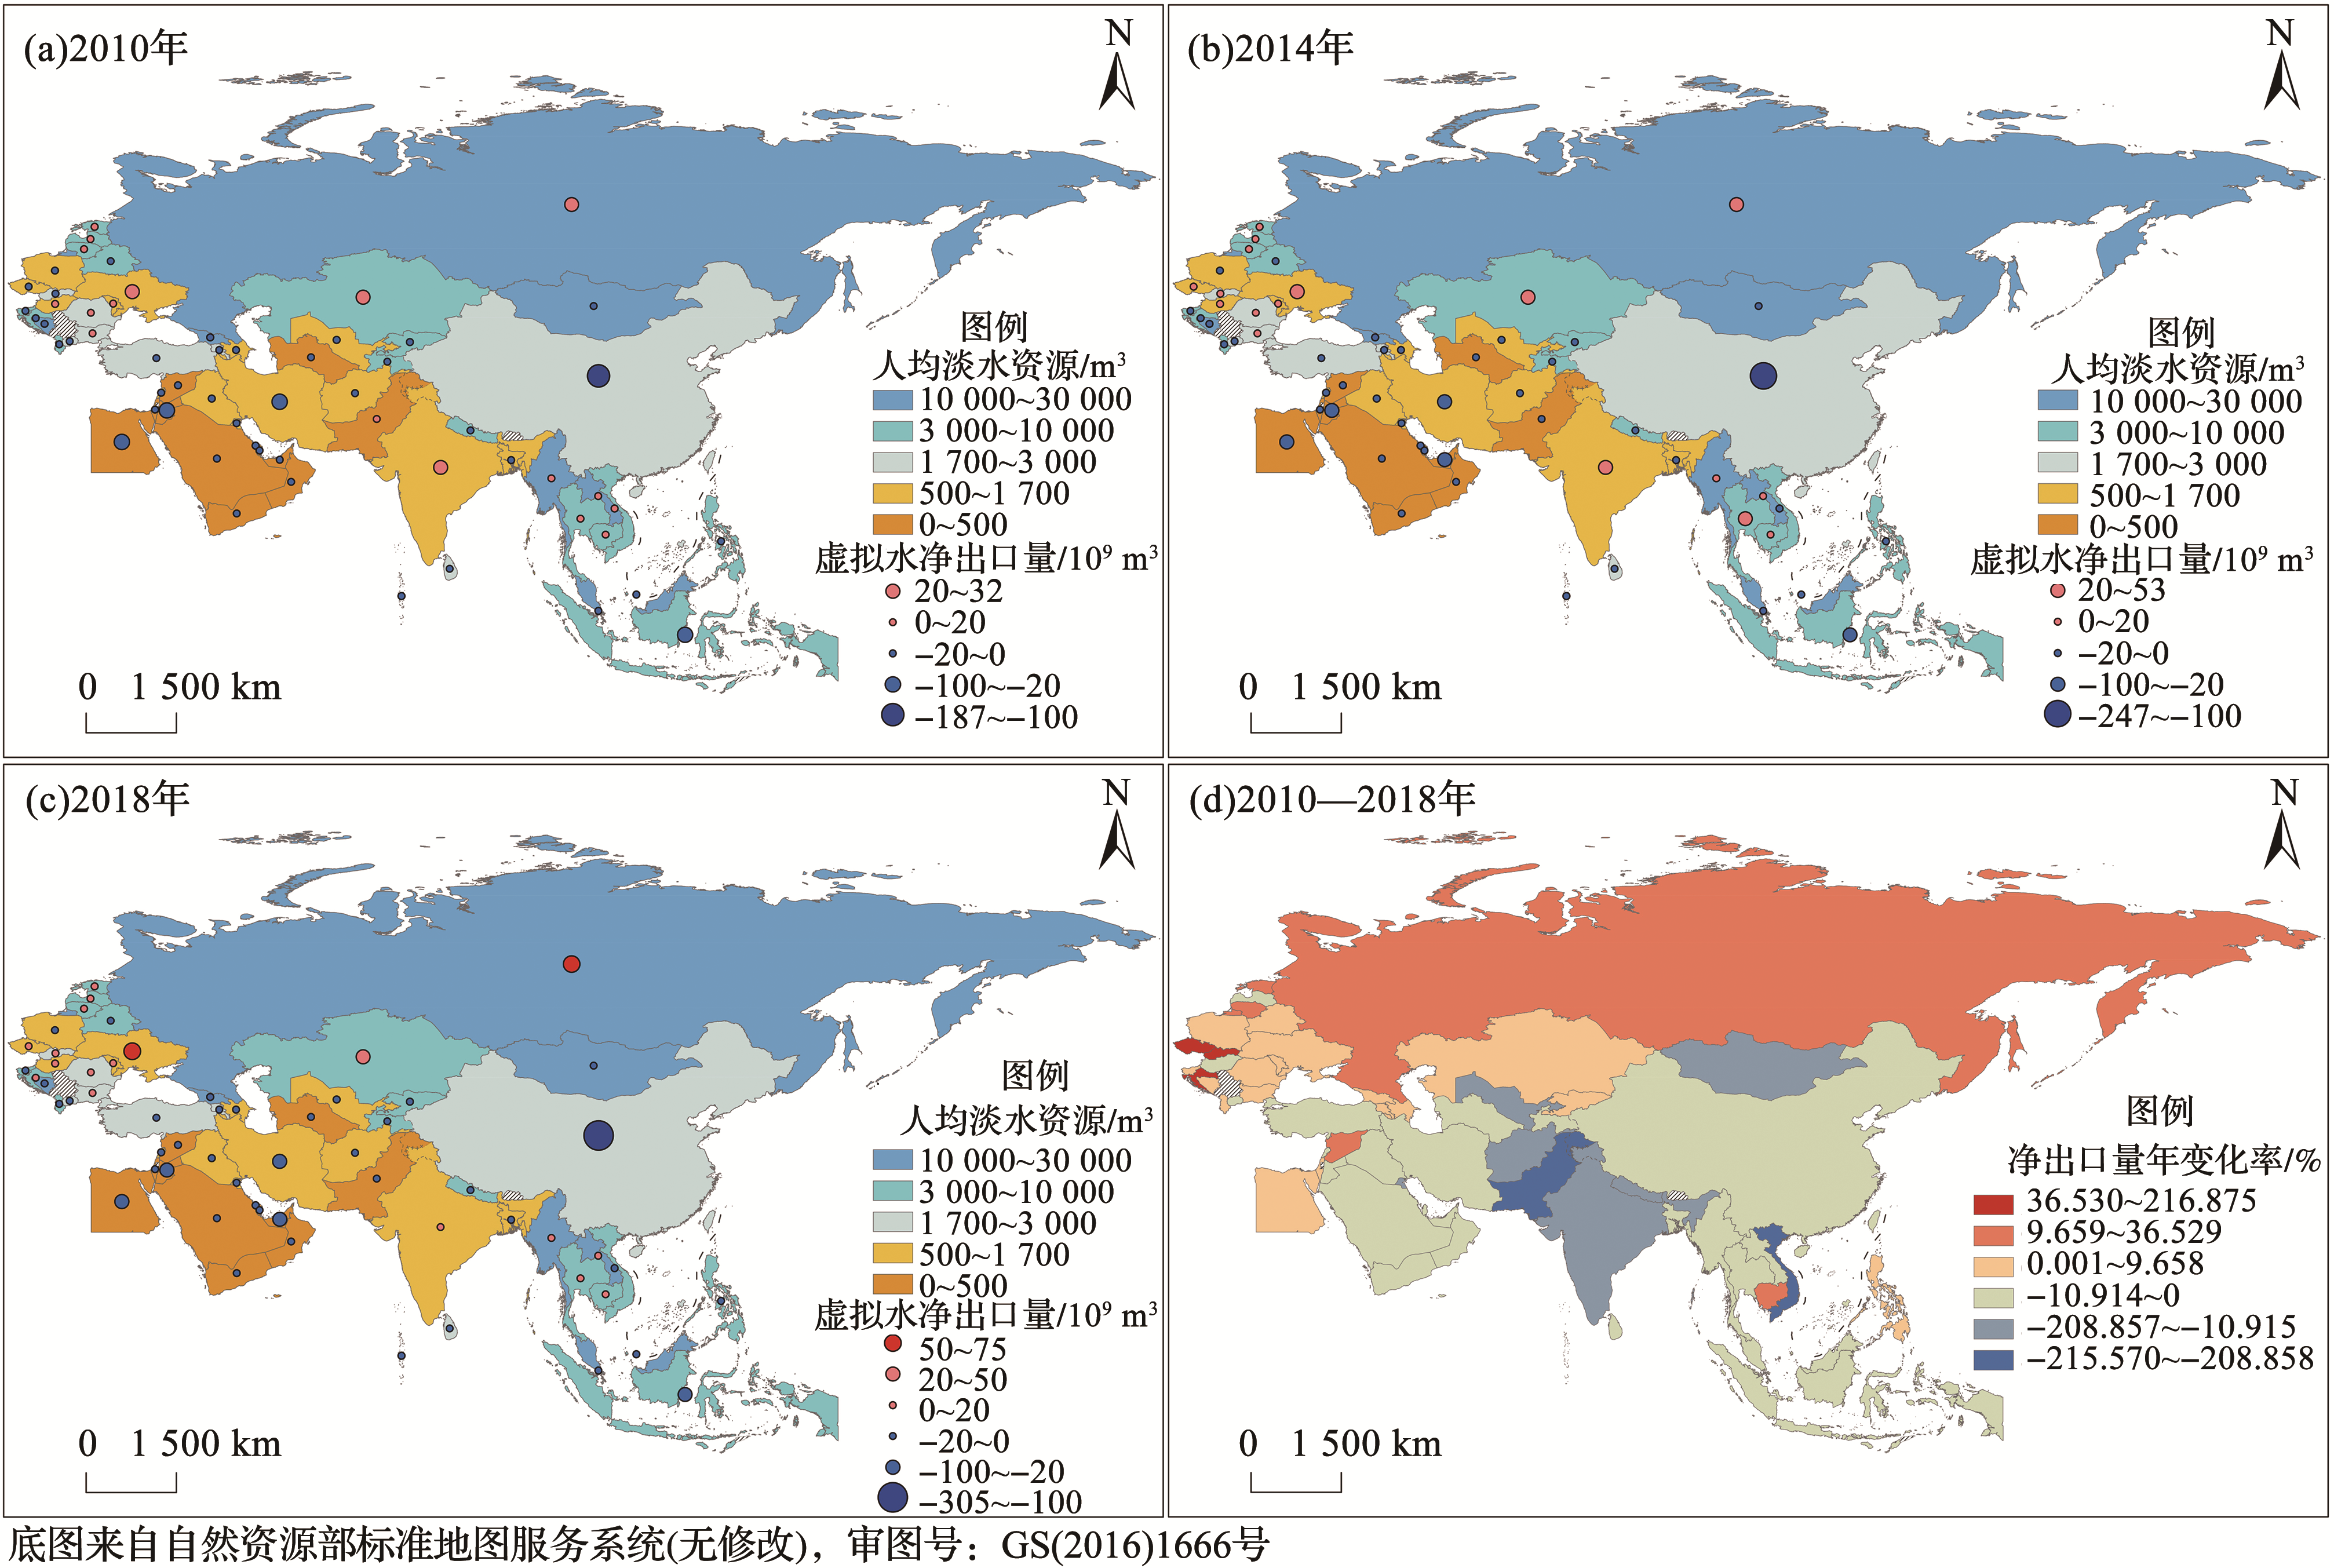
图4. 2010—2018年“一带一路”国家农作物虚拟水净出口量的空间分布格局
人均淡水资源数据从World Bank数据库中获取,由部分国家连续年份数据的缺失,所选数据时间均为2014年;净出口基期为负时,变化率=1-(末期/基期)^(1/年数)
Fig.4. Spatial distribution pattern of net export of virtual crop water alone the Belt and Road from 2010 to 2018
Renewable internal freshwater resources per capita from the World Bank database, by the absence of data for some countries in consecutive years, data of 2014 is selected for the graph; When the net export base period is minus, the rate of changes equals 1-(end/base period)^(1/years)