), 王荣2(), 刘正文1,2,3, 郑文秀2,4, 张晨雪2,5
), Rong WANG2(), Zhengwen LIU1,2,3, Wenxiu ZHENG2,4, Chenxue ZHANG2,5
), 王荣2(), 刘正文1,2,3, 郑文秀2,4, 张晨雪2,5
), Rong WANG2(), Zhengwen LIU1,2,3, Wenxiu ZHENG2,4, Chenxue ZHANG2,5
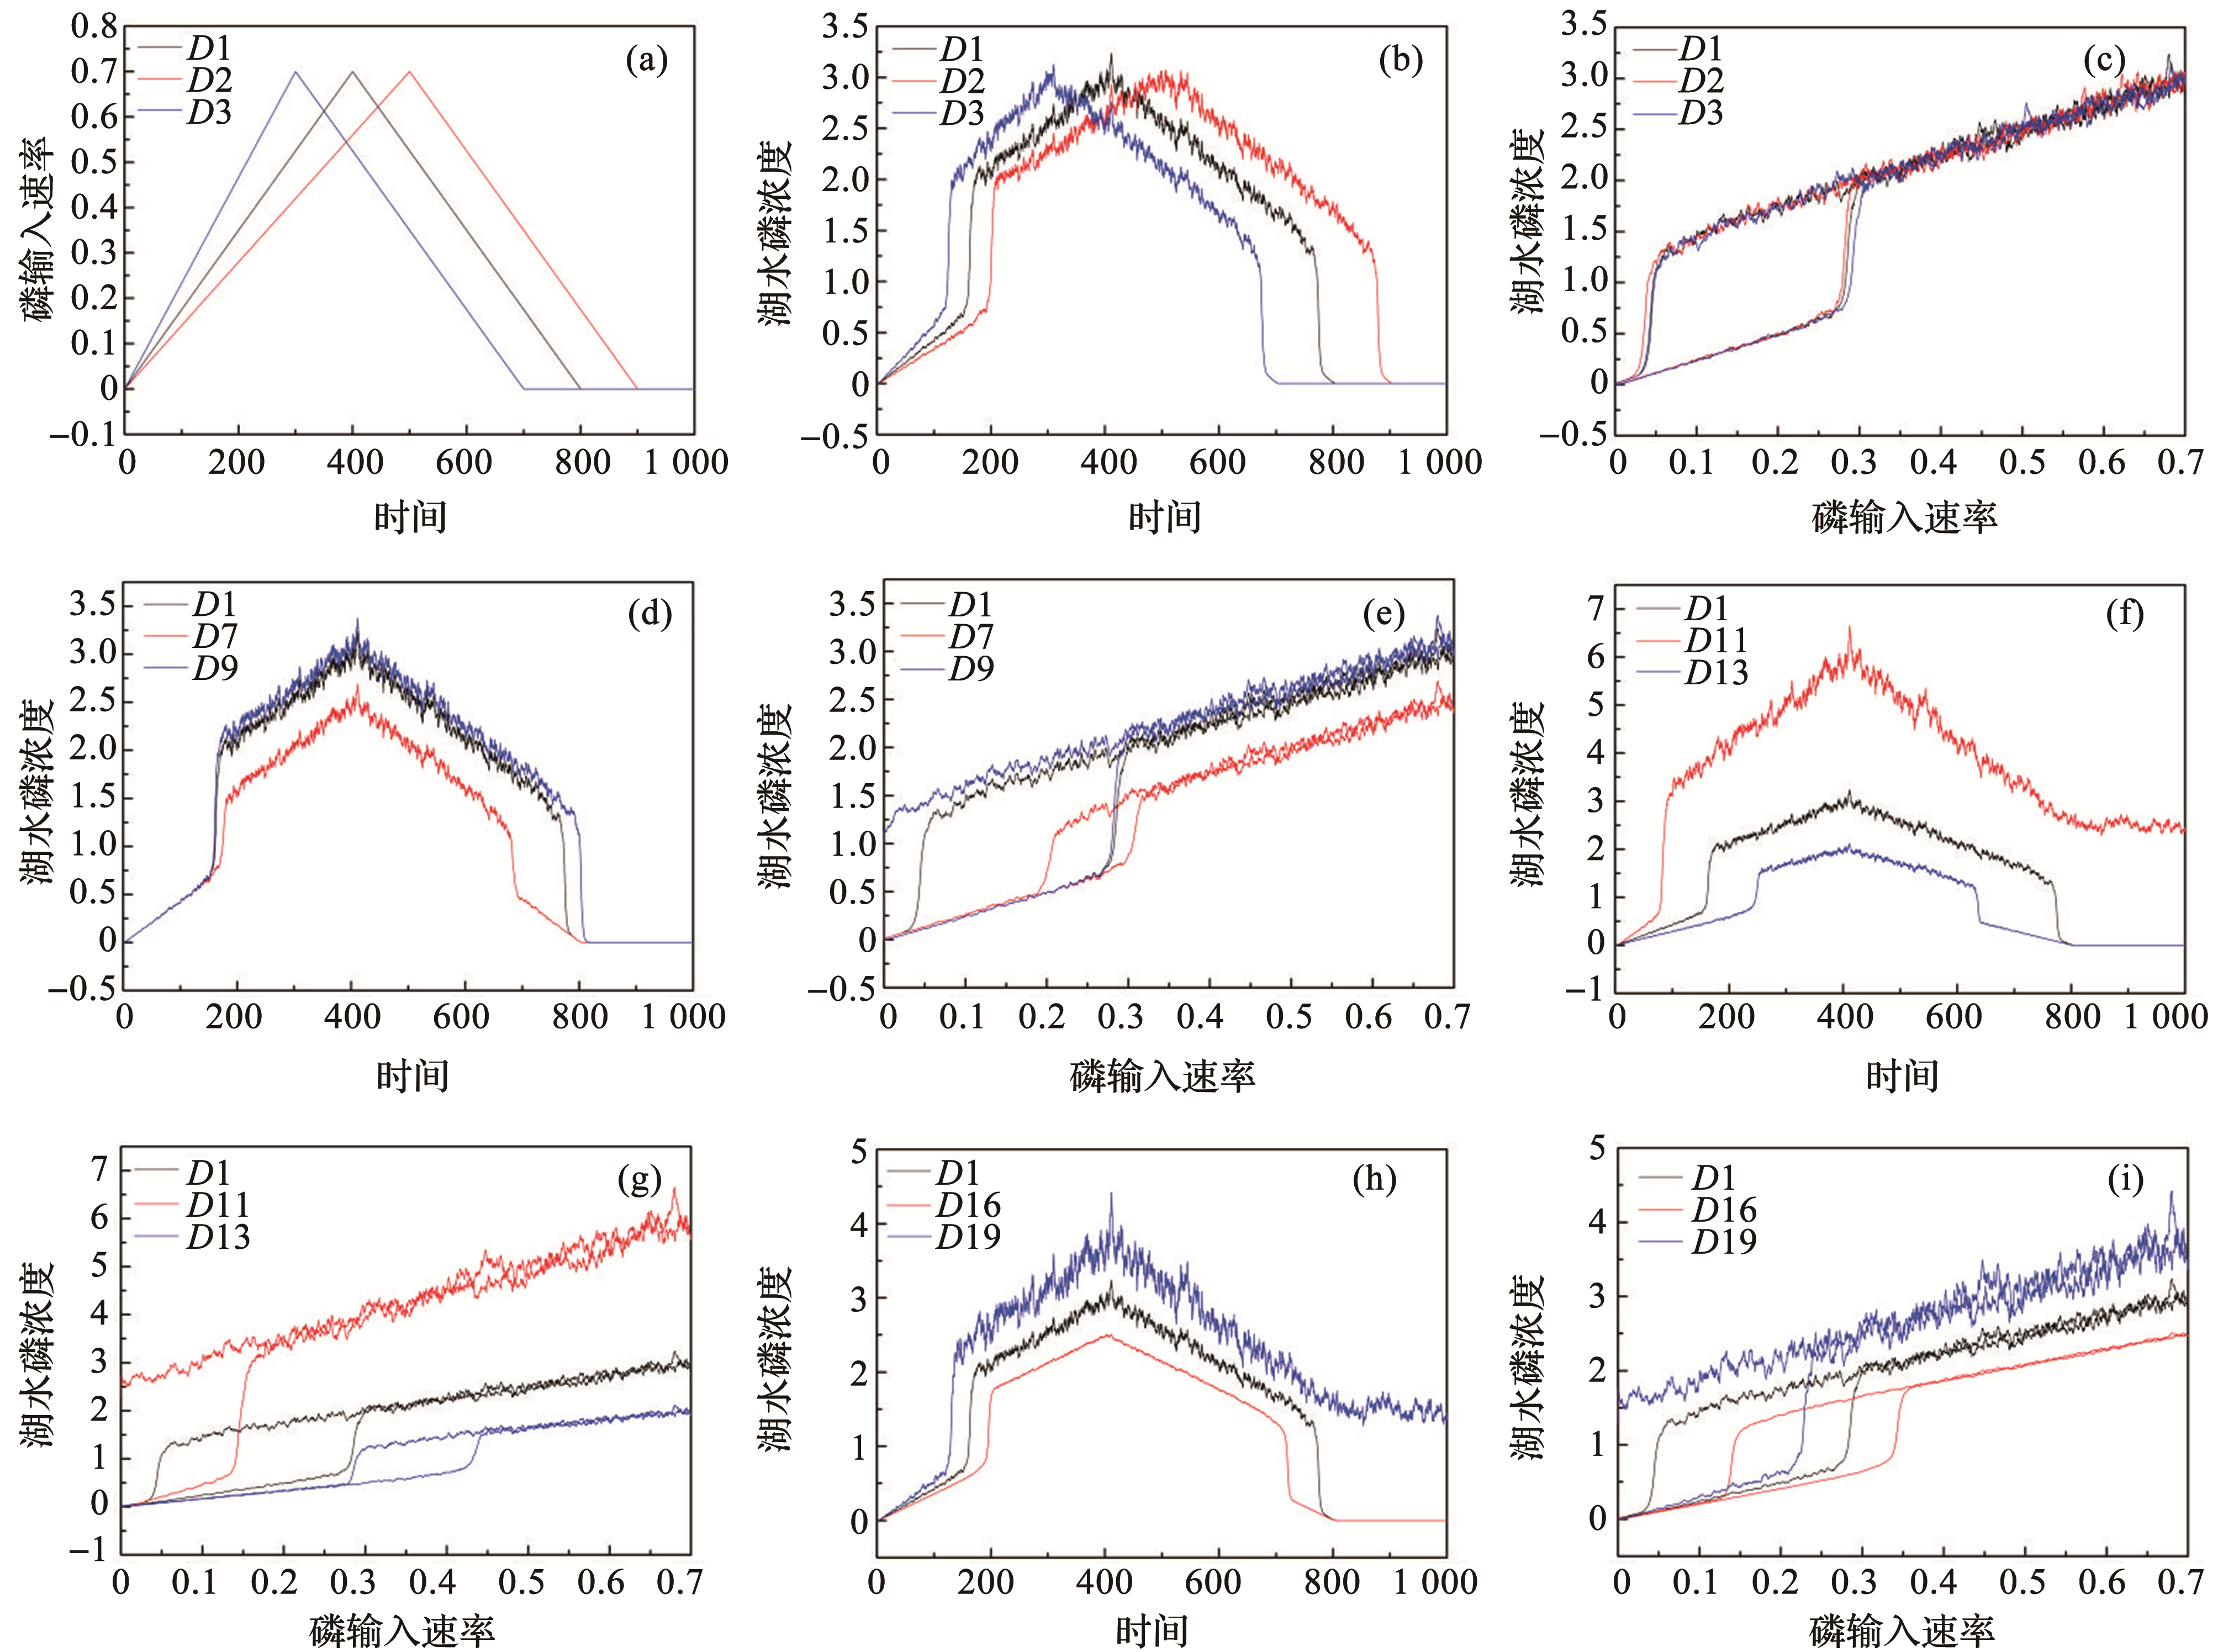
图3. 磷动力学模型结果
(a) ~ (c)分别是指改变α的斜率后对应的磷输入速率随时间变化的图(α-t图)、湖水磷浓度随时间变化的图(P-t图)、湖水磷浓度随磷输入速率变化的图(P-α图);(d)和(e)分别是指改变r值大小所对应的湖水磷浓度随时间变化的图(P-t图)、湖水磷浓度随磷输入速率变化的图(P-α图);(f)和(g)分别是指改变s值大小所对应的湖水磷浓度随时间变化的图(P-t图)、湖水磷浓度随磷输入速率变化的图(P-α图);(h)和(i)分别是指改变σ值大小所对应的湖水磷浓度随时间变化的图(P-t图)、湖水磷浓度随磷输入速率变化的图(P-α图)
Fig.3. Results of the phosphorus kinetic model
(a)~(c) Respectively refer to the graph of the change of phosphorus input rate with time after changing the slope of α (α-t graph), the graph of the change of water phosphorus concentration with time (P-t graph), and the phosphorus concentration of water graph of change with phosphorus input rate (P-α graph);(d) and (e) Respectively refer to the graph of changes in water phosphorus concentration with time (P-t graph) and the graph of changes in water phosphorus concentration with phosphorus input rate (P-α graph) corresponding to changes in the value of r; (f) and (g) Respectively refer to the graph of the change of phosphorus concentration in water with time (P-t graph) and the graph of the change of phosphorus concentration in water with phosphorus input rate (P-α graph) when the value of s is changed;(h) and (i) Respectively refer to the graph of the change of phosphorus concentration in water with time (P-t graph) and the graph of the change of phosphorus concentration in water with the phosphorus input rate (P-α graph) corresponding to the size of σ value