CMIP5和CMIP6模式在历史试验下对AMO和PDO的模拟评估
夏松( ), 刘鹏(), 江志红, 程军
), 刘鹏(), 江志红, 程军
Simulation Evaluation of AMO and PDO with CMIP5 and CMIP6 Models in Historical Experiment
Song XIA(), Peng LIU(), Zhihong JIANG, Jun CHENG
), Peng LIU(), Zhihong JIANG, Jun CHENG
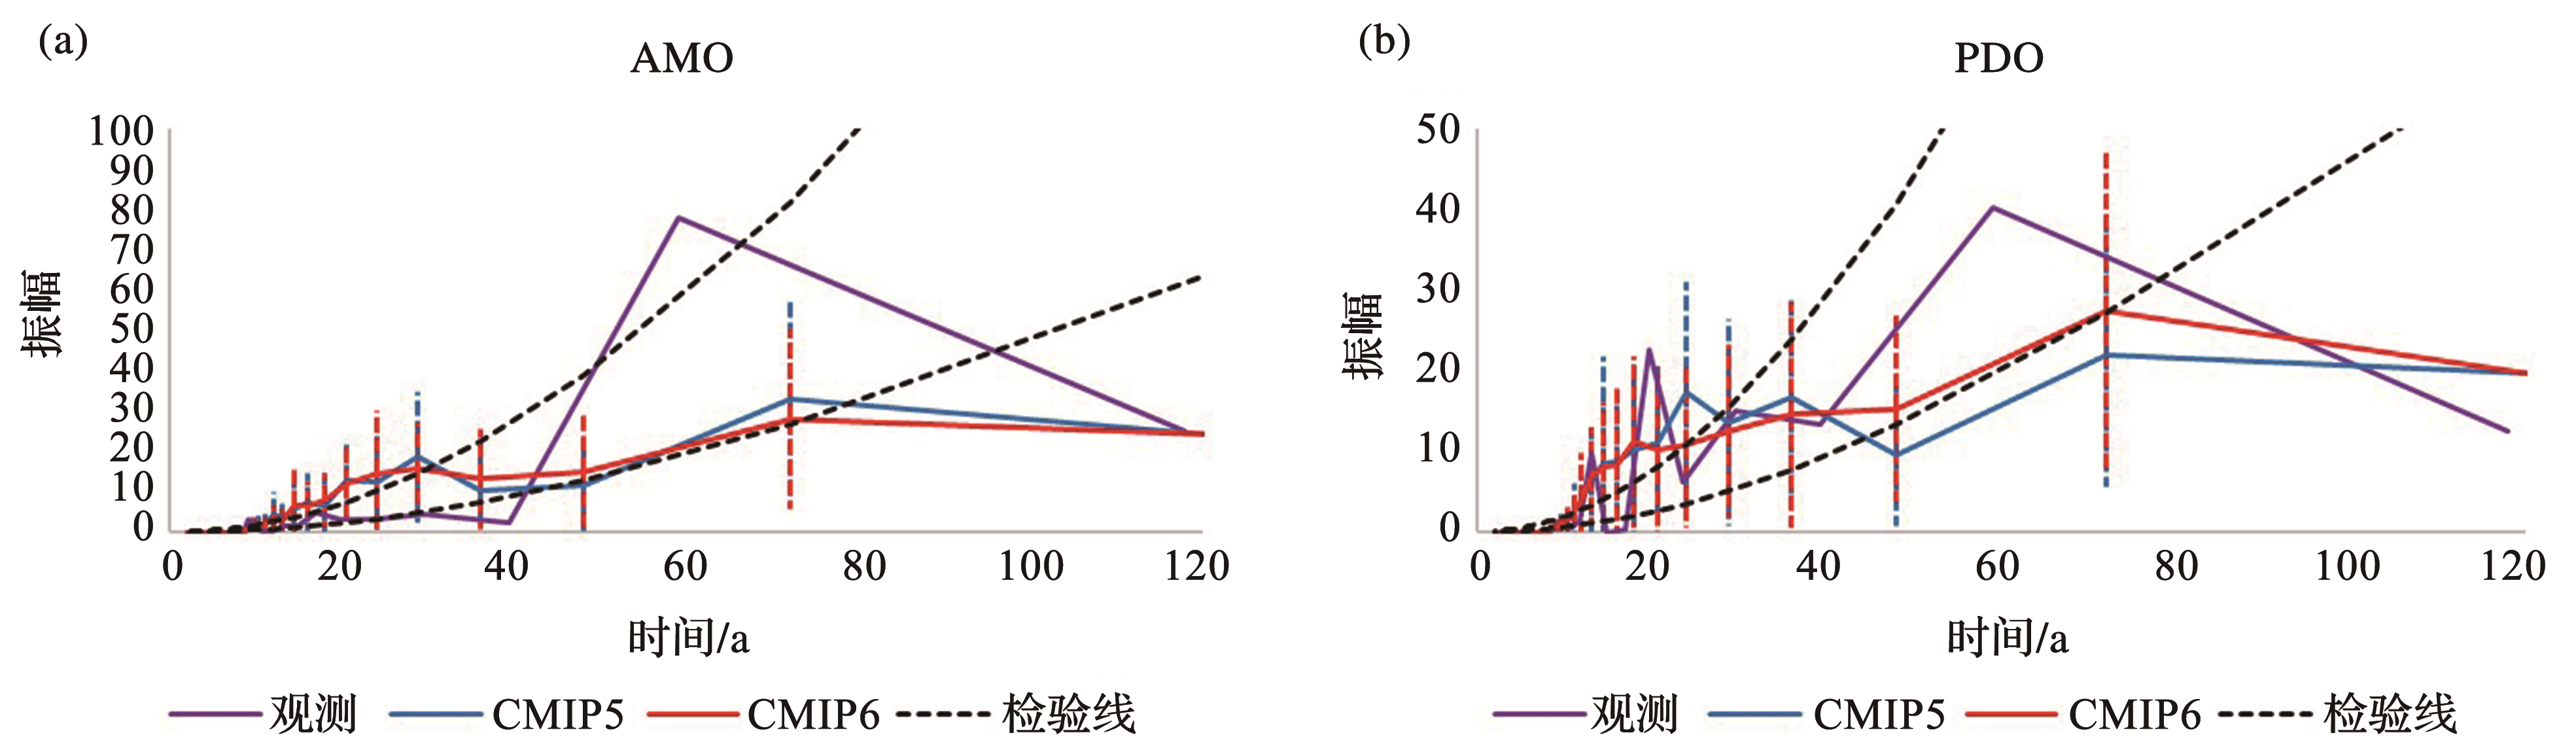
图3. 观测以及CMIP5和CMIP6的功率谱
(a) AMO;(b) PDO;紫色线为观测资料,蓝色线为CMIP5多模式集合,红色线为CMIP6多模式集合,较高黑色虚线为95%检验线,较低黑色虚线为红噪音线,垂直虚线为模式标准差
Fig.3. The power spectrum of the observation,CMIP5 and CMIP6
(a) AMO;(b) PDO; The purple line is the observation data,the blue line is the MME of CMIP5,the red line is the MME of CMIP6,the higher black dotted line is the 95% test line,the lower black dotted line is the red noise line,and the vertical dotted line is the standard deviation between models