风成沉积物叶蜡氢同位素在揭示东亚季风区干湿变化中的原理及应用
梁承弘( ), 鹿化煜()
), 鹿化煜()
The Application of Leaf Wax n-alkanes δD in Aeolian Sediments as a Proxy for Reconstructing Quaternary Humidity Variations in the Monsoonal East Asia
Chenghong LIANG(), Huayu LU()
), Huayu LU()
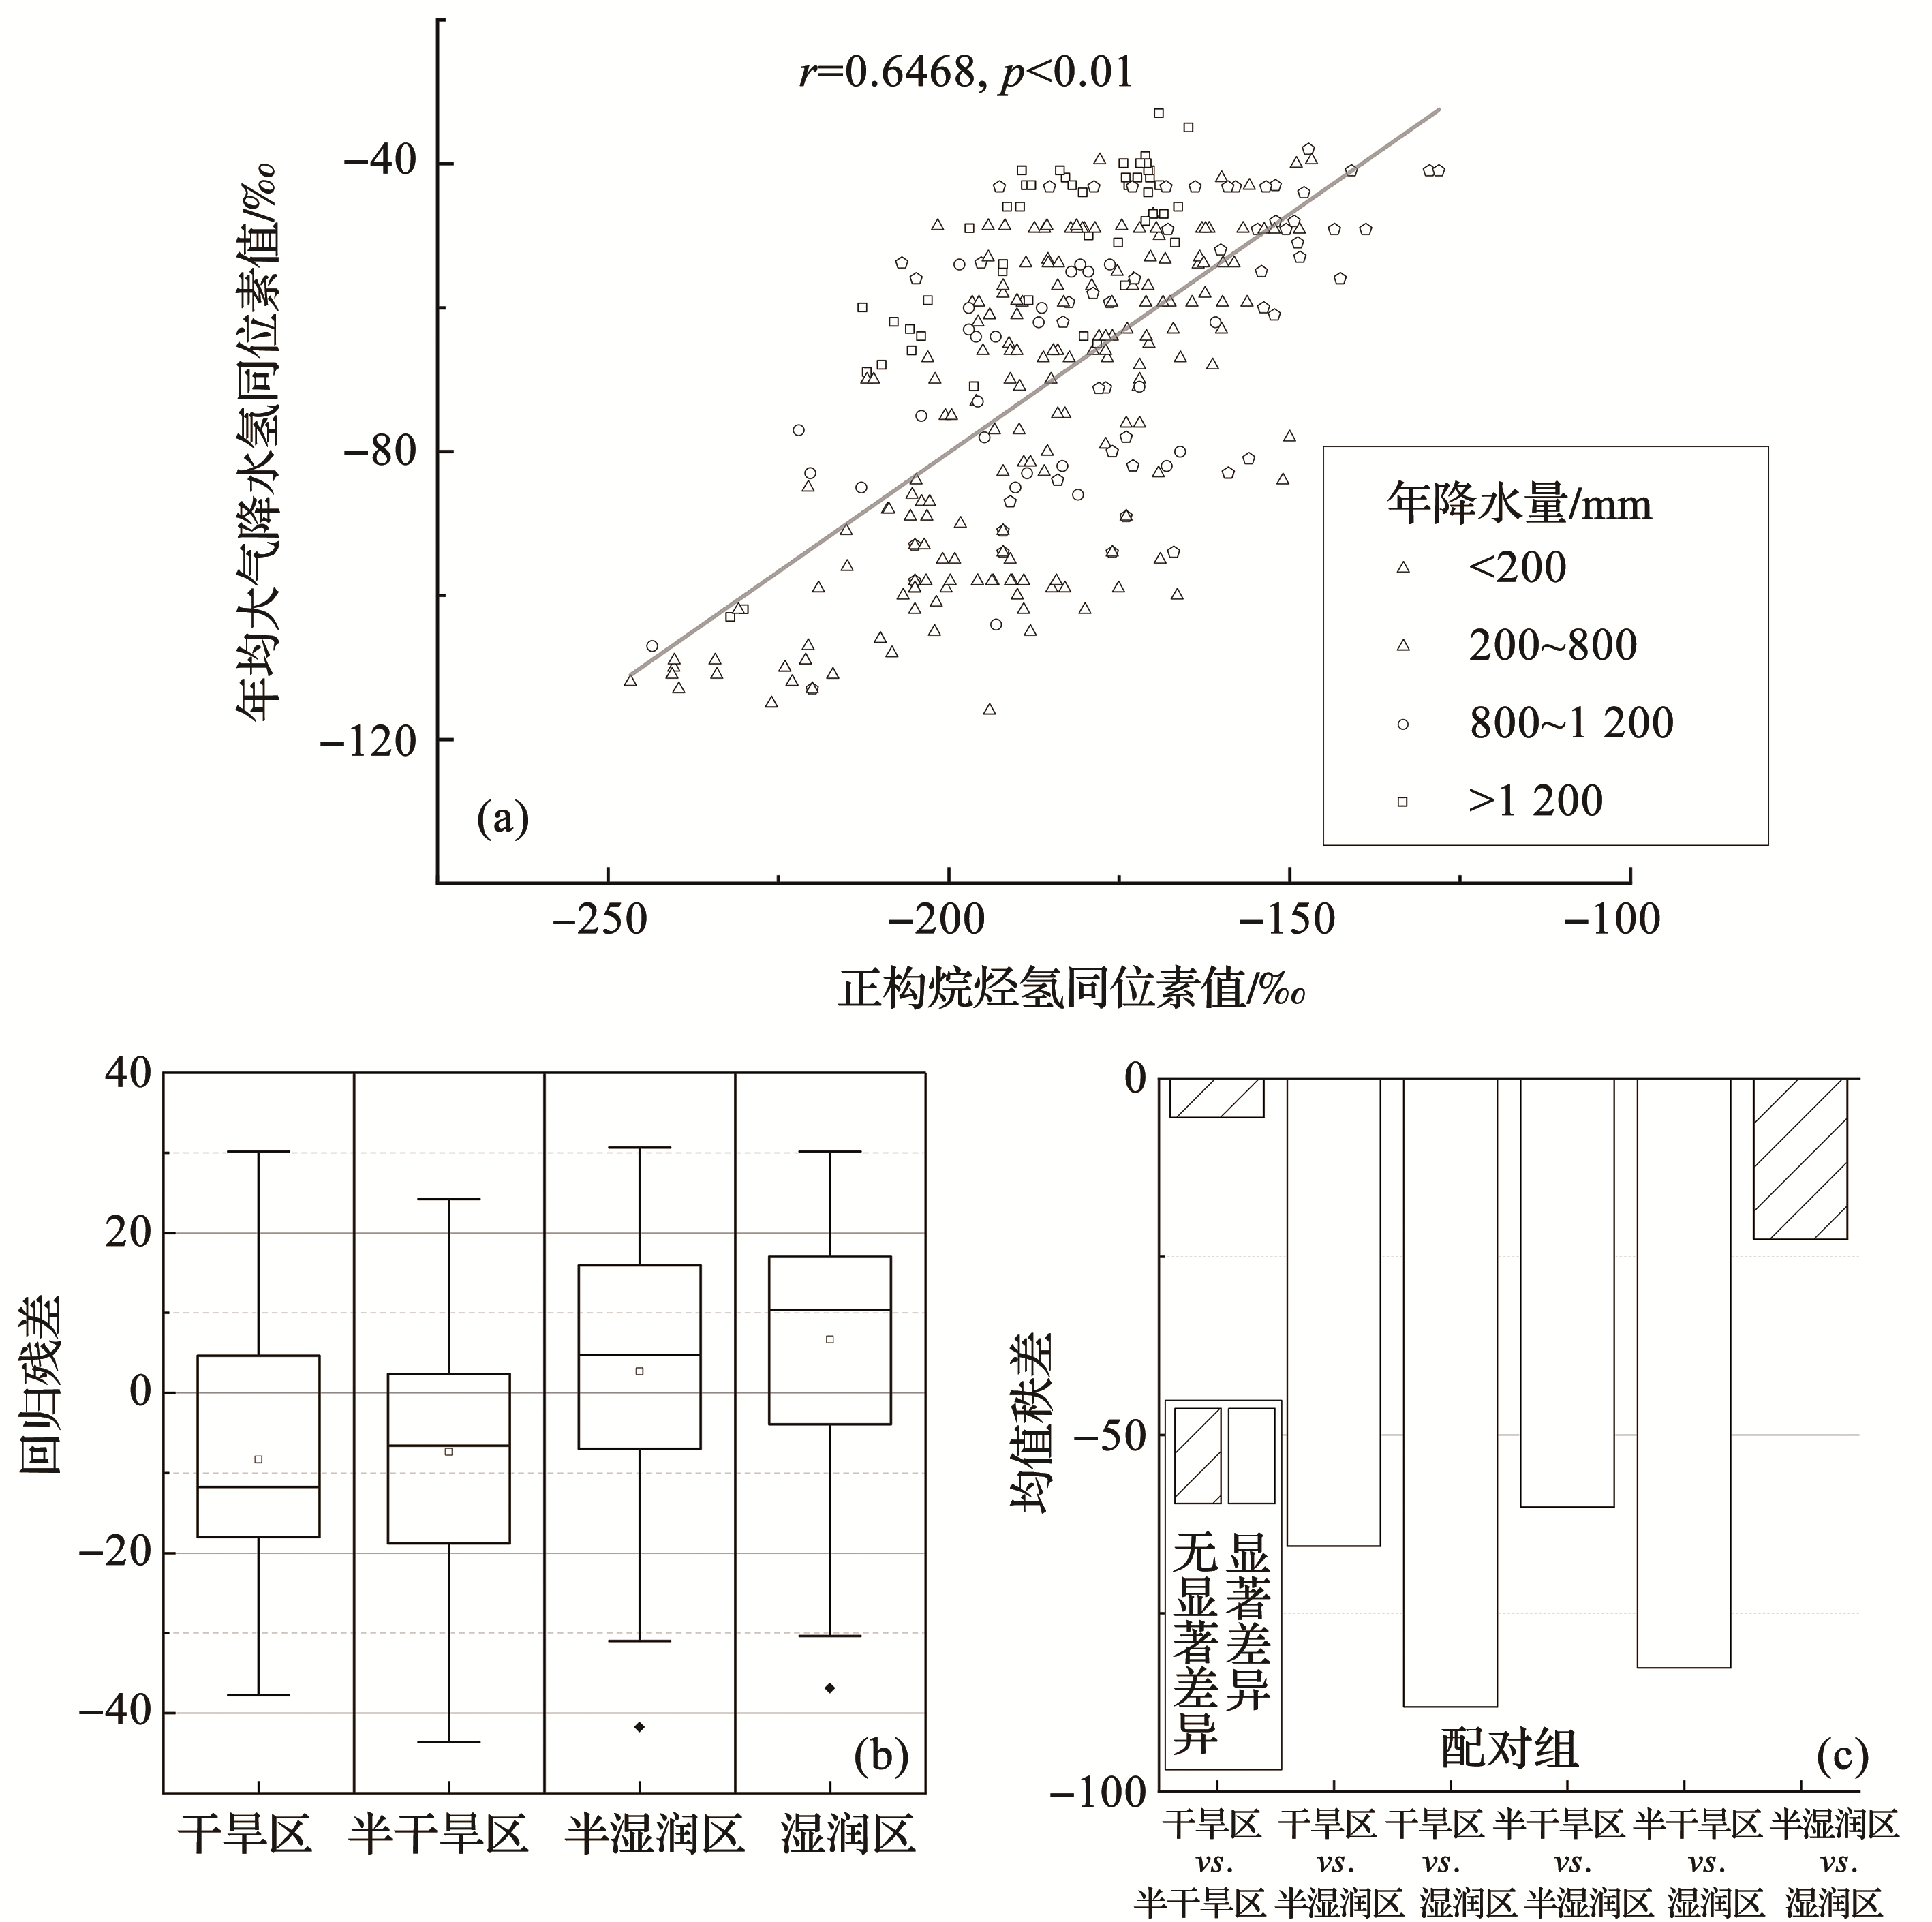
图2. 正构烷烃氢同位素—年均大气降水氢同位素回归分析(a)及不同气候区间差异分析(b,c)
(a)正构烷烃氢同位素值—降水氢同位素值相关分析(显著性水平为0.05);(b)不同气候区回归残差箱式图(中心线为中位数,中心点为平均值,箱体为四分位距,箱外线为1.5倍中位距,箱外点为异常值);(c)不同气候区回归残差组间K-W及Dunnett’s t差异检验
Fig.2. Correlation analysis of δDwax and δDp (a) and their variations in different climate zone (b,c)
(a) Correlation analysis of δDwax and δDp (significant level: p< 0.05);(b) Box plot of ei in different climate zone (middle line is the median,middle point is the mean value,the box is the interquartile range,the line outside the box is the 1.5 times interquartile range,and the point outside the box is the abnormal value);(c) K-W & Dunnett's t test of ei in different climate zone