1736—1911年华北饥荒的时空分布及其与气候、灾害、收成的关系
Spatio-temporal Distribution of Famine and Its Relationship with Climate, Disaster, Harvest in North China During 1736-1911
(a) 华北冬半年冬温距平(分辨率5年)[
(a) 5-year temperature anomaly of winter half year in North China[
1736—1911年华北饥荒的时空分布及其与气候、灾害、收成的关系 |
| 萧凌波 |
|
Spatio-temporal Distribution of Famine and Its Relationship with Climate, Disaster, Harvest in North China During 1736-1911 |
| Lingbo Xiao |
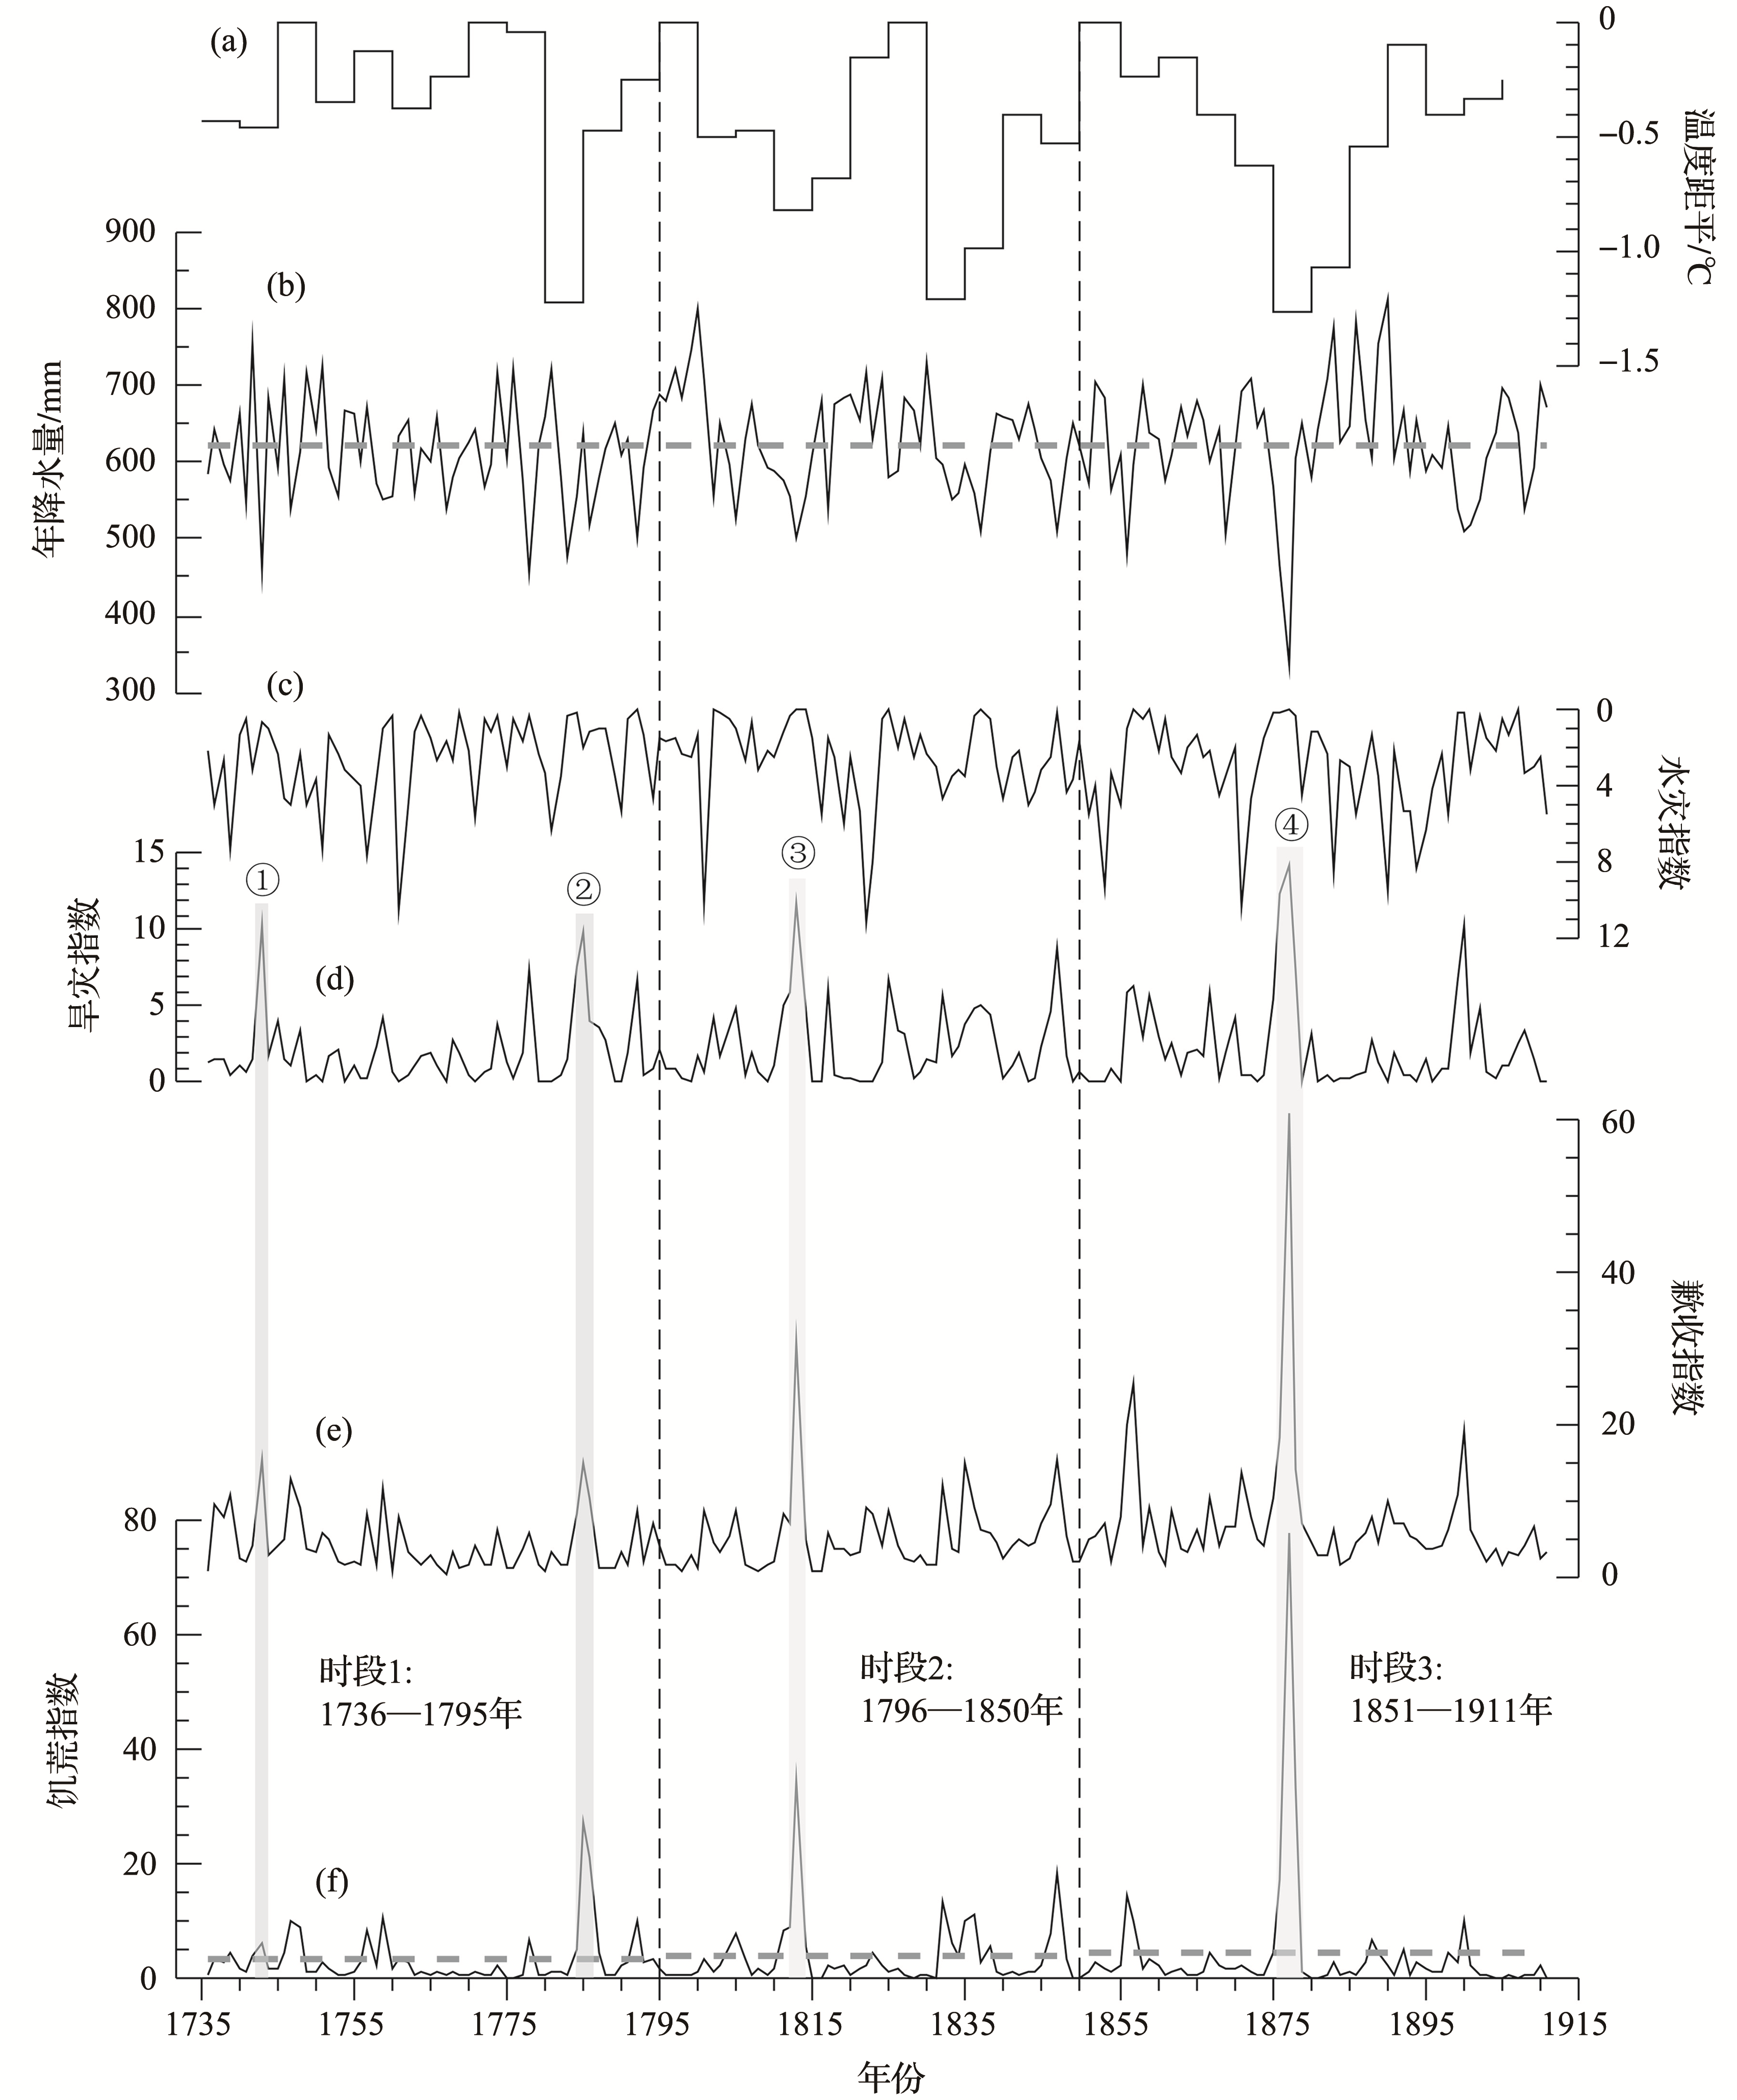
| 图1 1736—1911年华北的气候变化、水旱灾害、粮食收成与饥荒指数序列 (a) 华北冬半年冬温距平(分辨率5年)[ |
| Fig.1 Annual famine index and its relationship with climate change, flood/drought, harvest in North China from 1736 to 1911 (a) 5-year temperature anomaly of winter half year in North China[ |
|
|