碎屑锆石U-Pb年代学数据获取、分析与比较
Review in Detrital Zircon U-Pb Geochronology: Data Acquisition, Analysis and Comparison
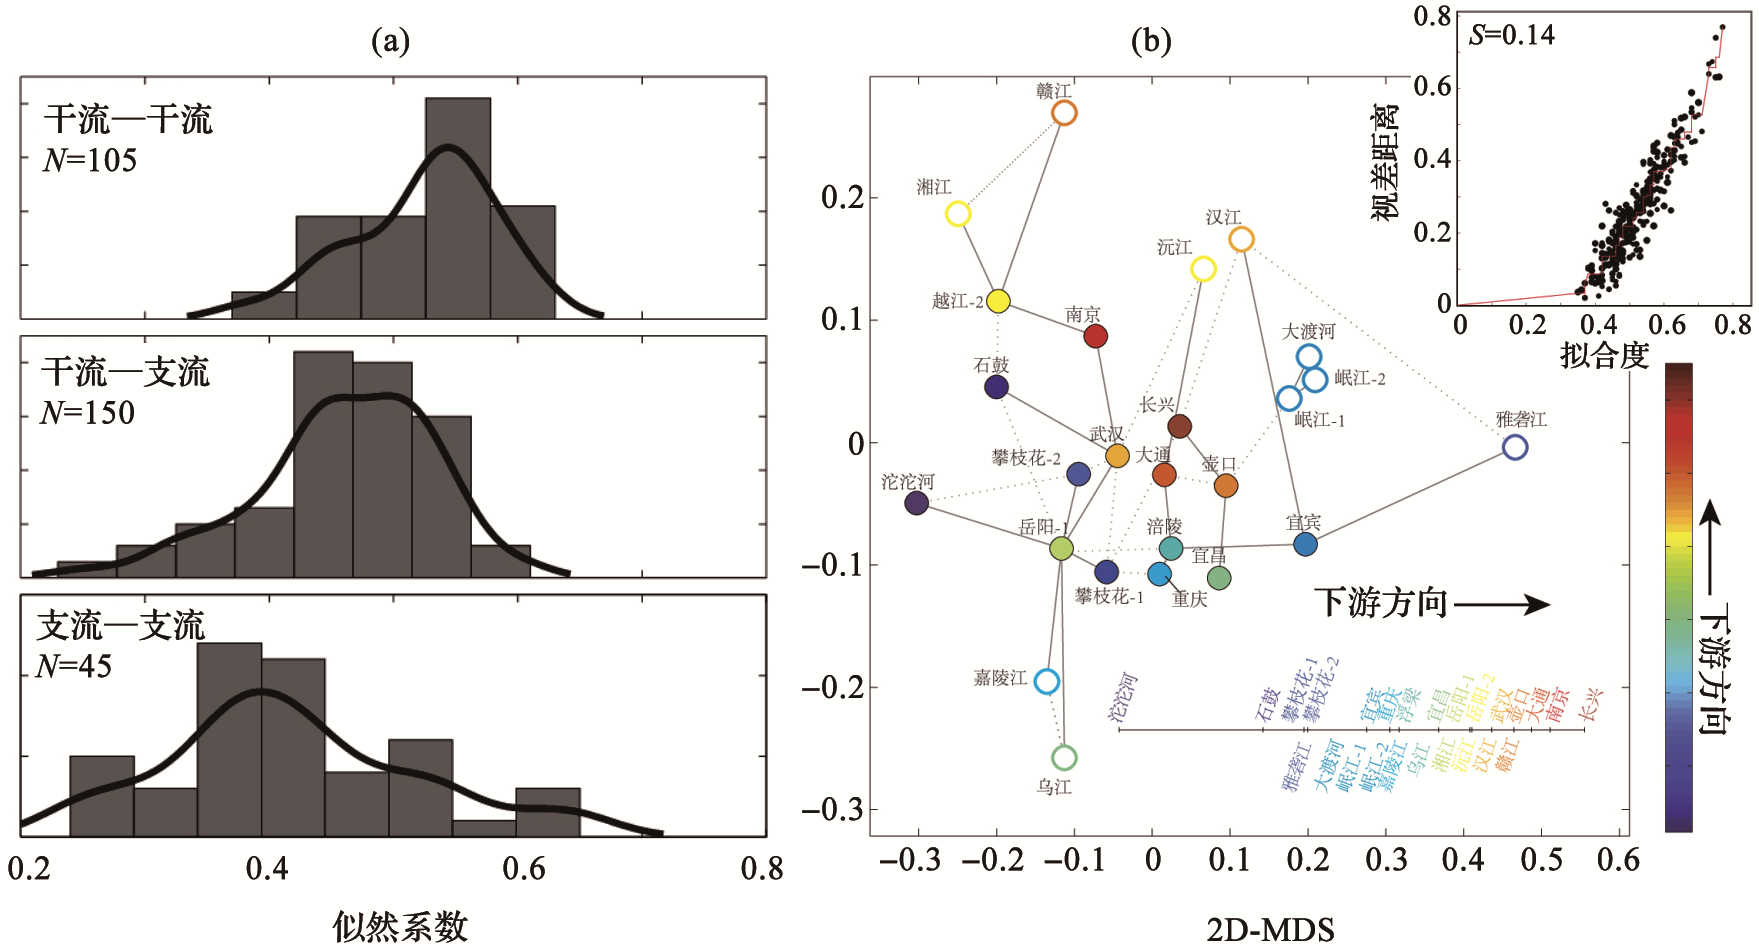
(a)使用似然系数量化:干流—干流、干流—支流和支流—支流的样品间比较,N表示每个直方图的比较次数,似然系数值越高表示两两比较之间的相似性越高;(b)非度量MDS图(主图)和谢帕德图(插图);主干河流样本以填充色表示,较温暖的颜色(红橙黄)表示较下游的采样;支流边缘的颜色表示下游的位置,实线和虚线分别表示最邻近和次邻近的两个样品
(a) Using the likeness comparison metric: Compare intersample of trunk-to-trunk, trunk-to-tributary, and tributary-to-tributary. N equals the number of comparisons per histogram. Higher values indicate higher similarity between pairwise comparisons. (b)The nonmetric MDS (main) and Shepard plot (inset). Trunk stream samples are given as filled colors, with warmer colors (red-orange-yellow) indicating farther downstream sampling; Tributary edge colors indicate downstream location. Solid and dashed lines indicate the closest neighbors and second closest neighbors in likeness, respectively