碎屑锆石U-Pb年代学数据获取、分析与比较
Review in Detrital Zircon U-Pb Geochronology: Data Acquisition, Analysis and Comparison
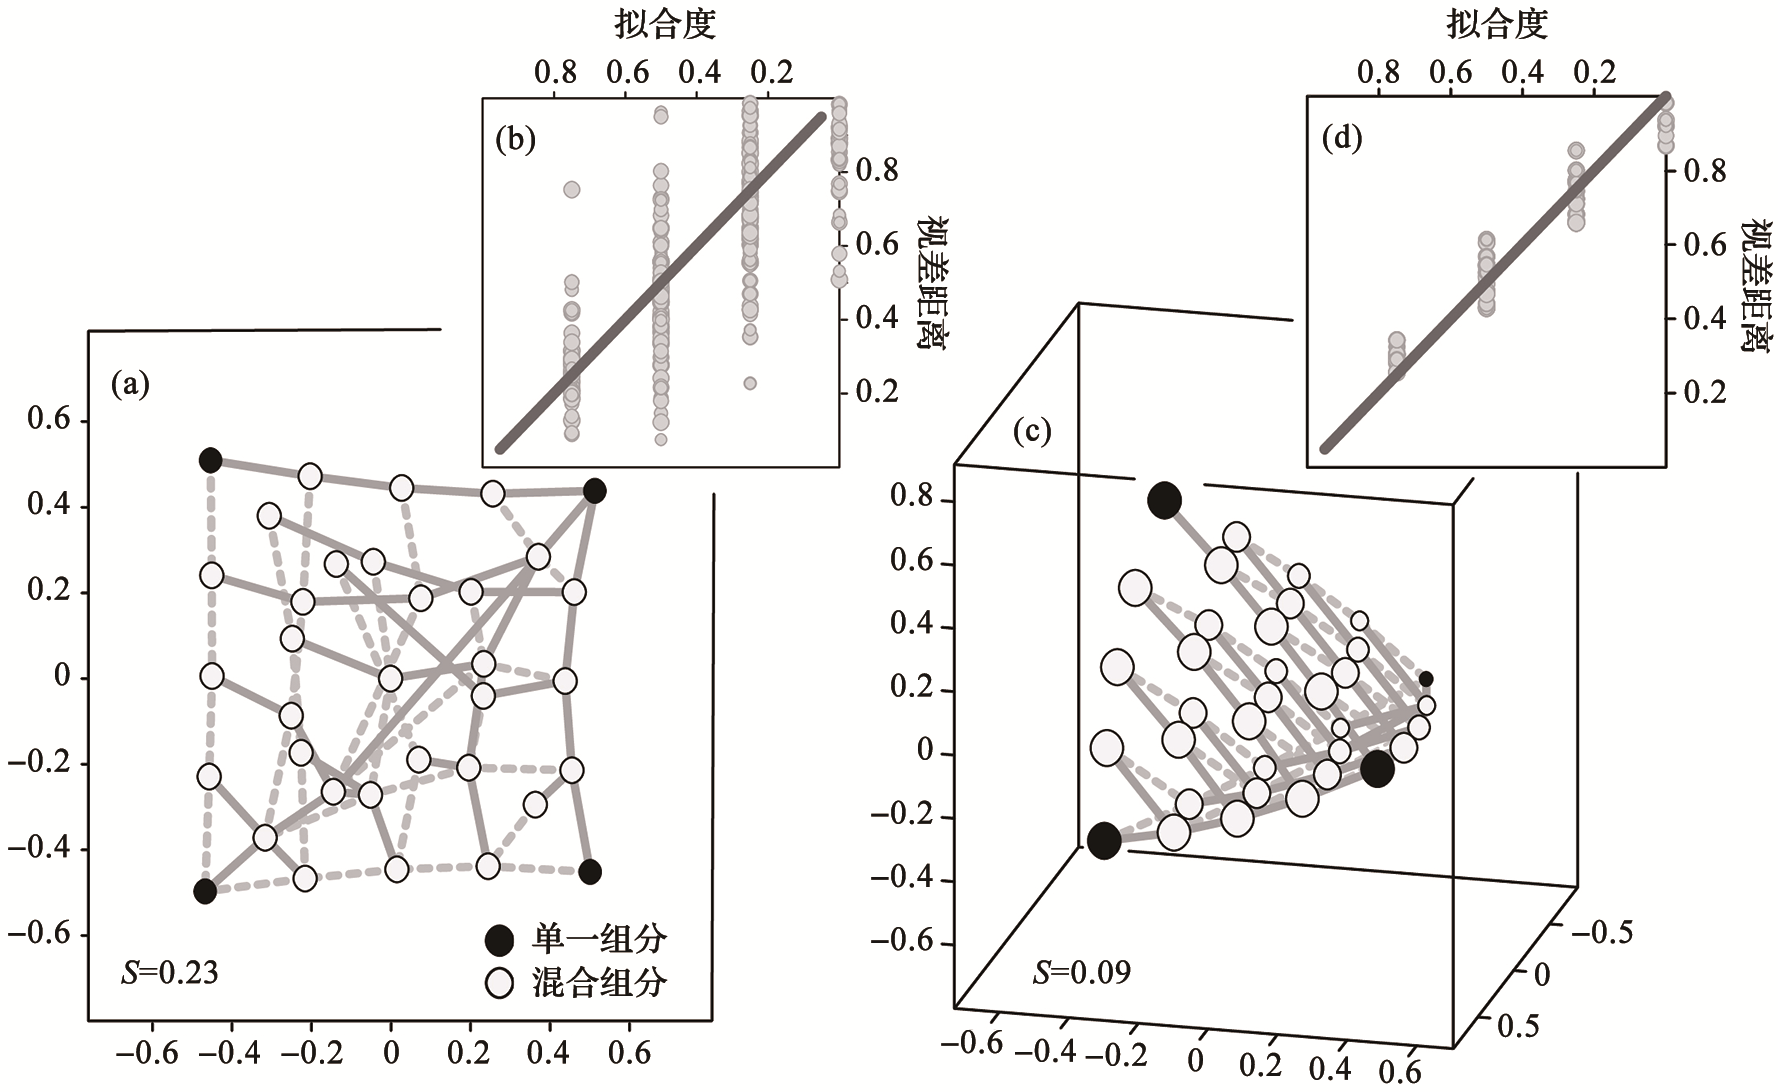
(a)2D-MDS图,其中灰色的实线和虚线连接的点表示最相似的和次相似的样品;(b)2D-MDS的谢帕德图,点位分散说明样品间差异与转换结果之间的线性关系差;(c)3D-MDS(圆圈的大小仅用于增强视觉效果);(d)3D-MDS的谢帕德图,点位相对集中1∶1线附近,改进后的拟合结果验证了增加的维数在解决样品差异方面的价值(据参考文献[58]修改)
(a) Two-dimensional MDS solid and dashed gray lines = nearest and next-nearest neighbors; (b) Shepard plot for two-dimensional MDS, The poor linearity between dissimilarities and distances indicates poor translation of the dissimilarity matrix; (c) Three-dimensional MDS (circle sizes are scaled to reflect distance of the circle from point of view of viewer, smaller is more distant); (d) Shepard plot for three-dimensional MDS. Points are relatively concentrated around the 1∶1 line. The improved fit demonstrates the value of the added dimension in resolving sample difference(modified after reference [58] )