水下沉积物重力流与海底扇相模式研究进展
Review on Subaqueous Sediment Gravity Flow and Submarine Fan
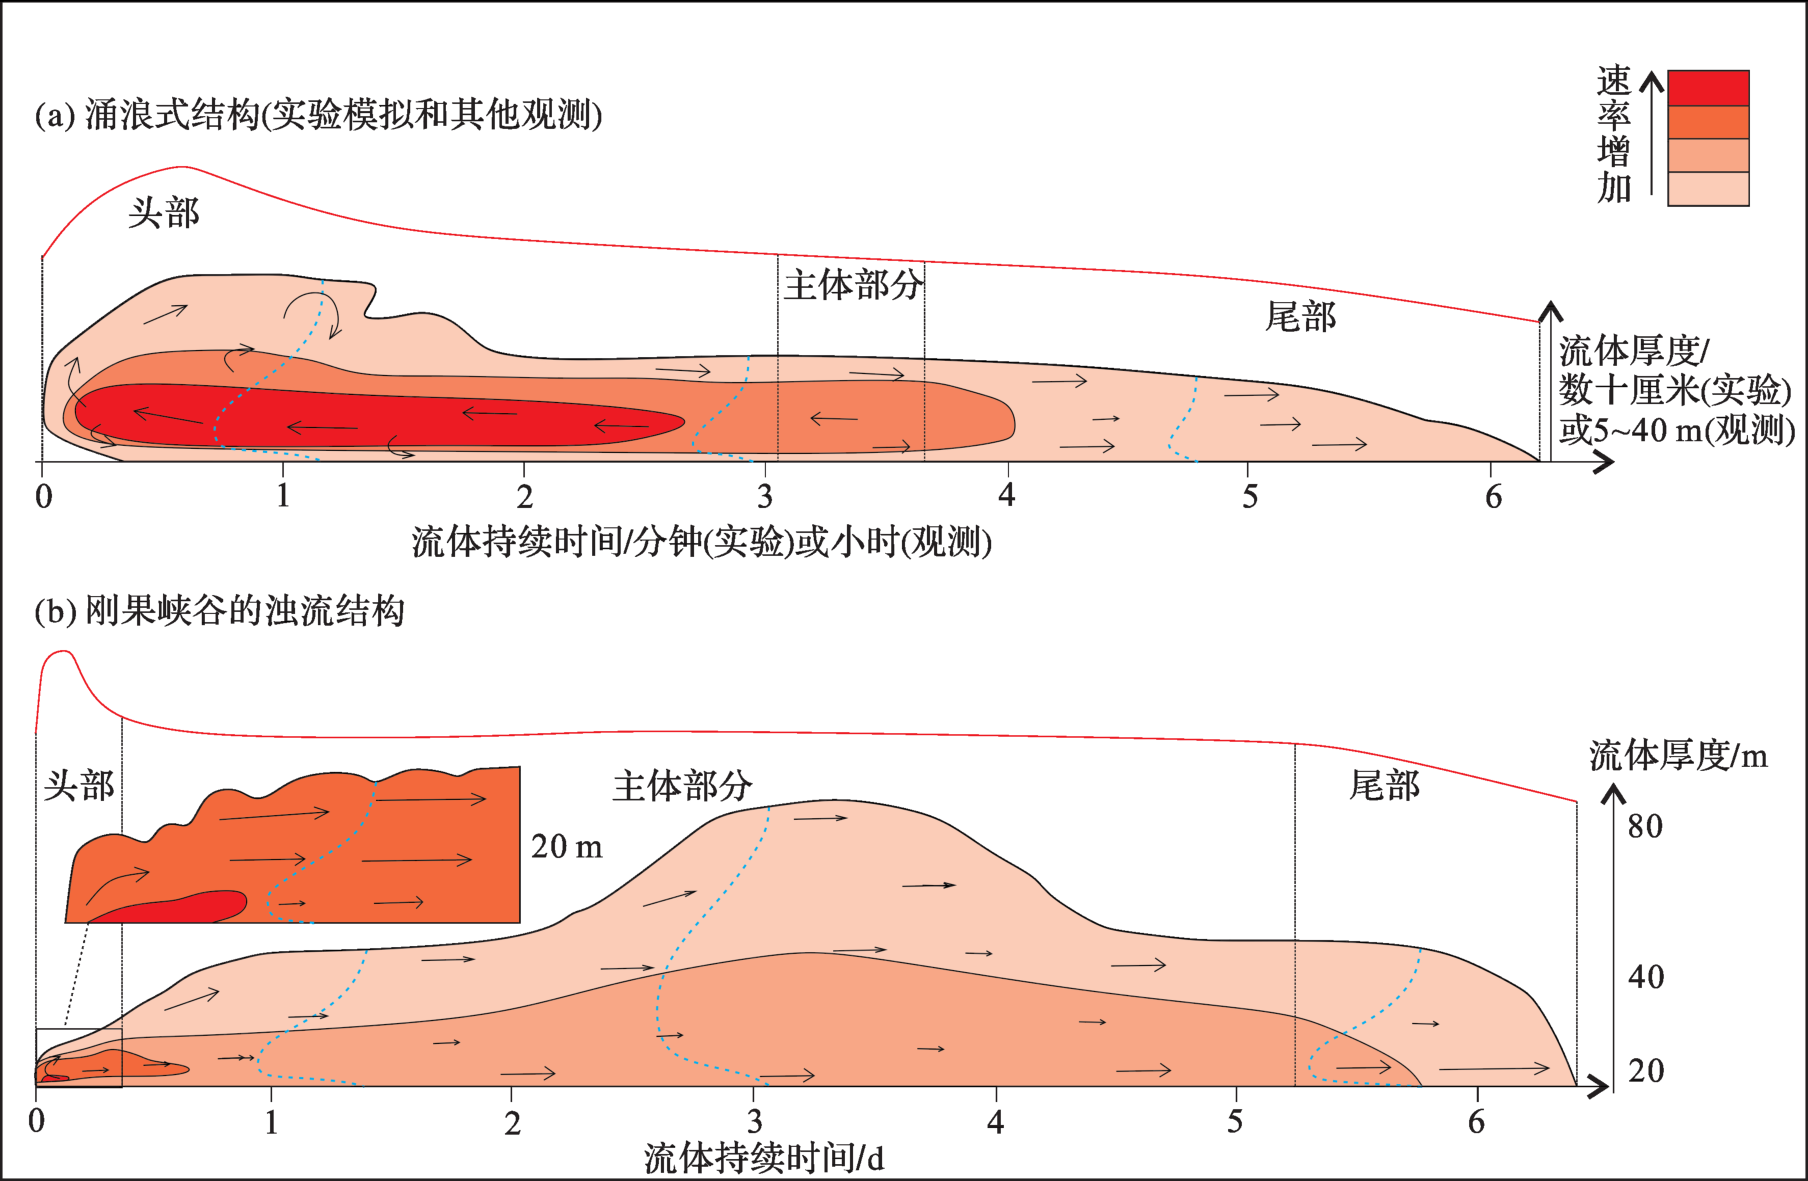
(a) 实验模拟的涌浪式浊流结构,头部大而慢;(b) 刚果峡谷的浊流结构,头部小而快;红色实线指示流体最大速率,蓝色虚线指示流体某一时刻的垂向速率剖面,箭头指示流体相对前缘的运动方向,箭头越长速率越小
(a) Surge-like turbidity current in the typical laboratory experiment with a big and slow head; (b) Turbidity current in the Congo Canyon with a small and fast head. Temporal changes in maximum flow velocity are shown by red lines, and velocity profile shapes are shown by blue dotted lines, arrows denote relative movement of sediment-laden fluid with respect to the flow front