微波雷达双边滤波云检测新方法的研究
葛觐铭( ),胡晓宇,王晨,董自香,杜佳璟
),胡晓宇,王晨,董自香,杜佳璟
A Novel Bilateral Filter Hydrometeor Detection Method for Microwave Radar
Jinming Ge(),Xiaoyu Hu,Chen Wang,Zixiang Dong,Jiajing Du
),Xiaoyu Hu,Chen Wang,Zixiang Dong,Jiajing Du
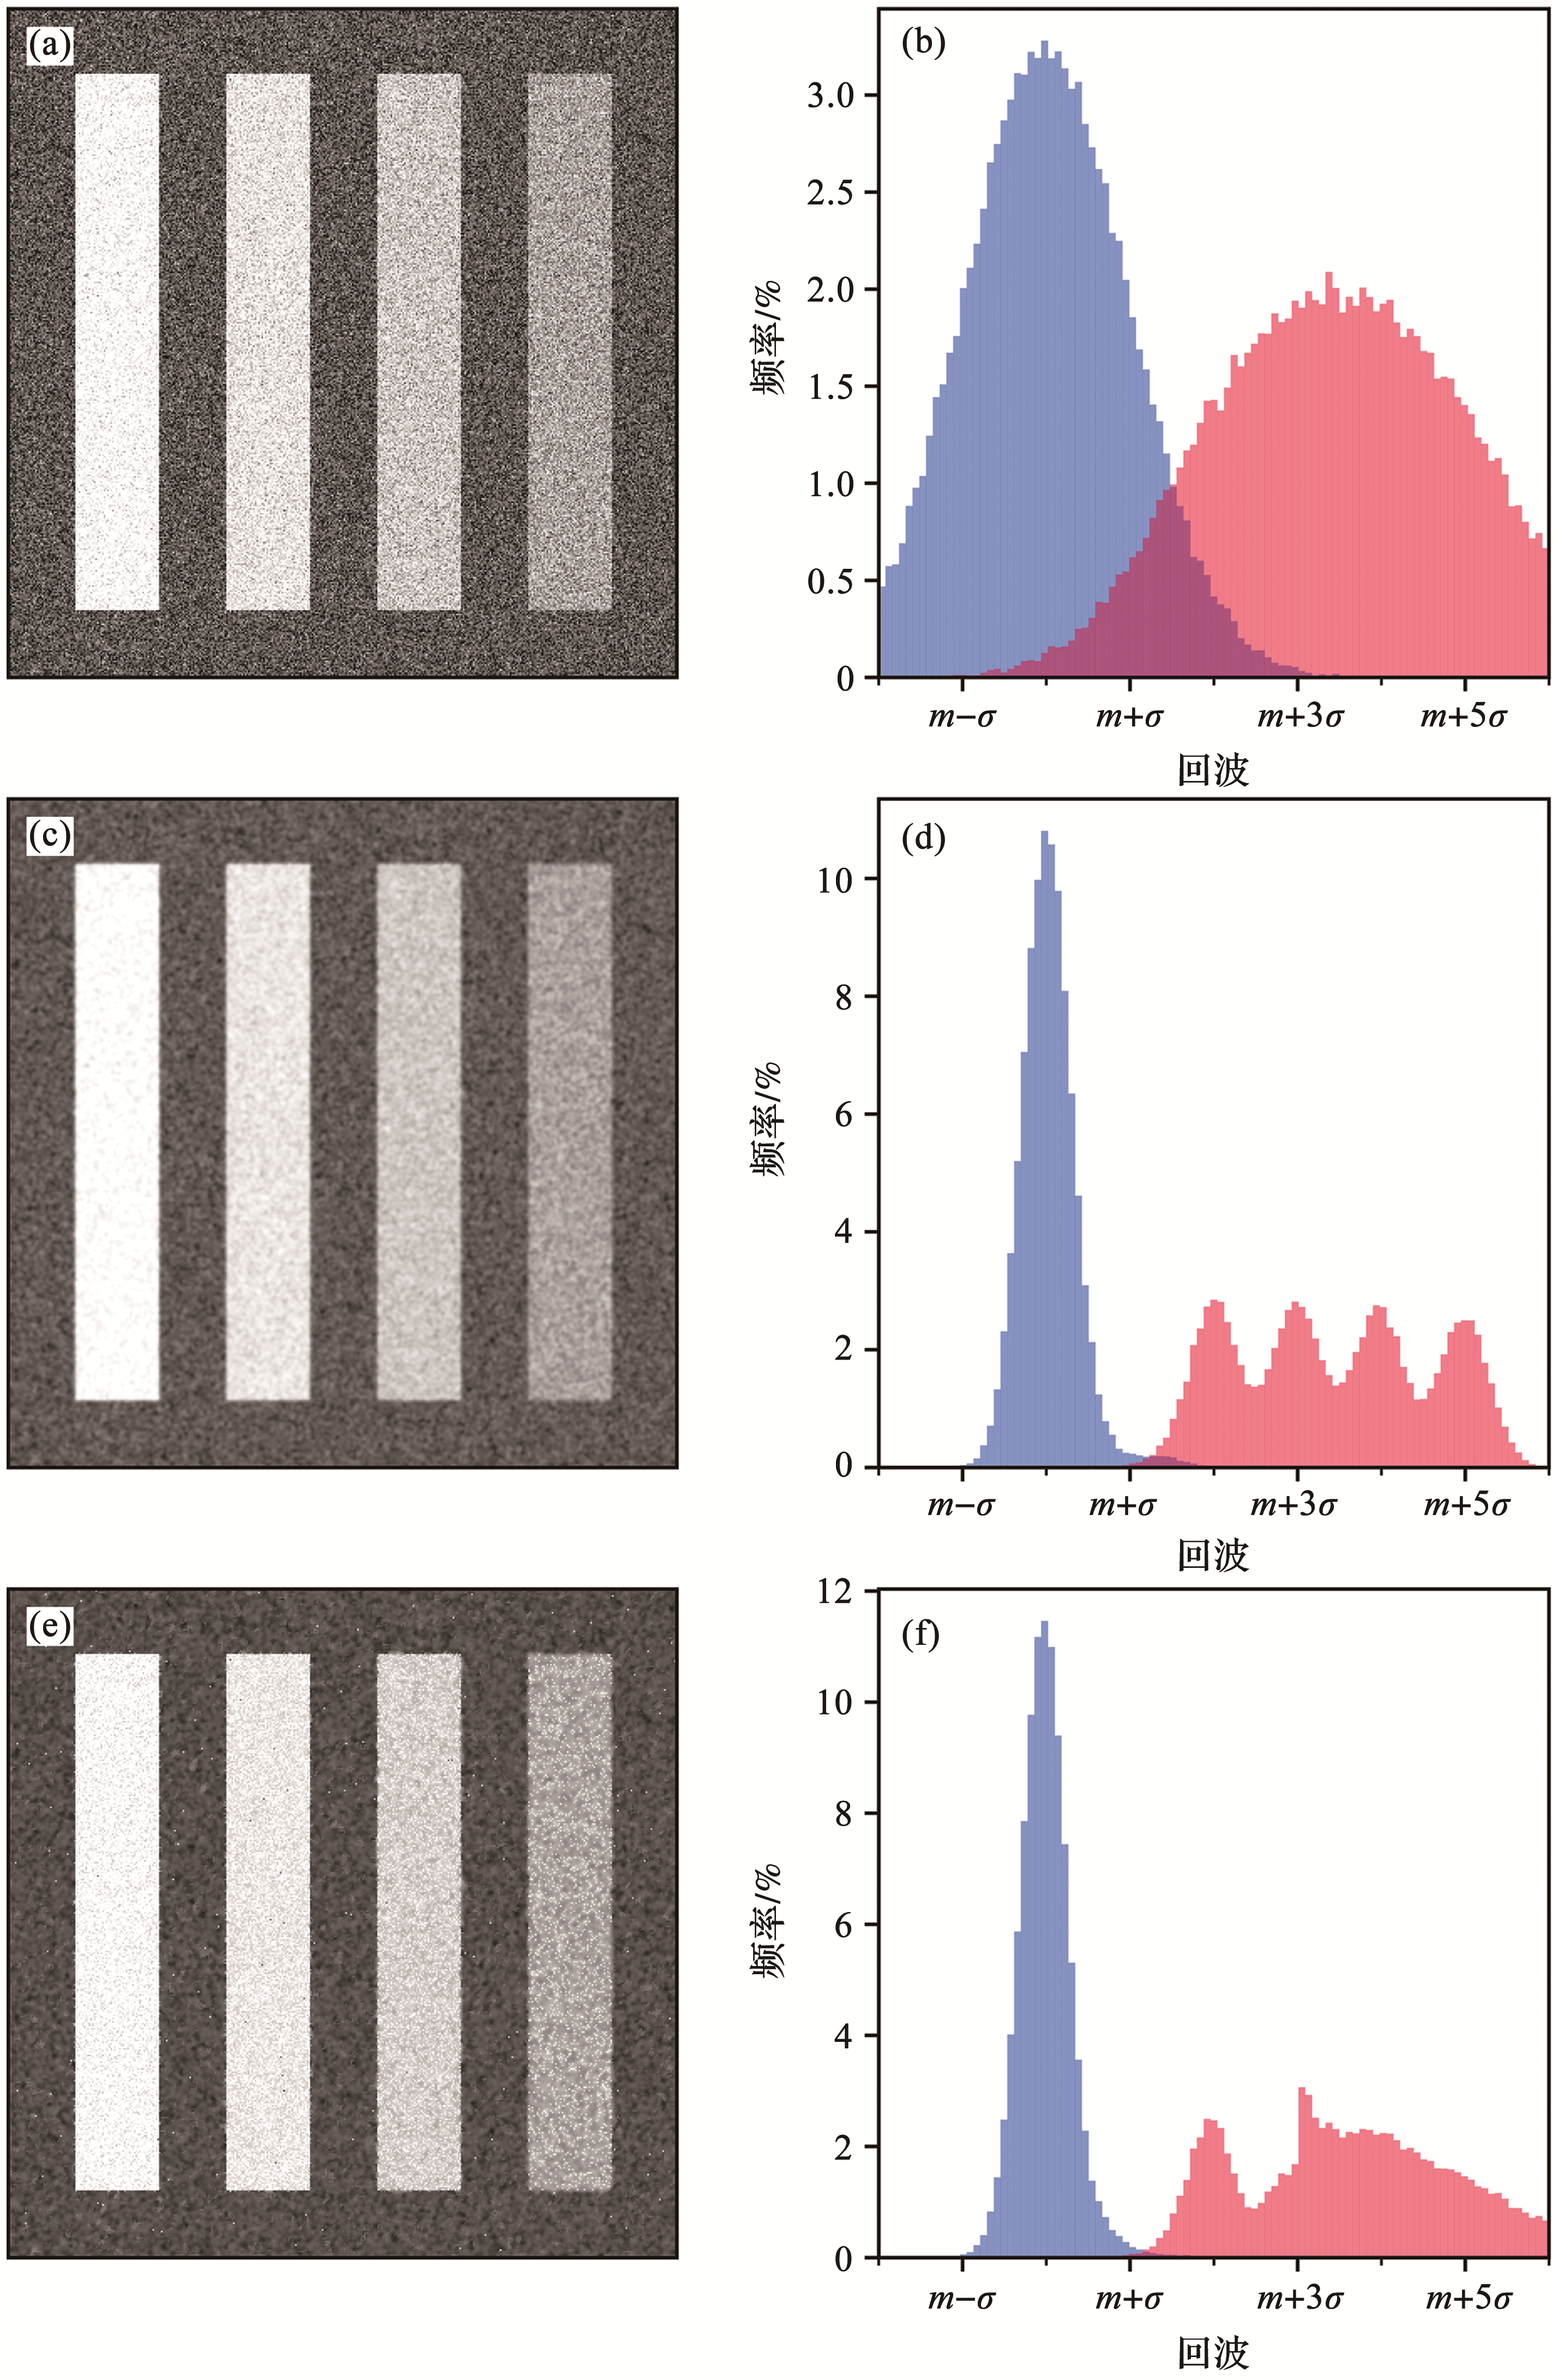
图2. 双边滤波模拟测试图
(a)不同强度目标原始回波;(b)图a的回波分布;(c)对图a进行高斯滤波后的回波;(d)图c的回波分布;(e)对图a进行双边滤波后的回波;(f)图e的回波分布;右列图中,蓝色表示噪声分布,红色表示信号分布;
Fig.2. Test of bilateral filter
(a) Raw echoes of different intensity targets; (b) Echo distribution of Fig.(a); (c) Echoes after Gaussian filter to Fig.(a); (d) Echo distribution of Fig.(c); (e) Echoes after bilateral filter to Fig.(a); (f) Echo distribution of Fig.(e); In the right panels,blue indicates the noise distribution and red indicates the signal distribution;