基于雷达与卫星的对流触发观测研究和临近预报技术进展
A Review of Radar- and Satellite-based Observational Studies and Nowcasting Techniques on Convection Initiation
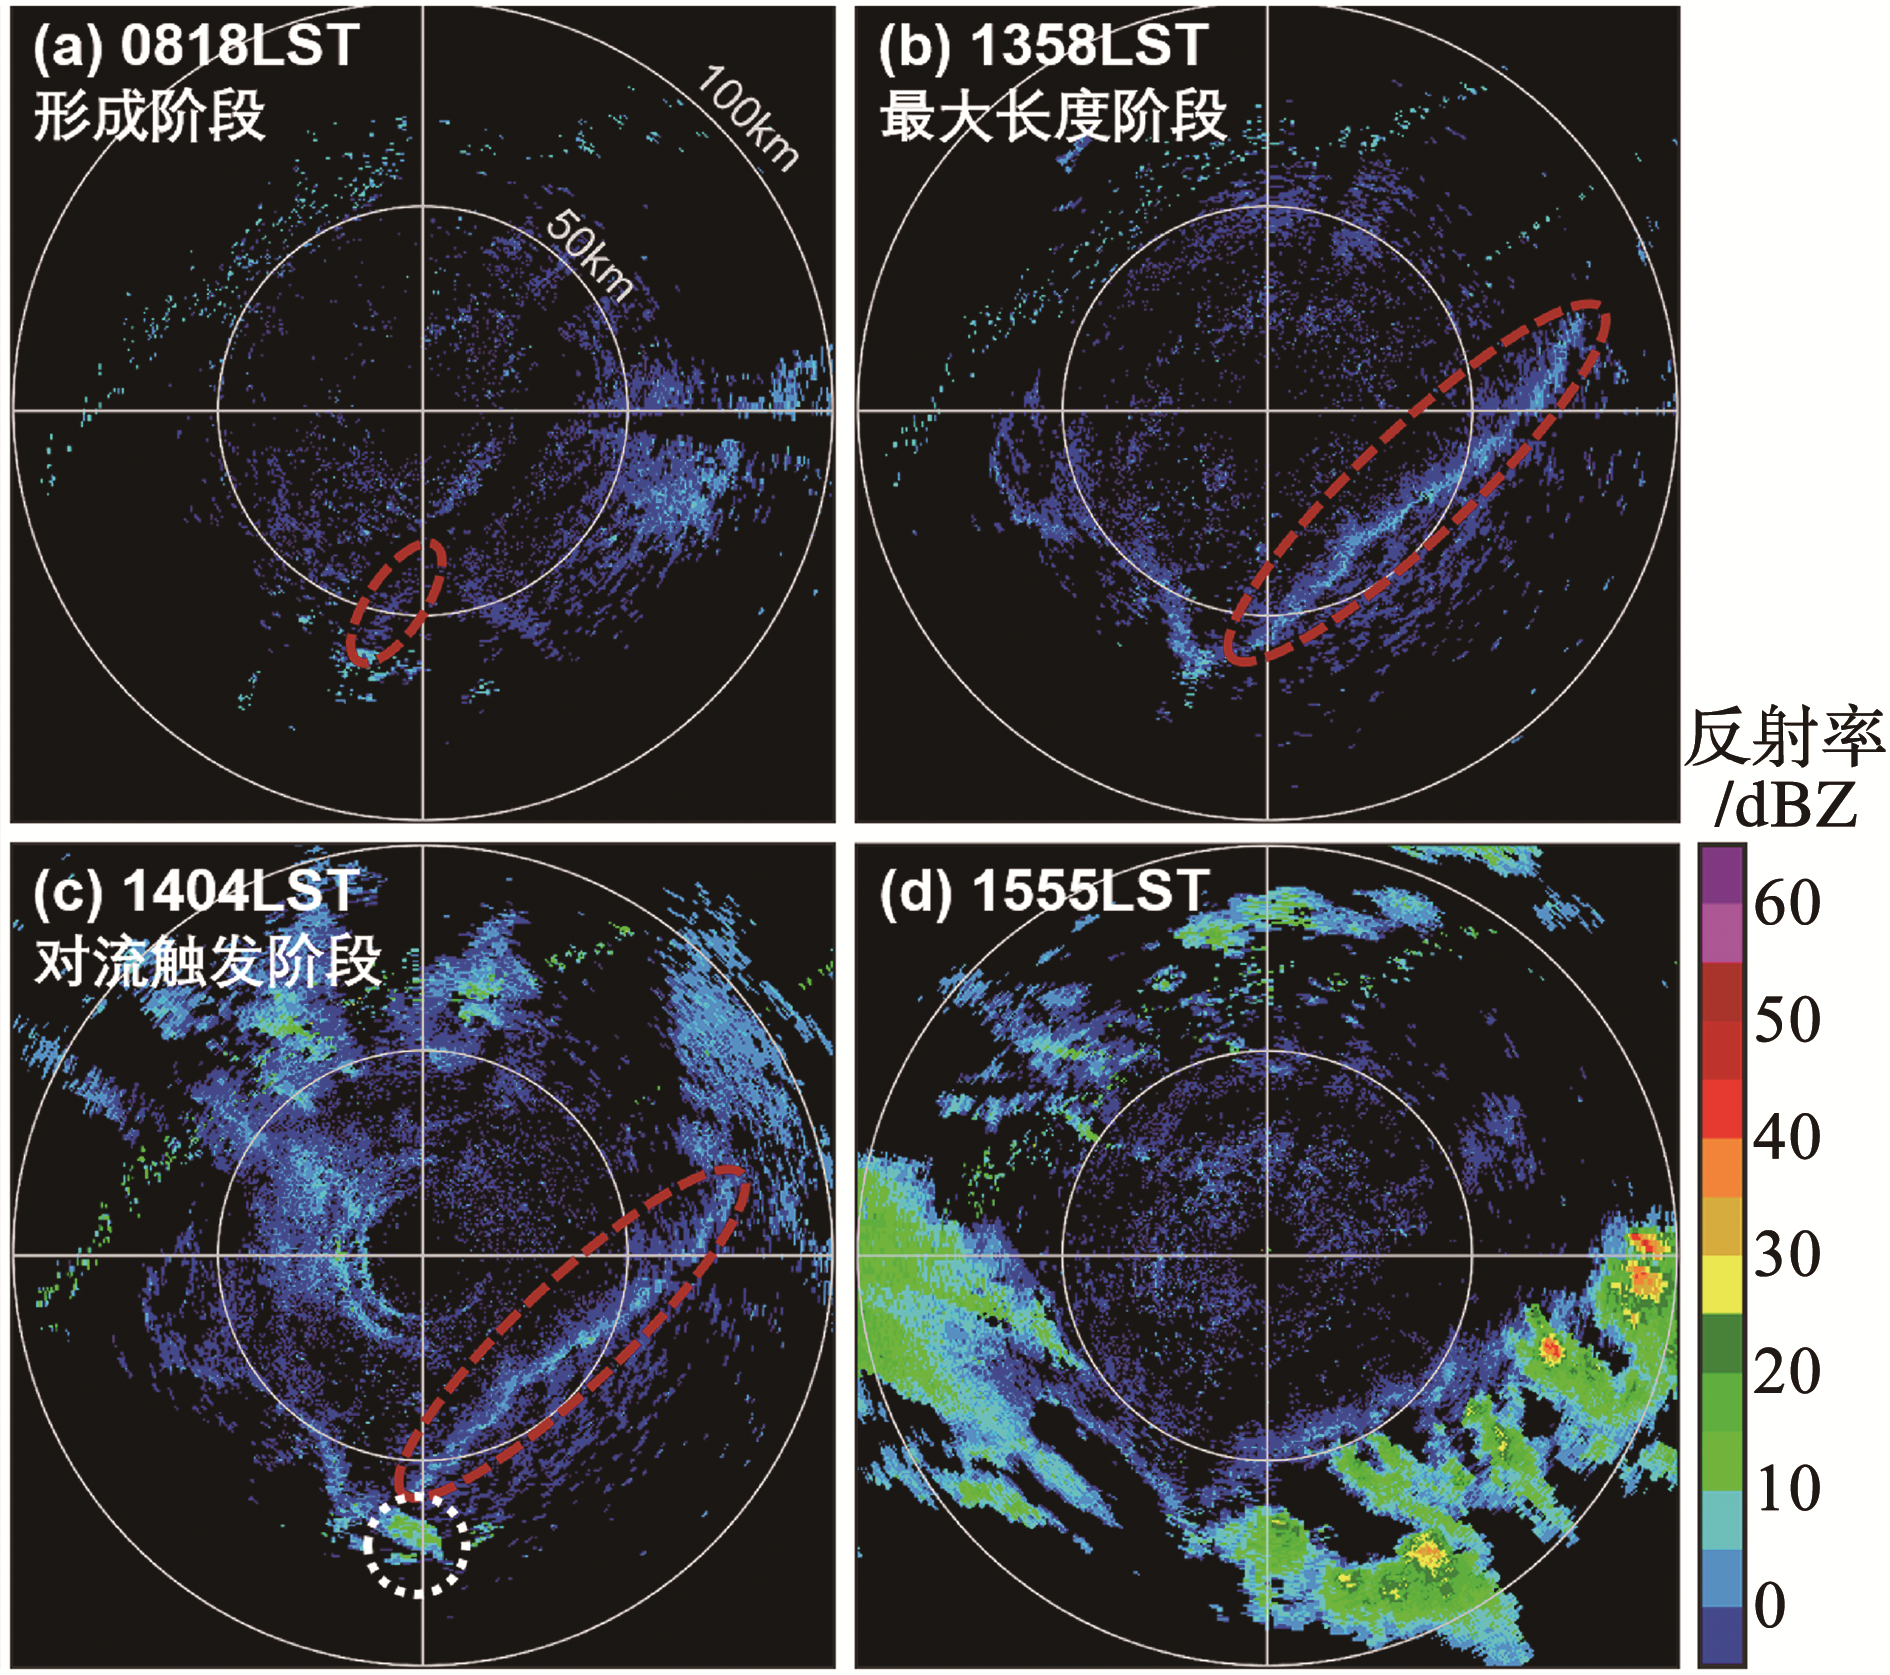
(a)0818 LST,形成阶段(起始10 km);(b)1358 LST,最大长度阶段;(c)1404 LST,对流触发阶段(首个大于等于10 dBZ回波);(d)1555 LST;图中红圈给出了辐合线位置,白圈给出了辐合线引发首个大于等于10 dBZ回波的位置;十字灰线交点为河套地区临河雷达站点位置;从内到外的灰色圆圈表示离雷达50 km和100 km的位置
The red circles in (a)~(c) highlight the boundary at its formation (first 10 km), maximum length, and convective initiation stages, respectively; The white circle in (c) highlights the first ≥10 dBZ echo of the first convective storm near the boundary; The central intersections denote the radar site, and the range rings are shown at 50 km intervals in gray