
易雪 , 李得勤, 赵春雨
Yi Xue, Zhao Chunyu, Shen Lidu
中图分类号: P463.1
文献标识码: A
文章编号: 1001-8166(2018)05-0517-15
通讯作者:
收稿日期: 2017-09-8
修回日期: 2017-12-25
网络出版日期: 2018-05-20
版权声明: 2018 地球科学进展 编辑部
基金资助:
作者简介:
First author:Yi Xue (1984-), female,Tieling City, Liaoning Province, Engineer. Research areas include land surface processes, data assimilation and climate simulation.E-mail:yi11xue@163.com
作者简介:易雪(1984-),女,辽宁铁岭人,工程师,主要从事陆面过程、数据同化和气候模拟研究.E-mail:yi11xue@163.com
展开
摘要
利用分析Nudging方法,选取辽宁省2015年7月和10月作为夏季和秋季代表月份,开展不同分辨率嵌套网格上的分析同化试验,研究在不同分辨率的嵌套网格上使用分析Nudging对地面要素降尺度模拟的影响。结果表明,采用分析Nudging后,可以明显减小WRF模式模拟高空要素与大尺度背景场的差异,使模式在长时间的积分过程中能够与大尺度背景场保持很好的一致性,且在12 km和4 km分辨率上均采用分析Nudging相对于仅在36 km分辨率嵌套上采用分析Nudging效果更好。对于地面要素影响方面,不同分辨率嵌套网格采用分析Nudging相对于控制试验均可以提高地面2 m温度、相对湿度、10 m风速和降水的模拟准确度。总体来看,分析Nudging应用于12 km分辨率上的降尺度效果整体最优,当进一步在4 km分辨率嵌套上使用分析Nudging后,反而使得模式对温度、降水的模拟变差,说明在区域气候降尺度中,考虑大尺度背景场本身的分辨率,不宜在高分辨率嵌套网格上进一步采用分析Nudging。
关键词:
Abstract
Analysis Nudging in different resolution domains was adopted for dynamic downscaling, and the result of two typical months of July and October, 2015, which represented summer and autumn, was evaluated in Liaoning Province of China. Results showed that significant improvement was present in large-scale background with AN in WRF, such as geopotential height at 500 hPa and relative humidity at 925 hPa. According to the characteristics of error between simulated and observation of surface variables, including temperature and relative humidity at 2 m, wind speed at 10 m and precipitation, it also showed that analysis nudging at 12 km and 4 km resolution was more effective than at 36 km. However, after using analysis nudging at 4 km, there was no improvement of the precision of surface variables anymore, and the surface temperature and precipitation were even worse than using nudging at 12 km grid. This suggested that, according to the resolution of background filed, nudging in high resolution grid was ineffective after using analysis nudging at the relatively coarse model grid.
Keywords:
区域气候降尺度一般指使用区域气候模式以全球模式预报数据或者再分析数据为初始和侧边界条件,在一定区域上将全球模式输出数据降尺度到更高的空间和时间分辨率上,并以此建立区域气候数据集[1,2,3,4,5,6]。借助于区域气候模式中的动力方程、参数化方案和更高分辨率的下垫面信息,降尺度后的区域气候场更能反映局地的天气和气候特征,建立的区域气候数据集在气候评价、大型工程建设实施、气候可行性论证和城市规划等行业有着广泛的应用价值。但是,直接使用全球再分析数据驱动区域气候模式时,随着模式的连续积分,往往会出现模拟结果逐渐偏离全球模式大尺度背景场的情况[7,8]。此外,即使相同的大尺度环流场,由于区域气候模式中所使用的参数化方案或模式配置的差异,得到的区域气候场也可能存在一定的差异,这种差异还可能与模式运行的区域大小、所计算的地理位置和季节等有关[9,10,11,12]。
针对区域气候模式在积分过程中逐渐偏离大尺度背景场的问题,如何使得区域气候模式能够提高区域气候场分辨率的同时,容许区域气候模式中的中小尺度天气信息在大尺度环流场上被激发出来,并保证区域气候模式模拟不偏离大尺度环流场是区域气候降尺度的最大挑战。为此,Davies[13]首次提出在模式侧边界上增加松弛的方法,随着该方法的不断发展,逐渐演变成目前常见的2种重要的松弛方法:分析Nudging方法(也称为格点Nudging)[14]和谱Nudging方法[7,15]。分析Nudging和谱Nudging目前被认为是2种连续气候降尺度的主要方法,两者均采取在模式方程上加入特定的项来对模式积分过程进行约束,比如在动力和热力学方程上添加额外项[7,12]。除上述2种方法以外,重新初始化方法由于执行起来相对比较简单,一些研究和应用证实重新初始化方法在区域气候降尺度中也能取得较好的应用效果[16,17]。Lo等[16]对比了采用连续积分、分析Nudging和重新初始化降尺度方案对降尺度的影响,得到重新初始化降尺度得到的气候场较直接连续积分的结果好,但是相对于采用分析Nudging方法,由于在执行中需要不断打断模式运行,产生的降尺度结果存在不连续的问题。
分析Nudging是在诊断方程中加入一个时间上的松弛项(也叫Nudging强度)[18,19,20]来达到对模式积分过程的约束,松弛项根据分析场和预报场上的偏差以反比例的指数形式在时间上调整模式状态,从而使得模式积分过程中向着强迫场逼近。在WRF模式(Weather Research and Forecasting Model)中,分析Nudging被应用在u和v分量、位温和水汽混合比上。同时,分析Nudging能够限制在边界层以上或者边界层中,这使得区域气候模拟容许通过区域气候模式在大尺度环流作为强迫的背景下,在PBL(Planetary Boundary Layer)里面激发中尺度的强迫信息。一些研究认为分析Nudging一般应用在输入场不是特别高于要降尺度的分辨率,即2种分辨率比较接近的情况下能够取得更好的降尺度效果[21,22],Bullock等[23]研究认为,当分析Nudging应用在12 km分辨率上可以提高降水和温度的模拟精度,但也有研究指出分析Nudging在小尺度的信息约束上偏强[10]。
由于区域气候模拟计算的空间分辨率较高,所需要的计算机资源往往较多,多重动力降尺度[24,25]经常被用在区域气候降尺度中,Nudging降尺度方案在不同分辨率网格上使用对降尺度结果的影响仍然没有很好的认识。一些研究认为当Nudging应用于内外两层网格的方案要优于仅在最外层网格使用Nudging方案[22,26],也有研究认为当使用嵌套网格时,一般建议在子区域不做分析Nudging,除非子区域的分辨率和输入的再分析资料精度相差不大。现有的分析Nudging一般应用在较低分辨率的嵌套网格上,且应用分析Nudging的分辨率一般为10~36 km[22,26,27]。故本文基于WRF模式,采用分析Nudging方法,对CFSR(Climate Forecast System Reanalysis)资料开展多层嵌套的高分辨率降尺度试验,重点验证不同分辨率嵌套分析Nudging方案降尺度后对地面要素模拟的影响,为区域气候数据集的制作提供一定的技术支撑。
WRF模式是由美国国家大气研究中心(National Center for Atmospheric Research,NCAR)和美国国家环境预报中心(National Center for Environmental Prediction,NCEP)等科研机构共同开发的中尺度预报模式[28],随着该模式的不断发展,不仅可以用于中尺度天气过程的预报和模拟,在区域气候模拟和研究中也有着广泛的应用。本文使用WRFV3.5.1开展区域气候场的降尺度方法研究,采用3层嵌套网格,模式中心位置的经纬度为116.0°E,42.0°N,3层嵌套水平分辨率分别为36,12和4 km,对应第一层的网格数为160×150,第二层的网格数为184×220,第三层的网格数为169×169,其中第一层区域包含中国大部区域及蒙古国和俄罗斯的部分区域,第二层区域包含中国东北区域,第三层区域为辽宁省范围,图1为国家测绘地理信息局的中国标准地图,在此图基础上给出了WRF模式第一层(D1)、第二层(D2)嵌套中国范围内的区域和第三层(D3)嵌套区域。模式垂直分层为51层,顶层气压为10 hPa。
参数化方案的设置方面,参考以往的区域气候降尺度研究工作中的参数化方案的设置,这里使用WSM3(WRF Single-Moment-3class)微物理过程参数化方案、RRTM(Rapid Radiative Transfer Model)长波辐射方案、Dudhia短波辐射方案、YSU(Yonsei University)行星边界层方案、Noah(National Center for Environmental Prediction, Oregon State University, Air Force, and Hydrology Lab model)陆面过程参数化方案和Kain-Fritsch积云对流参数化方案。为了提供更加准确和动态的表面信息,使用时间变化的海表温度、植被覆盖度和反照率等数据。
初始场及侧边界场使用了NCEP的第三代气候预报系统提供的再分析数据CFSR,包括CFSR-surface和CFSR-pressure每天00时、06时、12时和18时这4个时刻的再分析数据,其中地面数据CFSR-surface的空间分辨率为0.205°×0.204°,高空数据CFSR-pressure的空间分辨率为0.5°×0.5°,较第二代再分析资料具有更高的水平和垂直分辨率。CFSR全球再分析资料的主要特点为耦合了新的海洋模式,增加了新的海冰模式,同化了历史卫星遥感辐射资料,陆面模式采用Noah陆面模式,在辐射的参数化方案中考虑了二氧化碳和气溶胶等的变化。针对CFSR数据在东亚以及我国不同区域的适用性评估发现,该资料对于东亚平均风的模拟基本与其他现有的再分析资料保持一致,但在日变化上存在一定的差异[29]。CFSR资料对我国新疆夏季降水时空分布具有较好的反映[30],但也有研究指出CFSR资料对强降水月份存在高估的情况[31]。CFSR资料对我国夏季对流层中高层位势高度和温度具有较好的代表性,对绝对湿度和纬向风存在弱的偏差[32]。
分析Nudging是一种动力张弛方法,通过添加诊断方程或者人工的倾斜项使得模式向着观测逼近,分析Nudging的表达式为[33]:
式中:α为模式模拟变量;p*为气压权重项;等式左边一项表示模式变量α针对气压的倾向项,等式右边第一项表示模式物理强迫项,x表示独立的空间变量,t表示时间;Gα表示Nudging系数为时间的倒数,Bowden等[22]发现降低Nudging系数将会增加模拟与观测的偏差,而Nudging系数加强将会过分强迫模拟值趋近观测值[33],故本文采用模式默认值Gα=3×10⁻⁴ s-1;Wα表示四维的权重函数;εα为分析质量因子,根据产生格点分析值的质量和分布来取值,取值范围为0~1;
受计算成本的影响,结合本文主要研究目的为确定最优的分析Nudging降尺度方案,这里选择了2015年夏季和秋季的代表月份7月和10月开展降尺度模拟试验,考虑模式初始积分的平衡和稳定性,将6月28日00时至6月30日23时和9月28日00时至9月30日23时分别作为模式7月和10月的spin-up时间,而7月1日00时至7月31日23时和10月1日00时至10月31日23时为模式的降尺度和检验时段。本文设计4组试验来探究不同嵌套网格上使用分析Nudging对降尺度的影响。具体为:①控制试验(Control,CTL),即不采用分析Nudging同化大尺度背景场;②只在第一层36 km分辨率的嵌套网格上采用分析Nudging(Analysis Nudging1,AN1);③在第一层36 km和第二层12 km分辨率的嵌套网格上采用分析Nudging(Analysis Nudging2,AN2);④在AN2的基础上,对第三层嵌套4 km分辨率的网格上也采用分析Nudging(Analysis Nudging3,AN3)。
为了检验4组降尺度方案对地面气象要素模拟的准确性,使用辽宁省61个国家级观测站的逐小时降水、温度、相对湿度和风速来检验模式降尺度的结果。首先将4组试验4 km分辨率的降尺度结果插值到61个国家级气象观测站,然后分析观测和模拟结果之间的均方根误差(Root-Mean-Square Error,RMSE)、平均偏差(Mean Bias,MB)、相关系数(r)统计指标来评估不同降尺度方案的模拟结果。各统计量的表达式如下:
式中:n为所有的观测时次,Pi代表模式降尺度的第i个时次的地面要素的模拟值,Oi代表对应的第i个时次地面要素的观测值,
图2给出了2015年7月和10月的第一层嵌套CFSR资料月平均500 hPa位势高度和850 hPa水平风的叠加图,2015年7月500 hPa平均高度场(图2a)高空槽分裂成2个,一个偏东北在50°N,130°E附近,一个偏南在40°N,120°E附近,正好我国辽宁省位于2个系统之间;10月500 hPa平均高度场(图2b)表现为高空脊和高空槽,我国辽宁省位于高空脊前槽后,主要受冷空气影响。2015年7月850 hPa平均风场(图2a),最主要表现为强的西南季风环流和西太平洋上强大的反气旋环流,辽宁省主要受局地反气旋影响,2015年10月(图2b)850 hPa平均风场表现为强的西风气流,辽宁省受西北风影响。
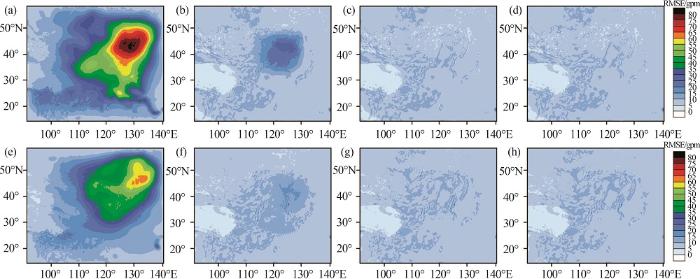
为研究不同嵌套分辨率网格上使用分析Nudging对大尺度环流模拟的影响,图3为3组Nudging试验和控制试验降尺度到36 km后的500 hPa位势高度与CFSR资料的RMSE。由图3a,e可以看出, 控制试验降尺度得到的第一层嵌套36 km分辨率范围内的500 hPa位势高度在大部分区域与CFSR资料的RMSE较大,结合图2a可以看出,控制试验7月500 hPa高度场的RMSE值在偏北高空槽附近高达80 gpm以上(图3a)。同样,10月500 hPa高度场的最大RMSE值出现在高空槽附近,这说明模式在连续积分过程中产生的误差与天气系统有着很好的对应关系。从图3采用分析Nudging降尺度得到的7月和10月的500 hPa高度上的位势高度与CFSR资料的RMSE值可以看出,3种Nudging方案均可以有效同化吸收大尺度的背景场信息,使得模式在连续积分过程中与大尺度的高度场保持很好的一致性。7月AN2和AN3降尺度后得到的500 hPa高度上的位势高度与CFSR资料的平均RMSE值为7.442和7.436 gpm,10月为7.991和7.999 gpm,而AN1在7月和10月分别为8.805和8.438 gpm,CTL在7月和10月分别为25.893和20.147 gpm,由此可以看出AN2和AN3相对于CTL和AN1与大尺度环流场更加吻合。因此,虽然高度场并不是直接同化的量,但随着模式同化风场、位温和水汽混合比后,使得模式模拟位势高度场协调后整体与CFSR大尺度背景场保持很好的一致。
图2 2015年7月(a)、10月(b)CFSR资料500 hPa平均位势高度(dagpm)和850 hPa平均水平风(m/s)
Fig.2 The average geopotential height (unit: dagpm) at 500 hPa and average horizontal wind (unit:m/s) at 850 hPa of CFSR for (a)July ,(b)October in 2015 in the first domain
风场为直接同化的大尺度背景场要素,对比不同降尺度方案对7月和10月850 hPa高度上的风场模拟与CFSR的RMSE值后,发现在3种不同分辨率的嵌套网格上采用分析Nudging后均可有效降低850 hPa水平风与CFSR的RMSE值,尤其是AN2和AN3,大部分区域的RMSE值控制在1 m/s以内,但AN2与AN3二者之间差别相对较小。此外,从CTL对风场模拟与CFSR的RMSE结果还可以看出,这种均方根误差较大区域与环流系统也存在着明显的对应关系,主要表现在高空槽系统附近。
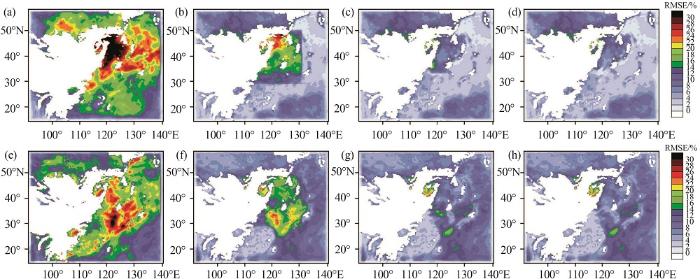
为了分析不同分辨率嵌套网格上采用分析Nudging方案对降尺度后湿度场的影响,同样分析了850和925 hPa高度层上的相对湿度。图4为不同的分析Nudging方案和控制试验降尺度得到的7月和10月的925 hPa高度上的相对湿度与CFSR的RMSE分布图。首先,可以看出7月和10月均表现出控制试验模拟的相对湿度与CFSR资料之间的RMSE值较大,且RMSE的大值区同样与东北地区的高空槽系统存在一定的对应关系。其次,不同分辨率嵌套网格上使用分析Nudging同化方案降尺度得到的7月和10月的相对湿度场均较控制试验有明显的改善,AN1的同化方案降尺度后的相对湿度与CFSR的RMSE值较AN2和AN3均偏大,而AN2和AN3的结果比较接近。同样,通过对比不同分辨率嵌套网格上使用分析Nudging对7月和10月850 hPa高度层的相对湿度与CFSR之间的RMSE后发现与925 hPa上的结论一致。最后,发现使用分析Nudging降尺度对风场和高度场的约束好于湿度场,此外,即使是AN2和AN3同化了大尺度背景场,降尺度后的相对湿度在海洋上空和天气系统对应区域的RMSE值仍然较大。
由此可见,由于WRF模式长时间连续积分会导致控制试验模拟高空要素偏离驱动他的大尺度背景场,且控制试验均方根误差较大区域与大尺度天气系统有很好的对应关系。在不同分辨率嵌套网格上采用分析Nudging同化了大尺度背景场后,总体都能使得模式积分与大尺度背景场保持很好的一致性,但是,只在36 km分辨率的嵌套网格上采用分析Nudging的方案得到的降尺度后的大尺度背景场与CFSR之间的RMSE值大于在12和4 km分辨率的嵌套网格上也采用Nudging的方案,且同化效果对不同的要素也表现不同,相对来看,湿度场的均方根误差大于风场和高度场。
3.1节中给出了高空要素的降尺度效果,总体来看,不同分辨率的嵌套网格Nudging方案均能有效吸收大尺度背景场信息,使得降尺度后的高空要素与CFSR资料保持很好的一致性,而在区域气候降尺度中往往更加关注于地面要素。由于本文使用分析Nudging方案在边界层中只同化了风场,而近地面的气象要素大多基于模式最底层和下垫面信息诊断得到,所以在大尺度环流场一致的情况下,地面观测要素的准确性仍然需要进一步分析。与3.1节中不同,这里对最高分辨率,即第三层4 km分辨率的降尺度后的2 m温度、2 m相对湿度和10 m风速这3个变量插值到观测站点上,并与实际观测进行对比分析。
图5给出了辽宁省61个观测站3组分析Nudging和控制试验降尺度得到的2015年7月和10月地面2 m温度与实际观测值的RMSE空间分布。首先,从控制试验降尺度得到的7月和10月的RMSE值分布来看,降尺度得到的7月温度RMSE明显小于10月,7月辽宁省中部和南部的RMSE值普遍在3 ℃以下,西部山区的RMSE值大于3.3 ℃,而10月辽宁省大部分站点的RMSE值均大于3.3 ℃。其次,从3组Nudging同化试验对7月和10月2 m温度的降尺度结果来看,3组分析Nudging试验降尺度后温度的RMSE值均减小。3组Nudging同化试验得到的7月RMSE值普遍小于2.7 ℃,其中从AN2同化试验的RMSE值来看,61个站点中73.8%的站点RMSE值小于2.1 ℃,23.0%的站点RMSE值小于1.8 ℃。AN3同化试验降尺度得到的2 m温度的RSME值也较AN1同化试验有进一步的减小,但部分站点的RMSE值大于AN2同化试验。与7月结果类似,3组同化试验得到的10月2 m温度的RMSE也较控制试验明显减小,其中AN2试验降尺度得到的温度的改善效果最大,其次为AN3同化试验。最后,结合前面分析,可以看出2 m温度的模拟具有明显的季节性特征,可能是由于7月温差相对较小,不同降尺度方案对2 m温度的降尺度效果较好,但是10月温差较大,降尺度以后的误差虽然有一定的改善,但仍不如7月,且辽宁省中部的RMSE值相对较小,而在西部和东部山区的温度降尺度效果总体不如中部。
图3 不同降尺度试验模拟的2015年7月((a)~(d))、10月((e)~(h)) 500 hPa位势高度与CFSR资料的RMSE
Fig.3 The RMSE of 500 hPa geopotential height between the simulated from different downscaling experiments and CFSR of July ((a)~(d)) and October ((e)~(h)) in 2015
(a),(e)CTL;(b),(f)AN1;(c),(g)AN2;(d),(h)AN3
图4 不同降尺度试验模拟的2015年7月(a)~(d)、10月(e)~(h) 925 hPa相对湿度与CFSR资料的RMSE
Fig.4 The RMSE of 925 hPa relative humidity between the simulated from different downscaling experiments and CFSR of July (a)~(d) and October (e)~(h) in 2015
(a),(e)CTL;(b),(f)AN1;(c),(g)AN2;(d),(h)AN3
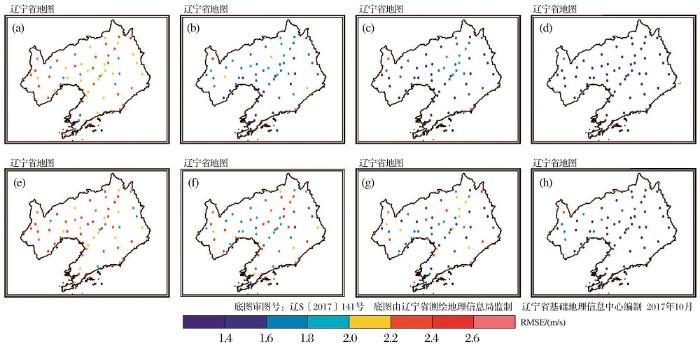
图6给出了3组分析Nudging试验和控制试验降尺度得到的2015年7月和10月地面10 m风速与实际观测值的RMSE空间分布。由图6a,e可以看出,7月和10月控制试验降尺度得到风速的RMSE值普遍在2 m/s以上,其中10月控制试验降尺度得到的风速的RMSE略大。从3组同化试验的降尺度效果来看,同样,3组同化试验降尺度后相对于控制试验对风速的降尺度均改善明显。具体来看,7月和10月结果类似,AN1同化后风速的RMSE最大,与2 m温度的降尺度结果不同,AN3同化试验降尺度得到风速的RMSE最小。从RMSE的空间分布特征来看,AN1和AN2同化试验中对辽宁省的西部和东部的山区改进效果明显,而中部的改进效果相对较小,而从AN3的试验来看,对整个区域的风速的降尺度均有很大改善,分析其原因,可能与同化边界层中的风有一定的关系。
图5 2015年7月((a)~(d))和10月((e)~(h))不同降尺度试验地面2 m温度与观测的RMSE空间分布图
Fig.5 The RMSE of temperature between different downscaling experiments and observation at 2 m of July ((a)~(d)), October ((e)~(h)) in 2015
(a),(e)CTL;(b),(f)AN1;(c),(g)AN2;(d),(h)AN3
图6 2015年7月((a)~(d))和10月((e)~(h))不同降尺度试验地面10 m风速与观测的RMSE空间分布图
Fig.6 The RMSE of wind speed between different downscaling experiments and observation at 10 m of July ((a)~(d)), October ((e)~(h)) in 2015
(a),(e)CTL;(b),(f)AN1;(c),(g)AN2;(d),(h)AN3
图7为3组分析Nudging同化试验和控制试验降尺度得到的地表2 m高度处的相对湿度与观测的RMSE值空间分布。与前面2 m高度温度和10 m高度风速降尺度结果相似,分析Nudging的同化试验可以很好地改善2 m高度的相对湿度的模拟,AN1相对于AN2和AN3来说,2 m相对湿度的改善相对较小,但与温度和风速不同的是,AN2和AN3降尺度的结果比较接近。而从RMSE的空间分布来看,这种改进且没有明显的空间分布特征。
为定量评估采用不同分析Nudging同化方案对地表2 m温度、10 m风速和2 m相对湿度的降尺度效果,通过统计降尺度结果和实际观测之间的MB,RMSE和r,来对不同降尺度方案进行定量评估。表1给出了控制试验和3组分析Nudging方案降尺度得到的7月2 m温度、10 m风速和2 m相对湿度的统计结果,由表1可以看出,对3个地面要素,3组分析同化试验降尺度结果的MB和RMSE误差明显小于控制试验,且r也明显提高。从61个观测站的平均值来看,7月2 m高度温度的平均值为24.28 ℃,而从控制试验和分析同化的降尺度结果来看,降尺度得到的2 m温度均较实况偏低,其中AN2最接近实况,偏低2%,且AN2降尺度得到的2 m温度与实况的RMSE最小,相关系数最大。10 m高度的平均风速观测值为2.21 m/s,降尺度得到的平均风速均较实况偏高,其中AN3降尺度方案得到的10 m平均风速最接近于实况,MB仅为0.24 m/s,较实况偏高11%,且AN3的RMSE和相关系数均较其他降尺度试验更接近观测值。2 m高度平均相对湿度的观测值为71.38%,除控制试验降尺度得到的结果偏高外,3组分析Nudging试验降尺度得到的平均相对湿度均较实况偏低,其中AN3试验的MB最小,但与AN2试验的MB非常接近,而且AN2试验的RMSE最小。总体来说,不同降尺度方案得到的3个要素的MB,RMSE和r中,AN2降尺度得到的2 m温度、相对湿度降尺度效果最佳,而AN3降尺度得到的10 m风速为最佳。
图7 2015年7月((a)~(d))和10月((e)~(h))不同降尺度试验地面2 m相对湿度与观测的RMSE空间分布图
Fig.7 The RMSE of relative humidity between different downscaling experiments and observation at 2 m of July ((a)~(d)),October ((e)~(h)) in 2015
(a),(e)CTL;(b),(f)AN1;(c),(g)AN2;(d),(h) AN3
表2给出了控制试验和3组分析Nudging方案降尺度得到的10月2 m温度、10 m风速和2 m相对湿度的误差统计特征。根据61个站的观测值,10月辽宁省2 m高度平均温度为10.48 ℃,从控制试验和3组分析Nudging试验的MB来看AN2最接近于实况,较实况偏低9%。从RMSE和r来看,AN2降尺度得到的2 m温度与实况的RMSE最小,r达到0.94。10月辽宁省10 m平均风速观测值为2.49 m/s,控制试验和不同的降尺度方案得到的10 m平均风速均较实况偏高,其中AN3降尺度方案得到的10 m平均风速最接近于实况,较实况偏高17.3%。从不同试验的RMSE和r来看,AN3试验的RMSE最低,为1.47 m/s,r最高为0.69,且AN2和AN3相对于AN1的RMSE和r均有较大的改善,但AN3相对于AN2改善相对较小。最后,对于2 m高度上的相对湿度,实况的平均值为58.26%,控制试验明显低估2 m高度上的相对湿度,AN2试验的MB最小,为0.08%。而从RMSE和r的值来看,则为AN3试验的降尺度效果最好,r为0.78。
表1 控制试验和3组分析Nudging方案降尺度得到的7月2 m温度、10 m风速和2 m相对湿度的误差统计特征
Table 1 The MEAN, MB, RMSE and r of different downscaling experiments of July in the year 2015
| CTL | AN1 | AN2 | AN3 | ||
|---|---|---|---|---|---|
| 2 m 温度 | MEAN | 23.73 | 23.74 | 23.8 | 23.60 |
| MB | -0.54 | -0.53 | -0.48 | -0.68 | |
| RMSE | 2.98 | 2.44 | 1.99 | 2.19 | |
| r | 0.74 | 0.85 | 0.91 | 0.90 | |
| 10 m 风速 | MEAN | 3.17 | 2.95 | 2.87 | 2.45 |
| MB | 0.96 | 0.73 | 0.66 | 0.24 | |
| RMSE | 2.26 | 1.79 | 1.56 | 1.25 | |
| r | 0.25 | 0.44 | 0.56 | 0.62 | |
| 2 m 相对 湿度 | MEAN | 73.00 | 67.97 | 68.70 | 68.72 |
| MB | 1.62 | -3.41 | -2.68 | -2.66 | |
| RMSE | 18.56 | 14.08 | 12.02 | 12.17 | |
| r | 0.49 | 0.74 | 0.81 | 0.82 |
表2 控制试验和3组分析Nudging方案降尺度得到的10 月2 m温度,10 m风速和2 m相对湿度的误差统计特征
Table 2 The MEAN, MB, RMSE and r of different downscaling experiments of October in the year 2015
| CTL | AN1 | AN2 | AN3 | ||
|---|---|---|---|---|---|
| 2 m 温度 | MEAN | 7.80 | 8.80 | 9.51 | 9.07 |
| MB | -2.68 | -1.68 | -0.97 | -1.40 | |
| RMSE | 4.12 | 3.07 | 2.52 | 2.82 | |
| r | 0.89 | 0.93 | 0.94 | 0.93 | |
| 10 m 风速 | MEAN | 3.71 | 3.74 | 3.50 | 2.92 |
| MB | 1.22 | 1.25 | 1.01 | 0.43 | |
| RMSE | 2.43 | 2.15 | 1.91 | 1.47 | |
| r | 0.49 | 0.60 | 0.64 | 0.69 | |
| 2 m 相对 湿度 | MEAN | 56.18 | 59.60 | 58.34 | 60.61 |
| MB | -2.07 | 1.34 | 0.08 | 2.35 | |
| RMSE | 19.75 | 16.30 | 15.66 | 14.85 | |
| r | 0.60 | 0.73 | 0.75 | 0.78 |
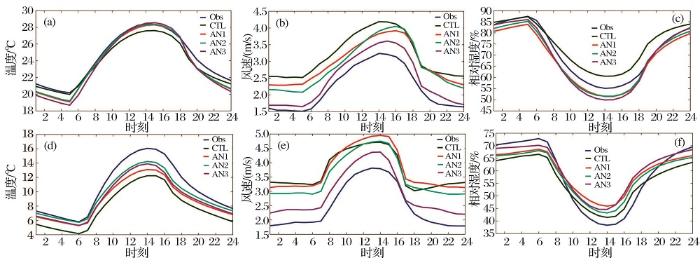
此外,图8还给出了不同降尺度方案得到的7月和10月的2 m温度、10 m风速和2 m相对湿度的日变化特征与观测的对比。总体来看,不同降尺度方案均能很好地体现3个气象要素的日变化特征,但从不同要素峰值的降尺度效果来看,不同降尺度方案则表现不同。从7月2 m温度的日变化特征可以看出(图8a),3组Nudging试验对7月最高温度的降尺度效果非常接近,均与实况吻合较好,而控制试验则明显偏低。对于最低温度的降尺度效果,则为控制试验更加接近于实况,3组分析Nudging试验降尺度结果对7月2 m最低温度的降尺度则偏低,且AN1和AN2较AN3略好。而10月的表现则不同(图8d),不同降尺度方案降尺度得到的2 m温度均较实况偏低,相对而言,AN2和AN3降尺度结果更接近于实况,且AN2优于AN3。从10 m风速降尺度的日变化来看(图8b,e),控制试验和3组Nudging试验对7月和10月风速的降尺度结果均高于观测,且对7月的降尺度效果明显好于10月。
图8 2015年7月((a)~(c))和10月((d)~(f))温度((a),(d))、风速((b),(e))、相对湿度((c),(f))日平均变化趋势(地方时)
Fig.8 Diurnal variations of temperature ((a),(d)),wind speed ((b),(e)),relative humidity ((c),(f)) for July ((a)~(c)), October ((d)~(f)) in the year 2015 (local time)
从不同分析Nudging的降尺度效果来看,AN3对风速的降尺度效果最好,其次为AN2和AN1。从2 m相对湿度降尺度的日变化来看(图8c,f),7月控制试验模拟的相对湿度明显高于观测值,而3组Nudging试验模拟的相对湿度则低于观测值,且均在夜间模拟相对湿度与观测吻合较好,而在白天则明显小于观测值。10月相对湿度小于7月,10月不同降尺度方案均在夜间模拟偏低,而在白天模拟偏高,且白天控制试验结果更接近实况值,而夜间为AN3降尺度结果与观测值吻合较好。从全天来看AN2的降尺度结果表现最为平稳。
综合以上分析可以看出,在不同分辨率嵌套网格上采用分析Nudging后,均可以改进模式对地面要素温度、风速、相对湿度的降尺度效果,但不同分辨率嵌套网格上的分析Nudging试验对不同要素改进程度不同,其中AN2对于2 m温度、2 m相对湿度改进效果最佳,而AN3对于风速的降尺度效果最优。总体而言,在12 km(AN2)和4 km(AN3)分辨率的嵌套网格上采用分析Nudging方案均较只在36 km(AN1)分辨率的嵌套网格上使用分析Nudging同化效果好。但从12 km(AN2)和4 km(AN3)的降尺度结果可以看出,即使在4 km分辨率也采用分析Nudging,并不一定能取得较好的效果,这可能还与CFSR资料本身的分辨率有关,与前人的研究结果一致,即分析Nudging一般应用在输入场的分辨率不是特别高于要降尺度的分辨率[21,22]。
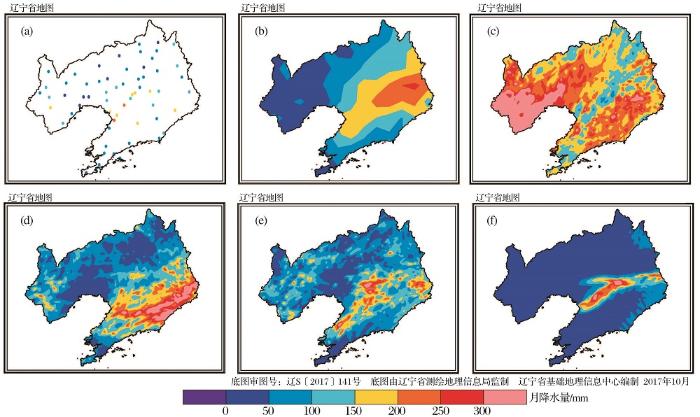
2017年西太平洋副热带高压脊线位置总体偏南,东亚夏季风北推不足,水汽北上输送不足,导致辽宁省降水较往年明显偏少。图9给出了2015年7月的观测、CFSR和不同降尺度方案得到的累计降水量的空间分布。首先,由降水的观测空间分布(图9a)可以看出,辽宁省西部和北部大部地区降水为50~100 mm,营口鞍山一带降水为150~200 mm,7月全省平均降水为93.7 mm,比常年7月全省平均降水量(172.5 mm)明显偏少。其次,CFSR资料整体上能够较好地把握辽宁省7月的降水空间分布特征和强度,但对辽宁省东部地区的降水出现了高估,其降水高值中心也偏东。从不同的降尺度方案得到的降水分布来看,控制试验得到的降水出现了明显的高估。3组分析Nudging同化降尺度的结果中,AN1能够模拟出7月在营口和鞍山一带的降水,但是在丹东地区模拟降水则明显偏大。AN2降尺度方案能够很好地模拟出降水的空间分布,相对于AN1中的丹东地区的降水明显减小,与观测也更加吻合。从AN3对降水降尺度的结果来看,降水中心同样与观测吻合较好,但是,大多数区域的降水则与实况偏差较大。
图9 2015年7月观测、CFSR和不同降尺度试验月降水量
(a)观测;(b)CFSR;(c)CTL;(d)AN1;(e)AN2;(f)AN3
Fig.9 Monthly precipitation from station observations, CFSR and different downscaling experiments in July of 2015
(a)Observation;(b)CFSR;(c)CTL;(d)AN1;(e)AN2;(f)AN3
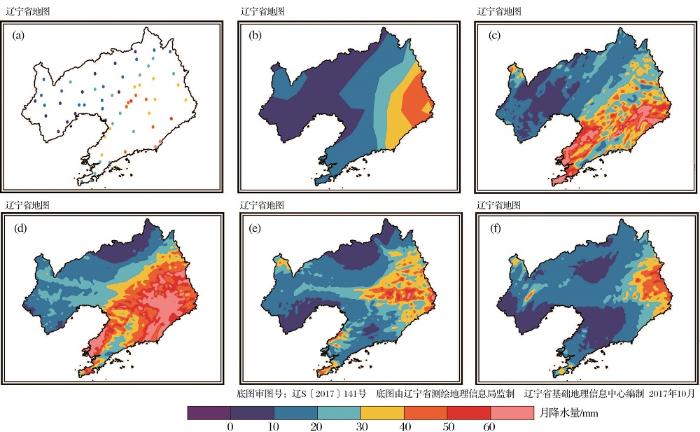
图10给出了2015年10月观测、CFSR和不同降尺度方案得到的累计降水量的空间分布。10月辽宁省大多数地区的降水为30~50 mm,其中南部和东南部的降水相对偏多。CFSR资料在辽宁省东部地区的降水相对较多,降水量基本与观测保持一致,但是在大连北部的降水偏小。从控制试验对降水的降尺度来看,与7月不同,控制试验对辽宁省降水的模拟没有明显高估,能够模拟出降水的空间分布特征,AN1与控制试验的结果相似,虽然降水空间分布一致,但在细节上仍然与观测有一定的偏差,而从AN2和AN3对降水的模拟来看,AN2模拟的降水与实况更加接近,AN3较AN2则相对略差。
图10 2015年10月观测、CFSR和不同降尺度试验月降水量
(a)观测;(b)CFSR;(c)CTL;(d)AN1;(e)AN2;(f)AN3
Fig.10 Monthly precipitation from station observations, CFSR and different downscaling experiments in October of 2015
(a)Observation;(b)CFSR;(c)CTL;(d)AN1;(e)AN2;(f)AN3
3.2和3.3节中给出了温度、风速、相对湿度和降水的月平均降尺度效果,总体来看不同分辨率的嵌套网格Nudging方案均能不同程度地提高地面要素的降尺度效果。为了进一步分析不同分辨率嵌套网格分析Nudging在不同天气条件下的降尺度影响,选取2015年7月29日和2015年7月6日分别代表雨天和晴天,进一步了解不同分析Nudging方案不同天气条件下的降尺度表现。
图11给出雨天2015年7月29日观测和不同降尺度方案得到的温度、风速、相对湿度和降水的日变化特征。由图11可以看出,不同降尺度方案均能较好地体现4个气象要素的日变化特征,对于温度(图11a),AN2试验在雨天时降尺度模拟的日变化特征相较于其他几组降尺度方案更接近观测值的日变化特征。对于风速,从图11b可以看出雨天风速无明显日变化特征,其中AN1和AN3试验与观测值更加接近,AN1和AN3降尺度得到的全省日平均风速分别比观测值偏高0.1 m/s和偏低0.1 m/s,但4组降尺度方案中又以AN2总体变化趋势更加接近于观测值。由图11c可以看出雨天4组降尺度方案模拟的相对湿度值均低于观测值,其中以AN3试验的相对湿度日变化最接近观测值。对于降水,如图11d中所示,AN2降尺度方案模拟的降水日变化特征明显较其他几组降尺度方案更接近观测降水的日变化特征,CTL试验模拟的降水日变化特征与观测也较为一致,但模拟的峰值明显高于观测的峰值,而AN1和AN3试验模拟的全省平均降水值却明显低于观测值。2015年7月6日晴天条件下,不同降尺度方案也均能较好地体现温度、风速和相对湿度的日变化特征,其中AN2试验降尺度模拟的温度和相对湿度的日变化特征相较于其他几组降尺度方案更接近观测值的日变化特征,而AN3降尺度方案模拟的风速日变化与观测值最为接近。
综上,AN2试验对于温度、相对湿度和降水的日变化特征能够很好地把握,而AN3则模拟风速的日变化与观测值最为接近,与不同降尺度方案月平均结果也基本一致。
图11 不同降尺度方案得到的2015月7月29日00时至23时温度(a)、风速(b)、相对湿度(c)、降水(d)日变化特征(UTC时)与实况的对比
Fig.11 Diurnal variation of hourly temperature(a), wind speed(b), relative humidity(c) and precipitation(d) on 29th July in 2015 between different downscaling experiments and observation
本文利用WRF模式开展了辽宁省的降尺度敏感性试验,分析了在不同分辨率嵌套网格上使用分析Nudging对地面要素降尺度的影响,总体的结论如下:
(1)借助于分析Nudging,在区域气候降尺度中可以有效吸收大尺度背景场,使模式在积分过程中不偏离大尺度背景场,但从不同环流尺度要素的降尺度结果来看,相对湿度大尺度的同化效果相对于位势高度和风场要弱。
(2)通过分析不同分辨率嵌套网格上的分析Nudging同化大尺度背景场后,从地面2 m温度、10 m风速、2 m相对湿度和降水的月平均降尺度结果来看,3种分析Nudging对不同要素的改进程度不同,对于10 m风速,4 km分辨率嵌套网格上采用分析Nudging比只在36和12 km分辨率嵌套网格上使用分析Nudging好,而对于2 m温度、2 m相对湿度和降水,则是在12 km分辨率嵌套网格上采用分析Nudging的结果最好。且不同天气条件下的气象要素降尺度的日变化特征的表现基本与月平均结果一致,但相对湿度的降尺度结果在不同天气条件下在12和4 km分辨率网格的降尺度结果略有不同。
(3)分析Nudging作为一种区域气候降尺度的方案,采用分析Nudging后的降尺度效果明显得到改善,且总体上来说,12 km上使用分析Nudging效果最优,这与Bullock等[23]研究认为当分析Nudging应用在12 km分辨率上可以提高降水和温度的模拟精度的结论一致。但是,随着嵌套网格空间分辨率的进一步提高,如3~5 km,采用分析Nudging后对温度、相对湿度和降水的降尺度效果的进一步改进相对比较有限,这可能与本文所使用的CFSR资料本身分辨率有关,当采用分析Nudging的分辨率与大尺度的再分析资料分辨率相差较大,分析Nudging并不能取得较好的降尺度结果。
总体而言,本文使用了分析Nudging后,降尺度结果明显得到了改善,虽然降尺度试验时间相对较短,但对降尺度方案的确定仍然能够起到一定的指导意义。此外,本文对于同化不同要素对降尺度的影响,以及降尺度相关敏感参数对降尺度的影响尚未进行全面的分析,这些都是未来需要继续开展的工作。
The authors have declared that no competing interests exist.
| [1] |
Comparison of simulated results of regional climate in summer over Qinghai-Xizang Plateau and Northwest China [J].区域模式和GCM对青藏高原和西北地区气候模拟结果的对比分析 [J].
使用一个区域模式与大气环流模式(GCM)嵌套,模拟了我国西北及青藏高原地区夏季气候的平均状态。将区域模式与GCM嵌套的模拟结果和GCM单独使用时的模拟结果与观测场进行了对比分析和相关分析。结果表明:GCM模式模拟出了我国西北和青藏高原地区夏季大尺度气候的基本特征,对降水的模拟也基本合理,但无法分辨出较小系统。区域模式与GCM嵌套的模拟结果有明显改善,它可成功地再现西北及青藏高原地区夏季的区域气候特征(包括某些中尺度特征),分辨出了大气环流模式难以详尽描述的高原气候特征,对降水的模拟较GCM的模拟结果也有明显的改善。GCM模拟结果与实际的气候场的差异在很大程度上影响了区域模式的模拟结果,特别是对模式边缘的影响更明显。
|
| [2] |
Long-term climate simulation of CCSM4.0 and evaluation of its performance over East Asia and China [J].CCSM4.0的长期积分试验及其对东亚和中国气候模拟的评估 [J].
本文利用通用气候系统模式CCSM4.0的低分辨率 (T31, 约3.75° × 3.75°) 版本进行了700年的长期积分试验, 将中国地表气温、降水及东亚海平面气压、500 hPa和100 hPa位势高度、850 hPa风场的最后100年模拟结果与观测和再分析资料进行了定性比较, 并对前三个要素的不同统计量值进行了定量计算, 系统评估了CCSM4.0对东亚及我国气候的模拟能力。结果表明, 模式能够合理模拟各变量的基本分布形态, 但幅度与观测有所差别, 其中地表气温的模拟效果最好, 降水的相对最差。具体而言, 地表气温空间分布型与观测一致, 但全年青藏高原地表气温模拟值偏高, 位于塔里木盆地的暖中心未能模拟出来; 降水空间分布型模拟较差, 除冬季不明显之外, 我国中南部全年都存在一个虚假降水中心, 并在夏季达到最强; 冬季东亚地区海陆热力对比大于观测, 夏季海平面气压场整体模拟效果不如冬季; 模式对冬、夏季500 hPa东亚大槽和西北太平洋副热带高压的主要特征刻画较好, 但模拟结果整体比观测偏强; 夏季100 hPa南亚高压强度与观测接近, 但高压范围及中心位置存在偏差; 850 hPa东亚冬季风和夏季风环流模拟较好, 但冬季西北气流偏强, 夏季索马里越赤道气流偏弱、我国东部西南气流偏强。总的来说, CCSM4.0对东亚和我国大尺度气候特征具备合理的模拟能力, 尽管在定量上还存在着不足。
|
| [3] |
Double nested dynamical downscaling research on summer precipitation over China with WRF model [J].WRF模式对中国夏季降水的动力降尺度模拟研究 [J].
采用NCEP的FNL再分析资料驱动WRF模式,对中国10 a(2000—2009年)夏季降水进行双重动力降尺度(双重嵌套)模拟,将子、母区域模拟结果和观测进行对比,以检验双重动力降尺度对中国夏季降水模拟的"增值"能力。结果表明:单重动力降尺度(单重嵌套)方法能较好模拟出中国10 a夏季平均降水的空间分布,对季风雨带"北跳"特征模拟较好,但模拟降水具有系统性正偏差。在母区域的强迫下,双重动力降尺度模拟的降水分布与单重动力降尺度相比,没有发生根本性变化。但由于子区域的分辨率要高于母区域,双重动力降尺度比单重动力降尺度能提供更多有价值的降水细节。双重动力降尺度的这种"增值"能力存在地域依赖性,在华南地区和江淮地区,双重动力降尺度模拟出的降水分布、量值和逐日演变都要好于单重动力降尺度。但在华北地区,双重动力降尺度没有表现出明显的"增值"。
|
| [4] |
Evaluation of WRF mesoscale climate simulations over the Tibetan Plateau during 1979-2011 [J].
To develop a finescale dataset for the purpose of analyzing historical climatic change over the Tibet Plateau (TP), a high-resolution regional climate simulation for 1979-2011 was conducted using the Weather Research and Forecasting (WRF) Model driven by the ERA-Interim(ERA-Int). This work evaluates the high-resolution (30 km) WRF simulation in terms of annual variation, spatial structure, and 33-yr temporal trends of surface air temperature (Tair) and precipitation (Prec) over the TP, with reference to station observations. Another focus is on the examination of the height-temperature relationship. Inheriting from its forcing, the WRF simulation presents an apparent cold bias in the TP. The cold bias is largely reduced by a lapse rate correction of the simulated surface air temperature with help of the station and model elevations. ERA-Int presents the same sign of Tair and Prec trends as the observations, but with smaller magnitude, especially in the dry season. Compared to its forcing, the WRF simulation improves the simulation of the annual cycles and temporal trends of Tair and Prec in the wet season. In the dry season, however, there is hardly any improvement. The observed Tair presents a downward linear trend in the lapse rate. This feature is examined in the WRF simulation in comparison to ERA-Int. The WRF simulation captures the observed lapse rate and its temporal trend better than ERA-Int. The decreasing lapse rate over time confirms that Tair change in the TP is elevation dependent.
|
| [5] |
Review of research of forcing data for regional scale hydrological model [J].区域尺度近地表气候要素驱动数据研制的研究综述 [J]. |
| [6] |
Simulation of temperature and precipitation during the last 100 years over southern China by a regional climate model [J].利用区域气候模式对我国南方百年气温和降水的动力降尺度模拟 [J].
本文采用NCAR的WRF3.5.1模式,以NOAA的20世纪再分析资料作为区域气候模式的初始场和侧边界场,对东亚地区进行了百年以上(1900~2010年)尺度、水平分辨率为50 km的动力降尺度数值模拟试验。通过与观测气候资料的对比,分析了驱动场(20世纪再分析资料)和区域气候模式对我国南方地区近50年(1961~2010年)气温和降水的气候平均态的模拟能力。结果表明:经过动力降尺度的区域气候模式试验结果能更好地模拟我国南方地区气温气候平均态和季节循环。WRF模式模拟的气温与观测的气温的空间相关系数均在0.97以上。年平均和夏季,WRF模式模拟的气温与观测的气温的偏差大多介于-1°C到+1°C之间。对于降水,WRF模式显著提高了我国南方降水的模拟能力。和驱动场相比,WRF模式模拟的降水与观测的偏差明显减小。夏季,WRF模式模拟的降水空间相关系数在0.5以上。由此延伸至对近百年我国南方地区三个子区域(华南地区、江淮地区和西南地区)四个时段(1914~1942年、1943~1971年、1972~2000年和2001~2010年)的分析,结果表明区域气候模式动力降尺度的结果在区域平均的气温和降水的模拟数值上与观测比较接近,夏季模拟能力有明显的提高,冬季存在气温模拟偏低的误差。对气温趋势分析表明,在20世纪40年代以后的两个时间段,区域气候模式明显提高了气温变化线性趋势的模拟性能。
|
| [7] |
A spectral nudging technique for dynamical downscaling purposes [J]. |
| [8] |
Spectral nudging to eliminate the effects of domain position and geometry in regional climate model simulations [J].
[1] Gas transfer rates were determined from relaxed eddy accumulation (REA) measurements of the flux of dimethylsulfide (DMS) over the northeastern Pacific Ocean. This first application of the REA technique for the measurement of DMS fluxes over the open ocean produced estimates of the gas transfer rate that are on average higher than those calculated from commonly used parameterizations. The relationship between the total gas transfer rate and wind speed was found to be gas kgas = 0.53 (00±0.05) U102. Because of the effect of the airside resistance, the waterside transfer rate was up to 16% higher than kgas. Removal of the airside transfer component from the total transfer rate resulted in a relation between wind speed and waterside transfer of k660 = 0.61 (00±0.06) U102. However, DMS fluxes showed a high degree of scatter that could not readily be accounted for by wind speed and atmospheric stability. It has to be concluded that these measurements do not permit an accurate parameterization of gas transfer as a function of wind speed.
|
| [9] |
Internal variability of RCM simulations over an annual cycle [J].
Three one-year simulations generated with the Canadian RCM (CRCM) are compared to each other in order to study internal variability in nested regional climate models and to evaluate the influence exerted by the lateral boundaries information supplied by the nesting procedure. All simulations are generated over a large domain and cover an annual cycle. The simulations use different combinations of surface and atmospheric initial conditions but all of them share the same set of time-dependent lateral boundary conditions taken from a simulation by the Canadian GCM. A first simulation is used as control, the second simulation is launched with different atmospheric and surface initial conditions (IC) and the third simulation is launched taking its surface IC from the control simulation. Comparison of the root-mean-square differences ( RMSD ) between each pair of simulations shows two distinct seasonal behaviours in the time series of the RMSD . In winter all simulations are almost identical to each other resulting in very low RMSD values while in summer large discrepancies develop between pairs of simulations. For water vapour related fields such as precipitation or specific humidity, these discrepancies are sometimes as large as the monthly averaged variability. However, analysis of the climate statistics shows that, although the evolution of the various summer weather systems is different, the climates of each simulation are similar.
|
| [10] |
Sr R A P, Leoncini G. Dynamical downscaling: Assessment of value retained and added using the Regional Atmospheric Modeling System (RAMS) [J].
[1] The value restored and added by dynamical downscaling is quantitatively evaluated by considering the spectral behavior of the Regional Atmospheric Modeling System (RAMS) in relation to its domain size and grid spacing. A regional climate model (RCM) simulation is compared with NCEP Reanalysis data regridded to the RAMS grid at each model analysis time for a set of six basic experiments. At large scales, RAMS underestimates atmospheric variability as determined by the column integrated kinetic energy and integrated moisture flux convergence. As the grid spacing increases or domain size increases, the underestimation of atmospheric variability at large scales worsens. The model simulated evolution of the kinetic energy relative to the reanalysis regridded kinetic energy exhibits a decrease with time, which is more pronounced with larger grid spacing. Additional follow-on experiments confirm that the surface boundary forcing is the dominant factor in generating atmospheric variability for small-scale features and that it exerts greater control on the RCM solution as the influence of lateral boundary conditions diminish. The sensitivity to surface forcing is also influenced by the model parameterizations, as demonstrated by using a different convection scheme. For the particular case considered, dynamical downscaling with RAMS in RCM mode does not retain value of the large scale which exists in the larger global reanalysis. The utility of the RCM, or value added, is to resolve the smaller-scale features which have a greater dependence on the surface boundary. This conclusion regarding RAMS is expected to be true for other RCMs as well.
|
| [11] |
Internal variability in regional climate downscaling at the seasonal scale [J].
To study the internal variability of the model and its consequences on seasonal statistics, large ensembles of twenty 3-month simulations of the Canadian Regional Climate Model (CRCM), differing only in their initial conditions, were generated over different domain sizes in eastern North America for a summer season. The degree of internal variability was measured as the spread between the individual members of the ensemble during the integration period. Results show that the CRCM internal variability depends strongly on synoptic events, as is seen by the pulsating behavior of the time evolution of variance during the period of integration. The existence of bimodal solutions for the circulation is also noted. The geographical distribution of variance depends on the variables; precipitation shows maximum variance in the southern United States, while 850-hPa geopotential height exhibits maximum variance in the northeast part of the domain. Results suggest that strong precipitation events in the southern United States may act as a triggering mechanism for the 850-hPa geopotential height spread along the storm track, which reaches its maximum toward the northeast of the domain. This study reveals that successive reductions of the domain size induce a general decrease in the internal variability of the model, but an important variation in its geographical distribution and amplitude was detected. The influence of the internal variability at the seasonal scale was evaluated by computing the variance between the individual member seasonal averages of the ensemble. Large values of internal variability for precipitation suggest possible repercussions of internal variability on seasonal statistics.
|
| [12] |
Sensitivity study of regional climate model simulations to large-scale Nudging parameters [J].
Previous studies with nested regional climate models (RCMs) have shown that large-scale spectral nudging (SN) seems to be a powerful method to correct RCMs’ weaknesses such as internal variability, intermittent divergence in phase space (IDPS), and simulated climate dependence on domain size and geometry. Despite its initial success, SN is not yet in widespread use because of disagreement regarding the main premises—the unconfirmed advantages of removing freedom from RCMs’ large scales—and lingering doubts regarding its potentially negative side effects. This research addresses the latter issue. Five experiments have been carried out with the Canadian RCM (CRCM) over North America. Each experiment, performed under a given SN configuration, consists of four ensembles of simulations integrated on four different domain sizes for a summer season. In each experiment, the effects of SN on internal variability, time means, extremes, and power spectra are discussed. As anticipated from previous investigations, the present study confirms that internal variability, as well as simulated-climate dependence on domain size, decreases with increased SN strength. Our results further indicate a noticeable reduction of precipitation extremes as well as low-level vorticity amplitude in almost all length scales, as a side effect of SN; these effects are mostly perceived when SN is the most intense. Overall results indicate that the use of a weak to mild SN may constitute a reasonable compromise between the risk of decoupling of the RCM internal solution from the lateral boundary conditions (when using large domains without SN) and an excessive control of the large scales (with strong SN).
|
| [13] |
A lateral boundary formulation for multi-level prediction models [J].
Abstract An expedient method is proposed for the lateral boundary treatment of a limited-area prediction model. The method involves the relaxation of the interior flow in the vicinity of the boundary to the external fully prescribed flow. A systematic study of the method is undertaken with an (x, z) , linear, primitive equation model. Analytical considerations of the method for the continuous equations demonstrate the manner in which the method consumes gravity wave energy, error and fine spatial scale potential vorticity near the lateral boundaries. Numerical experiments are also undertaken to assess the usefulness of the method. The results indicate that the method gives an adequate representation of outgoing gravity waves with and without an ambient shear flow, and also allows the substantially undistorted transmission of geostrophically balanced flow out of the interior of the limited domain. On the basis of these results, it is suggested that the method constitutes a promising utilitarian treatment of the lateral boundaries.
|
| [14] |
Use of four-dimensional data assimilation in a limited-area mesoscale model, Part I: Experiments with synoptic-scale data [J].
Abstract A four-dimensional data assimilation (FDDA) scheme based on Newtonian relaxation or “nudging” is tested using standard rawinsonde data in the Penn State/NCAR limited-area mesoscale model. It is imperative that we better understand these FDDA-generated datasets, which are widely used for model initialization and diagnostic analysis. The main hypothesis to be tested is that use of coarse-resolution rawinsonde observations throughout a model integration, rather than at only the initial time, can limit large-scale model error growth (amplitude and phase errors) while the model generates realistic mesoscale structures not resolved by the data. The main objective of this study is to determine what assimilation strategies and what meteorological fields (mass, wind or both) have the greatest positive impact via FDDA on the numerical simulators for two midlatitude, real-data cases using the full-physics version of a limited-area model. Seven experiments are performed for each case: one control experiment ...
|
| [15] |
Sensitivity of a spectrally filtered and Nudged limited—Area model to outer model options [J].
Abstract Numerical filters required to control spatial computational modes in a limited-area model (LAM) that uses the unstaggered. A grid are developed and tested over the complex topography of the Great Basin of the western United States. The filters are founded upon Fourier expansions of forecast deviation fields and function equally effectively for both periodic and aperiodic local structures. Unlike other spatial filters, the approach used here avoids any direct contamination of larger scales. Provided that the shortest resolved wavelength of two grid intervals is removed, the results do not depend strongly on the range of filtered short waves or on the type and order of horizontal space difference approximations. This approach leads naturally to methods in which the large scales predicted by an ambient outer model can be directly incorporated within the complete domain of the inner LAM, rather than just through conditions applied at the lateral boundaries of the LAM. This technique has some similari...
|
| [16] |
Sr R A P. Assessment of three dynamical climate downscaling methods using the Weather Research and Forecasting (WRF) model [J].
[1] The common methodology in dynamical regional climate downscaling employs a continuous integration of a limited-area model with a single initialization of the atmospheric fields and frequent updates of lateral boundary conditions based on general circulation model outputs or reanalysis data sets. This study suggests alternative methods that can be more skillful than the traditional one in obtaining high-resolution climate information. We use the Weather Research and Forecasting (WRF) model with a grid spacing at 36 km over the conterminous U.S. to dynamically downscale the 1-degree NCEP Global Final Analysis (FNL). We perform three types of experiments for the entire year of 2000: (1) continuous integrations with a single initialization as usually done, (2) consecutive integrations with frequent re-initializations, and (3) as (1) but with a 3-D nudging being applied. The simulations are evaluated in a high temporal scale (6-hourly) by comparison with the 32-km NCEP North American Regional Reanalysis (NARR). Compared to NARR, the downscaling simulation using the 3-D nudging shows the highest skill, and the continuous run produces the lowest skill. While the re-initialization runs give an intermediate skill, a run with a more frequent (e.g., weekly) re-initialization outperforms that with the less frequent re-initialization (e.g., monthly). Dynamical downscaling outperforms bi-linear interpolation, especially for meteorological fields near the surface over the mountainous regions. The 3-D nudging generates realistic regional-scale patterns that are not resolved by simply updating the lateral boundary conditions as done traditionally, therefore significantly improving the accuracy of generating regional climate information.
|
| [17] |
Application research into climate dynamical downscaling over a complex terrain [J].气候动力降尺度方法在复杂下垫面的应用研究 [J].
在传统的以不断更新侧边界场而 只进行一次初始场输入的动力降尺度基础上,利用中尺度天气预报模式设计了不同频次初始场的输入,以期检验其在复杂下垫面下的一个站点(SCAOL站)范围 的模拟效果,从而改进该站长时间积分模拟的有效性.加入了中尺度天气预报模式自带的分析松弛研究其模拟效果.结果表明4种方案对地面向上2 m处的温度和相对湿度的模拟要优于对10 m处风速的模拟."分析松弛"表现出了对地面相对湿度模拟很好的改善,却不适宜对地表热量通量的模拟,且对10 m处风速的模拟结果变化平缓;增加初始场输入频次对地表热量通量的模拟有改善,对其他3个变量的模拟结果影响不明显.
|
| [18] |
Comments on the paper updating prediction models by dynamical relaxationl: An examination of the Technique [J].
Abstract A dynamical relaxation technique for updating prediction models is analyzed with the help of the linear and nonlinear barotropic primitive equations. It is assumed that a complete four-dimensional time history of some prescribed subset of the meteorological variables is known. The rate of adaptation of the flow variables toward the true state is determined for a linearized f-model, and for mid-latitude and equatorial beta-plane models. The results of the analysis are corroborated by numerical experiments with the nonlinear shallow-water equations.
|
| [19] |
The effect of indiscriminate nudging time on large and small scales in regional climate modelling: Application to the Mediterranean basin [J].
Abstract A regional climate model (RCM) is driven by the ERA-40 reanalyses produced by the ECMWF general circulation model (GCM) to simulate the winter 1998 climate over the Mediterranean basin. In this article, we consider the effects on internal variability of temporal nudging. This technique consists of relaxing the RCM's prognostic variables towards the GCM values within a predetermined time-scale, with the aim of disallowing large and unrealistic departures between driving and driven fields. To interpret the significant effect of time nudging on the regional climate prediction, we develop a ‘toy model’ basically consisting of resolving a linear transport equation with a Newtonian relaxation term. This model predicts the existence of an optimal nudging time which depends on the time-scale over which numerical errors affect significantly the accuracy of the ‘regional’ solution at the large spatial scales, and the typical time-scale of the small-scale phenomena that are not resolved by the GCM. Copyright 08 2010 Royal Meteorological Society
|
| [20] |
Investigation of indiscriminate nudging and predictability in a nested quasi-geostrophic model [J].
In this work, we consider the effect of indiscriminate nudging time on an idealized high-resolution global model (GM) and limited-area model (LAM) simulations. The model used is a two-layer quasi-geostrophic model on the beta-plane.The effect of nudging is studied as a function of the predictability time, following a ‘Big Brother’ experimental approach: a high-resolution ‘global’ model is used to generate a ‘reference run’. These fields are filtered afterwards to remove small scales and provide the coarse-resolution fields which are used to drive the high-resolution GM and the LAM. Comparison of the reference fields and the high-resolution runs over the same region allows the estimation of the ability of the high-resolution GM and LAM to regenerate the removed small scales. This fully nonlinear set-up mimics the configuration used for regional high-resolution atmospheric modelling.For the high-resolution GM, the results show that the behaviour of the nudged model depends primarily on the ratio of the nudging time to the predictability time. When the nudging time is very small compared to the predictability time, the model reproduces the large scale used to drive the model. On the other hand, if the nudging time is close to or larger than the predictability time, the nudging effect is weak and both large and small scales are poorly reproduced compared to the reference fields. The best result is obtained with a nudging time close to half the predictability time. This technique clearly improves the model capacity to reproduce the reference fields.For the high-resolution LAM, our results show that for a sufficiently small domain the simulation is largely controlled by the lateral boundary conditions (LBCs) and is quasi-insensitive to nudging. However, if the domain size exceeds a few Rossby radii, the high-resolution LAM becomes sensitive to initial conditions and the control exerted by LBCs becomes insufficient to prevent a divergence from the driving fields. Although the reconstructed fine scales are significantly damped, they are surprisingly well correlated to their reference values in a deterministic sense, not a statistical sense. Copyright 08 2011 Royal Meteorological Society
|
| [21] |
Multiscale four-dimensional data assimilation [J].
Four-dimensional data assimilation (FDDA) schemes capable of effectively analyzing asynoptic, near-continuous data streams art especially important on the mesobeta scale for both model initialization and dynamic analysis. A multiscale nudging approach that utilizes grid nesting is investigated for the generation of complete, dynamically consistent datasets for the mesobeta scale. These datasets are suitable for input into air quality models, but can also be used for other diagnostic purposes including model initialization. A multiscale nudging strategy is used here to simulate the wind flow for two cases over the Colorado Plateau and Grand Canyon region during the winter of 1990 when a special mesobeta-scale observing system was deployed in the region to study the canyon's visibility impairment problem. The special data included Doppler sodars, profilers rawinsondes, and surface stations. Combinations of these data and conventional mesoalpha-scale data were assimilated into a nested version of the Pennsylvania State University-National Center for Atmospheric Research Mesoscale Model to investigate the importance of wale interaction and scale separation during FDDA.Mesoalpha-scale forcing was shown to be important for accurate simulation of the mesobeta-scale flow over the 48-h period of the simulators. Direct assimilation of mesoalpha-scale analyses on a finescale grid was shown to be potentially harmful to the simulation of mesobeta-scale features. Nudging to mesoalpha-scale analyses on the coarse grid enabled nudging to mesobeta-scale observations on the inner fine grid to be more effective. This grid-nesting multiscale FDDA strategy produced the most accurate simulation of the low-level wind fields. It is demonstrated that when designing an FDDA strategy, scale interactions of different flow regimes cannot be ignored, particularly for simulation periods of several days on the mesobeta scale.
|
| [22] |
Examining interior grid nudging techniques using two-way nesting in the WRF Model for regional climate modeling [J].
This study evaluates interior nudging techniques using the Weather Research and Forecasting (WRF) model for regional climate modeling over the conterminous United States (CONUS) using a two-way nested configuration. NCEP鈥旸epartment of Energy Atmospheric Model Intercomparison Project (AMIP-II) Reanalysis (R-2) data are downscaled to 36 km 脳 36 km by nudging only at the lateral boundaries, using gridpoint (i.e., analysis) nudging and using spectral nudging. Seven annual simulations are conducted and evaluated for 1988 by comparing 2-m temperature, precipitation, 500-hPa geopotential height, and 850-hPa meridional wind to the 32-km North American Regional Reanalysis (NARR). Using interior nudging reduces the mean biases for those fields throughout the CONUS compared to the simulation without interior nudging. The predictions of 2-m temperature and fields aloft behave similarly when either analysis or spectral nudging is used. For precipitation, however, analysis nudging generates monthly precipitation totals, and intensity and frequency of precipitation that are closer to observed fields than spectral nudging. The spectrum of 250-hPa zonal winds simulated by the WRF model is also compared to that of the R-2 and NARR. The spatial variability in the WRF model is reduced by using either form of interior nudging, and analysis nudging suppresses that variability more strongly than spectral nudging. Reducing the nudging strengths on the inner domain increases the variability but generates larger biases. The results support the use of interior nudging on both domains of a two-way nest to reduce error when the inner nest is not otherwise dominated by the lateral boundary forcing. Nevertheless, additional research is required to optimize the balance between accuracy and variability in choosing a nudging strategy.
|
| [23] |
An observation-based investigation of Nudging in WRF for downscaling surface climate information to 12-km grid spacing [J].
ABSTRACT Previous research has demonstrated the ability to use the Weather Research and Forecasting model (WRF) and contemporary dynamical downscaling methods to refine global climate modeling results to a horizontal grid spacing of 36 km. Environmental managers and urban planners have expressed the need for even finer resolution in projections of surface-level weather to take into account local geophysical and urbanization patterns. In this study, WRF as previously applied at 36-km grid spacing is used with 12-km grid spacing with one-way nesting to simulate the year 2006 over the central and eastern United States. The results at both resolutions are compared with hourly observations of surface air temperature, humidity, and wind speed. The 12- and 36-km simulations are also compared with precipitation data from three separate observation and analysis systems. The results show some additional accuracy with the refinement to 12-km horizontal grid spacing, but only when some form of interior nudging is applied. A positive bias in precipitation found previously in the 36-km results becomes worse in the 12-km simulation, especially without the application of interior nudging. Model sensitivity testing shows that 12-km grid spacing can further improve accuracy for certain meteorological variables when alternate physics options are employed. However, the strong positive bias found for both surface-level water vapor and precipitation suggests that WRF as configured here may have an unbalanced hydrologic cycle that is returning moisture from land and/or water bodies to the atmosphere too quickly.
|
| [24] |
Regional climate modeling: Status and perspectives [J].
This paper is presents a concise review of regional climate modeling, from its ensuing stages in the late 1980s to the most recent developments. A tremendous progress has been achieved in improving the performance of regional climate models, which are currently used by a growing research community for a wide range of applications, from process studies to paleoclimate and future climate simulations. Basic concepts underlying the nested modeling technique, along with the current debate on outstanding issues in regional climate modeling, are discussed. Finally, perspectives of future developments in this rapidly evolving research area are briefly outlined. An extensive reference list is provided to support the discussion.
|
| [25] |
Multi-decadal scenario simulation over Korea using a one-way double-nested regional climate model systempart 1: Recent climate simulation (1971-2000) [J].
An analysis of simulated future surface climate change over the southern half of Korean Peninsula using a RegCM3-based high-resolution one-way double-nested system is presented. Changes in mean climate as well as the frequency and intensity of extreme climate events are discussed for the 30-year-period of 202109“2050 with respect to the reference period of 197109“2000 based on the IPCC SRES B2 emission scenario. Warming in the range of 109“400°C is found throughout the analysis region and in all seasons. The warming is maximum in the higher latitudes of the South Korean Peninsula and in the cold season. A large reduction in snow depth is projected in response to the increase of winter minimum temperature induced by the greenhouse warming. The change in precipitation shows a distinct seasonal variation and a substantial regional variability. In particular, we find a large increase of wintertime precipitation over Korea, especially in the upslope side of major mountain systems. Summer precipitation increases over the northern part of South Korea and decreases over the southern regions, indicating regional diversity. The precipitation change also shows marked intraseasonal variations throughout the monsoon season. The temperature change shows a positive trend throughout 202109“2050 while the precipitation change is characterized by pronounced interdecadal variations. The PDF of the daily temperature is shifted towards higher values and is somewhat narrower in the scenario run than the reference one. The number of frost days decreases markedly and the number of hot days increases. The regional distribution of heavy precipitation (over 80 mm/day) changes considerably, indicating changes in flood vulnerable regions. The climate change signal shows pronounced fine scale signal over Korea, indicating the need of high-resolution climate simulations
|
| [26] |
The sensitivity of WRF downscaled precipitation in Puerto Rico to Cumulus Parameterization and Interior Grid Nudging [J].
The sensitivity of the Weather Research and Forecasting Model (WRF) simulated precipitation over Puerto Rico is evaluated using multiple combinations of cumulus parameterization (CP) schemes and interior grid nudging. NCEP-DOE AMIP-II reanalysis (R-2) is downscaled to 2- km horizontal grid spacing with both convective permitting simulations (CP active only in the 49 middle and outer domains) and CP schemes active in all domains. The results generally show lower simulated precipitation amounts compared to the observations, regardless of WRF configuration. However, activating the CP schemes in the inner domain improves the annual cycle, intensity, and placement of rainfall compared to the convective permitting simulations. Furthermore, the use of interior grid nudging techniques in the outer domains improves the placement and intensity of rainfall in the inner domain. Incorporating a CP scheme at convective permitting scales ( 4 km) improves the island average correlation of precipitation by 0.05 to 0.2 and reduces the island average RMSE by up to 40 mm on average over relying on the explicit microphysics at convective permitting scales with grid nudging. Projected changes in summer precipitation between 2040-2042 and 1985-1987 using WRF to downscale CCSM4 ranges from a 2.6 mm average increase to 81.9 mm average decrease, depending on the choice of CP scheme. The differences are only associated with differences between WRF configurations, which indicates the importance of CP scheme for projected precipitation change as well as historical accuracy.
|
| [27] |
Does Nudging squelch the extremes in regional climate modeling? [J].
An important question in regional climate downscaling is whether to constrain (nudge) the interior of the limited-area domain toward the larger-scale driving fields. Prior research has demonstrated that interior nudging can increase the skill of regional climate predictions originating from historical data. However, there is concern that nudging may also inhibit the regional model's ability to properly develop and simulate mesoscale features, which may reduce the value added from downscaling by altering the representation of local climate extremes. Extreme climate events can result in large economic losses and human casualties, and regional climate downscaling is one method for projecting how climate change scenarios will affect extreme events locally. In this study, the effects of interior nudging are explored on the downscaled simulation of temperature and precipitation extremes. Multidecadal, continuous Weather Research and Forecasting model simulations of the contiguous United States are performed using coarse reanalysis fields as proxies for global climate model fields. The results demonstrate that applying interior nudging improves the accuracy of simulated monthly means, variability, and extremes over the multidecadal period. The results in this case indicate that interior nudging does not inappropriately squelch the prediction of temperature and precipitation extremes and is essential for simulating extreme events that are faithful in space and time to the driving large-scale fields.
|
| [28] |
Progress of application of the Weather Research and Forecast (WRF) model in China [J].新一代中尺度预报模式(WRF) 国内应用进展 [J]. |
| [29] |
Evaluation of the sarm-season diurnal variability over East Asia in recent reanalyses JRA-55, ERA-Interim, NCEP CFSR, and NASA MERRA [J].
Four recent reanalyses鈥攖he 55-yr Japanese Reanalysis Project (JRA-55), Interim ECWMF Re-Analysis (ERA-I), NCEP Climate Forecast System Reanalysis (CFSR), and NASA Modern-Era Retrospective Analysis for Research and Applications (MERRA)鈥攁re assessed to clarify their quality in representing the diurnal cycle over East Asia. They are found to present similar patterns/structure and summer progress of the mean wind diurnal cycle, whereas they exhibit some differences in diurnal amplitude, particularly for the low-level meridional wind. An evaluation with intense soundings suggests that the amplitude difference mainly results from the diurnal variation of mean bias that differs among reanalyses. The root-mean-square (RMS) error is found to have a diurnal variation more evident in CFSR and MERRA than that in JRA-55 and ERA-I, which strongly affects the representation of the varying diurnal amplitude at the peak hours of RMS error. Compared with satellite-derived rainfall, the four reanalyses are shown to reproduce well the rainfall diurnal cycle over East Asia in terms of large-scale terrain contrast, summer progress, and interannual variability. JRA-55 even presents a long-term increase of morning rainfall percentage over the east China plain over the past four decades, consistent with rain gauge observations. The four reanalyses exhibit some considerable discrepancies at regional scale; JRA-55 gives the best capture of the rainfall diurnal cycle over the Tibetan Plateau and the eastward propagation to the eastern lees. These results suggest that new reanalyses are potentially applicable for studying the large-scale diurnal variability over East Asia, whereas their different preferences, especially at regional scale, should be of concern in data application.
|
| [30] |
Evaluation of summer precipitation of CFSR, ERA-Interim and MERRA reanalysis in Xinjiang [J].新疆夏季降水时空分布的适用性评估 [J]. |
| [31] |
Applicability study of CFSR,ERA-Interim and MERRA precipitation estimates in Central Asia [J].CFSR、ERA-Interim和MERRA降水资料在中亚地区的适用性 [J].
利用中亚1979-2011年间162个观测站点月降水数据(<em>OBS</em>),以平均偏差(<em>MBE</em>)、相关系数(<em>R</em>)、平均绝对误差(<em>MAE</em>)和均方根误差(<em>RMSE</em>)对CFSR、ERA-Interim和MERRA气象再分析降水数据在中亚地区的适用性进行评估。结果表明:(1)3套数据的模拟效果存在明显差异。其中MERRA的模拟精度最高(<em>R</em>=0.71),ERA-Interim次之(<em>R</em>=0.53),CFSR最低(<em>R</em>=0.50);体现出3套数据不同的同化方案和数据源导致模拟效果的不同;(2)降水的年内变化上,3套再分析数据之间具有较好的一致性,但对[OBS]均表现出高估,并且对强降水月份(3,4月)高估幅度最大;(3)3套数据对海拔500~1 000 m地区的降水模拟精度最好,超过1 000 m后,随海拔升高模拟精度下降。以上规律可为3套数据的订正及其在中亚地区气候变化研究中的应用提供科学依据。
|
| [32] |
A reliability assessment of upper-level reanalysis datasets over China [J].中国区域夏季再分析资料高空变量可信度的检验 [J].
利用全球探空资料(IGRA)对1989—2008年美国国家环境预报中心(NCEP)和大气研究中心(NCAR)再分析资料、NCEP和美国能源部(DOE)再分析资料、NCEP气候预测系统再分析资料(CFSR)、日本气象厅25年再分析资料(JRA-25)、欧洲数值预报中心再分析资料(ERA-Interim)和美国国家航空航天局(NASA)现代回顾性再分析资料(MERRA)的高空变量在中国地区对流层中高层的可信度进行了初步的检验.分析结果表明:再分析资料对中高层位势高度和温度的夏季平均气候态具有较好的再现能力,其EOF的时空变化特征与观测吻合也较好;再分析资料的绝对湿度值较观测结果要偏大,其中MERRA与观测最为接近.再分析资料不能很好地反映经向风的夏季平均气候态及年际变化特征,EOF的时空模态和观测偏离也较大.总体而言,NCEP/NCAR、NCEP/DOE及NCEP/CFSR对这些变量的再现能力较JRA-25、ERA-Interim和MERRA弱.
|
| [33] |
A Description of the Fifth-Generation Penn State/NCAR Mesoscale Model (MM5), NCAR/TN-398+STR[R] . |

 甘公网安备62010202000687
/
| 〈 |
|
〉 |


