
刘西川 , 高太长, 贺彬晟, 刘磊, 印敏, 宋堃
国防科技大学气象海洋学院,江苏 南京 211101
Liu Xichuan, Gao Taichang, He Binsheng, Liu Lei, Yin Min, Song Kun
中图分类号: P412.4
文献标识码: A
文章编号: 1001-8166(2018)12-1223-14
通讯作者:
收稿日期: 2018-08-21
网络出版日期: 2018-12-10
版权声明: 2018 地球科学进展 编辑部
基金资助:
作者简介:
First author:Liu Xichuan(1985-), male, Qinghe County, Hebei Province, Lecturer. Research areas include atmospheric physics and atmospheric measurement technology. E-mail: liuxc85@gmail.com
作者简介:刘西川(1985-),男,河北清河人,讲师,主要从事大气物理与大气探测技术研究.E-mail:liuxc85@gmail.com
展开
摘要
随着智能手机及嵌入式传感器的发展和普及,出现了公众利用智能手机探测大气环境参数的非专业探测手段,无需额外专用仪器,具有硬件成本低、时空分辨率高、时空覆盖广等优点,成为专业大气探测的有效补充。在气象业务、科研和公众服务等领域具有广阔的应用前景。目前我国在非专业大气探测方面的研究较少,为了充分发挥这一非专业探测手段的效能,在分析现有智能手机及嵌入式传感器技术现状的基础上,重点介绍了智能手机应用于降水、气温、气压、气溶胶和辐射等参数测量的技术现状,提出应该从加强机理研究、挖掘可用信源、数据质量控制、大数据处理技术以及与业务、科研、服务的匹配衔接等方面开展研究,推动智能手机参与大气探测的研究与应用。
关键词:
Abstract
With the development and popularization of smartphones and embedded sensors, a non-professional atmospheric measurement method by using smartphones carried by the public has been proposed recently. Without extra dedicated instrument, this method has many advantages, such as low hardware cost, high spatio-temporal resolution, and wide coverage, and it can supplement the professional atmospheric measurement methods, which has broad applications in the meteorological operation, scientific research, public service, and other fields. At present, the research on the non-professional atmospheric measurement in China is limited. In order to make full use of this method, this paper briefly outlined the states of existing smartphones and embedded sensors, highlighted the measurement of precipitation, air temperature, pressure, aerosols, and radiation by smartphones. To promote the development of smartphones for atmospheric measurement, future research should focus on mechanism study, available sources exploration, data quality control, big data processing, joining and matching with operation, research and service, etc.
Keywords:
目前,全球的气象观测站网还很不均匀,在人口稀少的区域往往缺少基础观测数据;尽管标准气象站和气候站网在高密度人口区域的分布比较密,但是受到经费的限制,并不能完全实现实时和高时空覆盖[1],不能满足城市规划[2]、热岛效应监测[3]、洪水灾害预警[4]、气候和健康评估、临近预报、模式同化和评估等方面的应用。IPCC发现[5],极端天气事件需要在频率、时间和强度等方面加强观测,因此需要对出现在高人口密度区域的大气状况和天气现象进行高分辨率和高密度的观测。但是,传统气象观测业务和科学研究中大气探测主要利用专用传感器和专业手段,受观测站点稀疏、专用传感器采样少、人工维护成本高等因素的限制,难以进一步提高观测资料的时空分辨率和覆盖范围。
近年来随着蜂窝无线通信网、嵌入式传感器和物联网的发展,GPS、加速度计、陀螺仪、背景光传感器、相对湿度传感器、电池温度传感器、环境温度传感器、光通量传感器和摄像头等越来越多的传感器嵌入到智能手机中,这些传感器可以获取地理位置、光照、气压、温湿度等环境变量,这些变量不仅可以用于定位、导航等一般应用,而且也可以用于降水、气温、湿度、气压、风、辐射等要素的辅助探测[6]。这些非专业气象探测以蜂窝通信网和智能手机为感知单元,以移动互联网为传输渠道,以公众广泛参与为主要特点,其典型例子是CoCoRaHS[7]和mPING[8]等,通过招募公众科学家[9],以业余气象站和传感器、智能设备和社交媒体/web2.0等多种方式开展大气探测[1]。
将非专业手段应用于大气探测,利用公共传感器定期采集数据,并通过因特网传输。这样人们不仅是简单的数据消费者,同时也是重要的数据提供者[10]。利用非传统非专业手段来弥补专业大气探测手段的不足,在未来将扮演一个非常重要的角色,尤其是在人口密集分布但是缺少数据或者传统气象站数量减少的区域[11],智能手机应用于大气探测,有望成为大气探测技术的增长点和突破点,将在社会公共气象服务领域发挥重要作用[12]。
本文在分析现有智能手机及其传感器技术现状的基础上,介绍了智能手机应用于降水、气温、气压、气溶胶和辐射等大气环境参数测量的技术研究现状及进展,最后分析了关键技术,并对利用智能手机开展大气探测的前景进行了展望。
目前移动通信正在蓬勃发展,截止到2015年底,全球通信基站数量超过600万个,手机数量超70亿部,智能手机近20亿部[13]。到2018年9月,中国大陆范围内通信基站近640万个,移动电话用户总数达15.5亿,智能手机数近13亿[14]。其中,4G用户占移动电话用户的74.3%,构成了数量庞大的移动互联网。利用这些便利的基础设施,公众利用智能手机参与感知大气,并通过移动互联网实时上传包括位置信息在内的感知信息;服务器将数量庞大、种类繁多的感知信息进行采集、处理和质量控制,最后反演重构得到大气状况;根据不同的需要,还可以将反演的大气状况实时推送给智能手机用户。这样就构成“公众感知—采集上传—反演重构—推送公众”的自激闭环。
根据手机嵌入式传感器测量大气环境参数的原理,可以将传感器分为常规传感器、专用传感器和间接传感器3类,其中,常规传感器在一般智能手机上均有装备,比如电池温度传感器、照度传感器等;专用传感器主要在近几年的新款智能手机上装备,如环境温度传感器,气压传感器和湿度传感器;间接传感器并不直接探测大气参数,而是在常规或专用传感器工作时用于辅助判断,比如利用加速度计得到的运动信息来判断用户是否在室外,只有在室外采集的数据才是具有代表性的气象参数[15]。
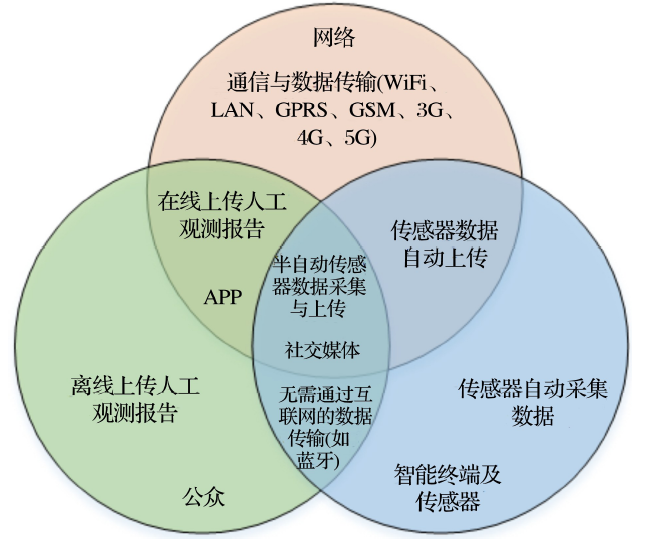
公众、互联网、智能终端及传感器构成了公众参与大气探测的3个核心要素,其中,公众是参与大气探测的主体,网络是探测信息的传递渠道,智能终端及传感器是探测大气的感知单元。三者构成的探测体系如图1所示[1]。公众可以离线上传人工观测报告,也可以利用手机APP依托互联网络在线上传观测报告,也可以通过蓝牙等在智能终端之间传递探测信息;智能终端及传感器自动采集数据,可以直接上传到服务器,也可以在用户的干预或补充后上传到服务器;公众将人工观测或仪器辅助观测的结果上传或分享到Twitter、微信、微博等社交媒体。大量分布式公众或终端获取的数据,经大数据分析后得到天气信息,不仅可以用于相关的科学研究和业务保障,提高科学与应用价值,还可将危险天气预警信息直接推送到公众端,对于公共气象服务也有积极的促进意义。公众参与大气探测的主要方法和典型案例如表1所示。
图1 公众、互联网、智能终端及传感器联合的公众参与大气探测新方式[
Fig.1 A new atmospheric measurement method by public, internet, intelligent terminal and sensor[
表1 公众参与大气探测的分类、方法和典型案例[
Table 1 Classification, methods, and typical cases of public participation in atmospheric measurement[
| 分类 | 基本方法 | 测量内容 | 典型案例 |
|---|---|---|---|
| 公众科学家 | 志愿者和业余爱好者等社会公众利用目测或辅助仪器开展观测,并在线提交结果 | 冰雹 降水 | Community Collaborative Rain, Hail and Snow Network(CoCoRaHS) (http:∥www.cocorahs.org/) meteorological Phenomenon Identification Near the Ground (mPING) (http:∥www.nssl.noaa.gov/projects/ping/) |
| 社交媒体 | 用户利用Twitter、微信、微博等社交媒体上传大气相关的照片,通过大数据分析后得到天气状况,还可用于危险天气预警 | 降雪 暴风雨 | UK snow map (http:∥uksnowmap.com/) Twitcident (http:∥twitcident.com/) SnowTweets project (http:∥snowcore.uwaterloo.ca/snowtweets/index.html) |
| 非专业仪器 | 利用非专业的气象传感器、单要素或多要素业余气象站等仪器自动获取大气要素 | 温湿度 降水谱 NO2/CO | Global Learning and Observations to Benefit the Environment (GLOBE) (www.globe.gov) NOAA Citizen Weather Observer Program (CWOP) (http:∥wxqa.com/) Air Quality Egg (http:∥airqualityegg.com) |
| 智能终端 | 基于智能手机采集嵌入传感器数据,通过建立模型反演得到相关的气象要素 | 温湿度 气溶胶 气压 降水 | Weather Signal (http:∥weathersignal.com/) OpenSignal (http:∥www.opensignal.com) iSPEX aerosol measuring sensor (www.ispex.nl) PressureNet (http:∥pressurenet.cumulonimbus.ca/) 蜂窝通信网信号测量降水 |
召集公众志愿者进行有针对性的大气探测,并将观测资料提供给相关业务和科研机构,最早起源于1998年开始的CoCoRaHS(Community Collaborative Rain, Hail and Snow)[16]。在1997年美国科罗拉多州的一次洪水中,观测站网中的雨量计和天气雷达均漏测了强降水,由此Nolan Doeskin提出建立志愿者观测网络——CoCoRaHS来弥补专业观测的不足[7]。
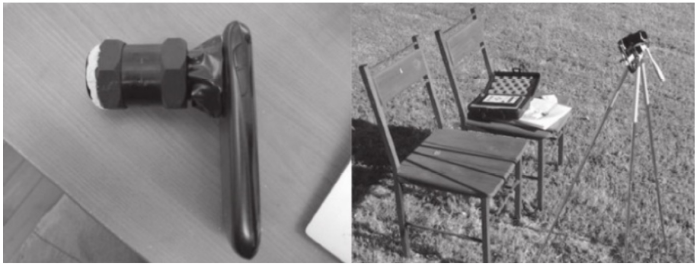
CoCoRaHS的探测仪器主要包括1个10 cm直径的标准雨量计和1个2.5 cm厚的泡沫聚苯乙烯板(上面覆盖金属箔),分别用来测量降水量和冰雹数量及大小(图2)。经过简单培训后,志愿者可通过网站或手机将总降水量、降水强度、冰雹的起止时间、冰雹的大小、种类、下落角度以及造成的相关损失等信息上报到CoCoRaHS中心,最后生成全国范围的降水分布。目前,CoCoRaHS的志愿者数量已由2004年的1 036个发展到2015年的超过20 000个,覆盖范围包括美国全境、波多黎各和加拿大的13个省。CoCoRaHS观测资料被应用于美国国家海洋和大气管理局(National Oceanic and Atmosheric Administration,NOAA)的国家环境信息中心(National Centers for Environmental Information,NCEI)和全球历史气候网(Global Historical Climatology Network,GHCN)中[17],与业务观察站网资料相结合,在临近预报、洪水雷暴预警、雷达估计降水以及气候研究等方面发挥了重要作用。
2011年美国在进行WSR-88D天气雷达双偏振升级改造时,业务观测站网难以为降水粒子识别算法的优化提供准确的高分辨率地面降水类型资料。因此美国NOAA国家风暴实验室(National Severe Storms Laboratory,NSSL)提出征集非专业人员利用移动智能设备提交降水类型资料,前期命名为mPING计划(mobile Precipitation Identification Near the Ground),后改名为mPING(meteorological Phenomena Identification Near the Ground)[8]。
参与者通过下载mPING APP或在线将所观测到的降水类型以及时间、地点等信息提交到mPING服务器[18],APP界面如图3所示。参与者不仅可以立刻得到所提供报告是否被采用的反馈,而且还可以看到其他参与者提交的降水观测报告。前期mPING可以提交13种类型的降水,但是与地面自动气象站相比,非专业的参与者难以区分霰和冰粒,往往容易误判为湿雪,因此后期将降水类型分为雨、雪、冻雨和冰粒4种。尽管区分类型有限,但是已经覆盖了大部分的降水,具有较好的代表性。Pehoski[19]通过研究mPING的冰雹数据库发现,如果参与报告的用户密度足够大,报告的一致性会大大增强。mPING资料经过质量控制后,对于提高双偏振雷达的降水类型识别精度有着积极的推动作用[20],同时在数值预报模式[21]、高速和航空的地面结冰监测等方面也有重要的应用价值[22]。
Niforatos等[23]设计了集传感器数据采集与用户上报为一体的Atmos应用,用户可以上报当前状况和预测结果,在12个国家得到应用。实验[24]发现,当移动用户上报当前状况时结果比较准确,但是精度在一天中并不稳定,随着时间的变化而变化。传感器结果与人工判断结果相结合,可以进一步提高判断结果的准确性[15]。
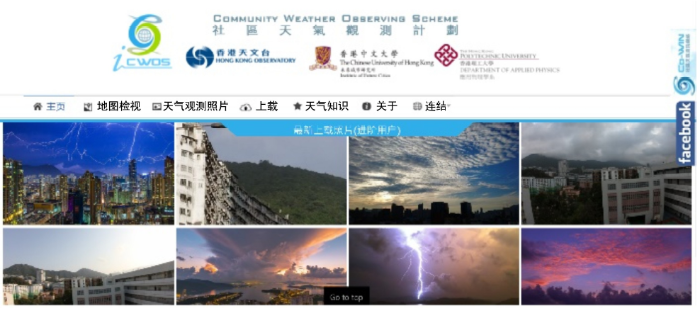
在国内方面,智能手机及移动互联网也已经开始应用于气象服务。2011年11月香港天文台与香港理工大学提出了“社区天气观测计划”[25],市民可以通过网站、社交网络和智能手机APP等方式上传天气照片或天气观测报告,与公众分享(图4)[26]。随着微博、微信的广泛应用和普及,人们不仅可以实时得到推送天气预报结果,也可以通过订阅号、发布微博、直播等方式将当地的天气状况进行分享[27,29]。
目前,利用智能手机进行参与式气象感知[30]和公共气象服务[31]的应用正在迅速发展。“墨迹天气”APP等通过推广实景天气来召集公众观测并共享天气。福建省气象局的“知天气”[32]、上海市气象局推出的“上海知天气”等APP和微信公众号等,也是通过建立志愿者手机报告网络,对某些天气实况进行实时报告和分享。中国气象局组织河北省气象局等单位研发的“卦天”APP,利用人工智能技术,首次在智能手机平台实现了云状的智能识别,准确率达90%。江苏省气象局和南京市绿化园林局联合推出了梧桐飘絮预报APP,人们可以通过随手拍功能上传飘絮实景图片,对飘絮预报产品进行订正。市民参与天气观测,不仅有助于增加公众对天气和气候的兴趣和认识,而且可以为其他人出行、旅行等活动提供参考。
此外,用于大气探测的穿戴设备也开始出现并推广。上海市气象局推出的徽章式微型气象传感器、北京象辑公司推出的WeatherON随身气象站、中国科学院深圳先进技术研究院推出的Thermodo私人气象站、小米公司推出的米家温湿度传感器等,此类设备与智能手机相连接,即可实现气象信息的实时采集与分享。2016年,中国气象局提出积极培育气象发展新增长点[33],通过推动公众参与式气象观测预报、公众定制服务等新兴领域的发展,提高气象服务效益。未来公众参与探测有望在天气预报和气象服务保障等方面发挥重大作用。
手机信号在风雨天气往往会受到干扰而导致通话质量下降甚至中断,主要原因在于降水粒子对电磁波信号传播存在一定的衰减效应[34,35],这一效应在手机通信频段也同样存在。移动通信运营商为了保证用户的通话质量,在阴雨天常常采用提高信号发射功率的方法来补偿因天气干扰而有所减弱的通讯信号[36]。根据信号传播路径的不同,利用手机信号衰减效应反演降水可以分为利用手机—基站链路、手机—WiFi链路和基站—基站链路3种,其中,手机—基站链路直接用于手机端通话和数据业务,频率范围为800 MHz2.6 GHz;手机—WiFi链路用于小范围数据交换,频率范围为2.45.0 GHz;基站—基站链路主要用于基站端数据流通信,频率范围为338 GHz[37]。目前利用信号衰减效应反演降水以基站—基站链路为主,其他2种处于初步探索研究阶段。
利用基站—基站链路测量降水,是随着微波链路测雨技术的发展而发展的[38,39]。微波链路测雨技术最早于1977年由Atlas等[40]提出,早期是利用天气雷达发射的电磁波,后期则是利用广泛分布的商业微波中继链路信号和蜂窝通信网中的基站通信信号[41]。单条链路可以反演得到链路路径上的平均雨强和降雨量,多条链路组网就可以反演得到网络覆盖范围内的雨强和降雨量分布。
2003年开始,以色列Leijnse等[4245]建立了2条实验微波链路,验证了利用商用通讯微波链路测量降雨分布的可行性;2005年Messer等[46]探讨了利用蜂窝通信网建立降水监测网络的可行性,开展利用手机通信信号监测天气状况的研究;2007年Zinevich等[47]针对商业微波网络的结构不规则、频率和极化不一致等特点,建立了非线性层析模型,并提出了基于卡曼滤波的降水场动态重建技术[48];2009年Goldshtein等[49]提出了适用于较为稀疏的商业微波通讯网络覆盖区域的降雨场重建技术。
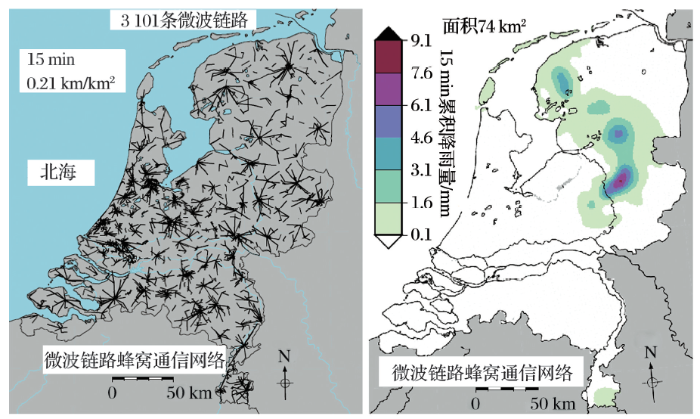
2009年开始,Overeem等[50]在荷兰全境利用2 400多条链路的多频段蜂窝无线网络进行了降雨实时监测实验[51]。为期2年半的观测实验[52]发现(图5),蜂窝无线网络测量夏季降水的效果较好,但测量冬季降水则有较大的偏差,主要原因在于固态或固液混合态降水粒子与雨滴的衰减特性不一致,导致反演算法无法适用于所有相态的降水。针对这一问题,Ostrometzky等[53]研究了雨、雪和雨夹雪的微波传播衰减模型,基于此提出了无需考虑降水类型的多链路反演降水模型,提高不同类型降水的适用性。Smiatek等[54]在德国开展了商用微波链路网络反演降水的实验,并探讨其在河川径流分析中的应用。
图5 荷兰的微波链路网络及反演结果
Fig.5 Microwave links network and inversed rainrate distribution in Netherland
目前,蜂窝通信网已经广泛覆盖了大部分陆地和沿海地区,因此对于缺乏地基天气雷达和大量雨量计网络的非洲国家而言,利用蜂窝通信网开展降水探测是一个非常有效的方法。Doumounia等[55]首次在西非布基纳法索开展了商业微波网络反演降水实验,与雨量计测量结果的相关性达到了0.8。目前正在向尼日尔和喀麦隆等其他非洲国家拓展[56]。
蜂窝无线网络反演结果与常规观测结果相融合,可以得到更为准确的街道级分辨率的结果,通过时间外推还可以提供未来3 h和6 h的临近预报[57],在强降水引发的洪涝灾害、山体滑坡监测预警、流域监测等方面发挥重要作用[58]。此外,利用蜂窝通信网的信号衰减效应探测雾[59,60]、污染[61]、湿度[62]等其他气象要素的研究也刚刚开始,未来也将发挥重要作用。
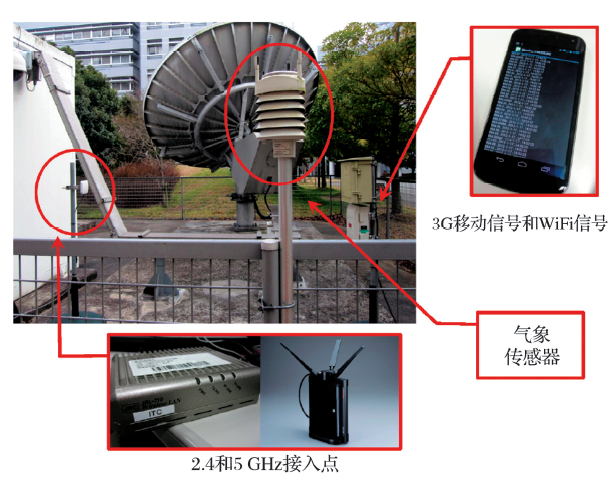
在手机—基站链路、手机—WiFi链路方面,气象条件对低频信号传播的衰减相对较弱,但是仍然存在一定的影响[63]。Helhel等[64]发现地物沾湿对900 MHz和1 800 MHz信号传播分别有13 dB和36 dB的影响。Dalip[65]和Usman等[66]分别研究了湿度、气压、温度等大气条件对GSM信号传播的影响。Zamora等[67]基于智能手机研究了3 GHz,2.4 GHz和5 GHz WiFi信号与强降雨的相关关系(图6)。实验发现,5 GHz WiFi信号与降水强度的相关性最好,同时还发现手机信号对降水带来的湿度变化也有一定敏感性。从而进一步验证了利用手机信号测量降水以及其他气象要素的潜力。
国内方面,国防科技大学气象海洋学院围绕微波链路测雨技术开展了系统研究[38,39],在系统研究降水导致微波衰减特性的基础上[34,35,68,69],研究了基于微波链路的降雨场反演方法[70],搭建微波链路测量平台并开展实验[71],研究了基于支持向量机[72]和基于非球形雨衰模型[73]的微波链路雨强反演方法,研究并验证了基于微波链路的天气雷达衰减订正方法[74,75]。目前正在开展低频手机信号反演降水的研究。
利用智能手机进行温度的测量主要包括利用外置温度传感器、内置环境温度传感器和内置电池温度传感器3种。其中,外置温度传感器则是通过外接专门的温度传感器来测量空气温度或人体温度,通过蓝牙无线或耳机有线传输数据,主要用于可穿戴设备;三星Galaxy S4和S5等部分手机内置了环境温度传感器,主要用于检测环境温度对手机工作的影响;所有智能手机的电池均内置了温度传感器,主要用于监测手机内部及电池的温度,防止温度过高而损坏手机。前两者可以直接测量气温,但是配备相关传感器的智能手机较少,而且大多用于运动、医疗和人体健康监测等方面,并未应用于专门的气象探测,而电池温度传感器则是每个智能手机必备的,手机数量众多,通过建立根据电池温度来推测环境温度的模型,就可以广泛地用于获取气温资料。
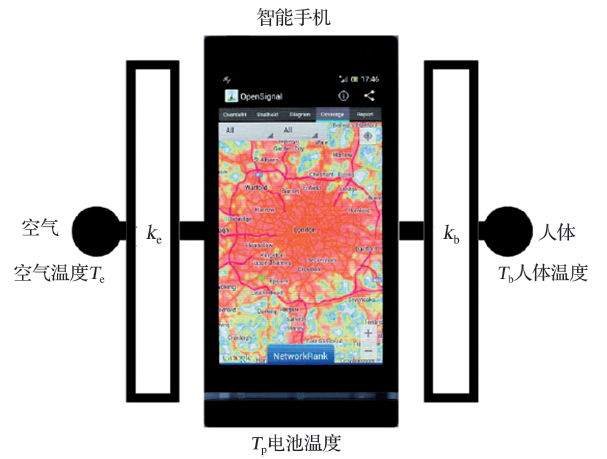
由于电池内置温度传感器受到手机本身温度和携带者体温的影响,无法直接获取环境温度,要根据电池温度来估计环境温度,首先需要建立一个基于智能手机的热量传输模型[76](图7)。
假设智能手机紧挨着携带者身体,智能手机产生的热量与传输到身体和环境的热量达到平衡;2个相邻系统的传导热流与二者温度差成正比,而且忽略对流、辐射和外部热源的影响;那么根据一定范围内一定数量手机的日平均电池温度就可以估计得到日平均气温:
式中:
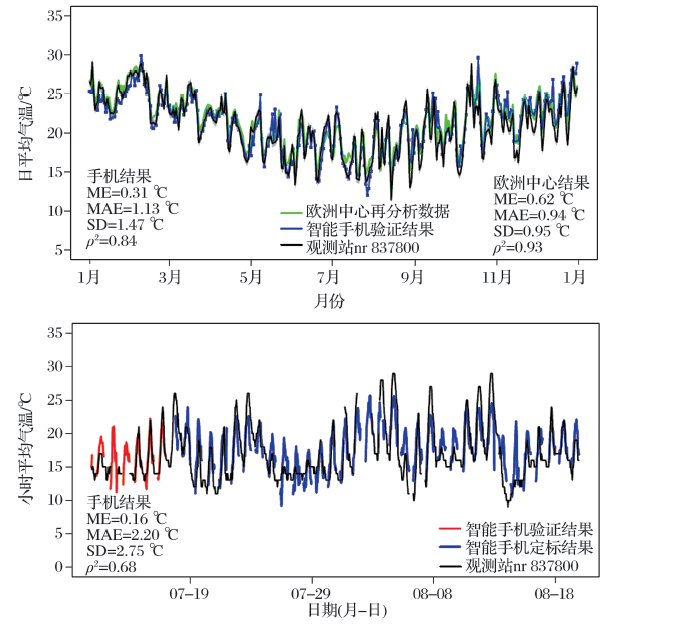
2012年Overeem等[76]采集了洛杉矶、巴黎、莫斯科、布宜诺斯艾利斯、伦敦、墨西哥城、罗马、圣保罗共8个城市220万部手机的数据,地点覆盖了不同气候区,通过筛选、剔除和时空平均,最终得到了城市日平均气温和智能手机日平均电池温度的关系。基于这一方法反演得到的城市日平均气温与自动气象站观测结果有很好的相关性,二者平均绝对误差为1.45 ℃,平均偏差仅为-0.28 ℃。Pape等[77]和Droste等[78]在巴西圣保罗市开展了2年的观测实验,利用某品牌的系列型手机,不仅可将日平均气温平均绝对误差和平均偏差提高到0.98 ℃和0.02 ℃,而且可以进一步提高时间和空间分辨率,每小时平均气温的平均绝对误差和平均偏差达到2.20和0.16 ℃(图8),智能手机反演结果经过自动气象站的校准后,精度也得到进一步提高。利用数量众多的智能手机获取城市地区的平均气温,将有助于提高温度的空间分辨率,对于研究城市微气象、热岛效应、农业气象及气温日变化规律研究等有重要意义[79]。
图8 利用智能手机电池温度反演的日平均气温(上)和小时平均气温(下)(巴西圣保罗地区)
Fig.8 Average daily air temperature (above) and hourly air temperature (below) inversed by battery temperature of smartphone in São Paulo, Brazil
2012年开始,三星Galaxy Nexus、摩托罗拉 XOOM和小米2等Android手机和iPhone 6及后续型号手机开始使用嵌入式压力传感器[80],主要目的是通过测量气压来判断手机所处位置的海拔高度,进而提高手机定位的精度,目前广泛应用于海拔高度测量、辅助导航、室内定位、穿戴和健康医疗等领域。此外,根据气压的急剧变化,还可以用于预警天气,应用在一些天气预报类APP中。
Mass等[81]针对智能手机中LPS331 MEMS气压传感器的相对精度和绝对精度(分别为±0.2 hPa和±2.6 hPa),而且具备温度补偿功能,首先提出了利用智能手机嵌入式气压传感器获取气压资料的系统研究。尽管与温湿度相比,气压的测量受智能手机携带者的影响较小,但是仍无法直接将其应用于数值天气预报,必须首先经过校准、预处理和筛选。Kim等[82]研究了基于线性回归的智能手机气压资料的订正方法,并与自动气象站的观测数据进行了验证。随后研究了基于聚类和回归分析的智能手机气压订正方法[83,84],2014年在韩国京畿道(面积10 000 km2)开展了为期半年的观测实验,实验结果表明,经过订正后的智能手机气压资料可以达到与自动气象站气压资料相当的精度。
Madous等[85]研究了智能手机获取的气压资料在中尺度天气分析和预报中的应用,与常规观测站网相比,智能手机获取的气压资料具有极高的空间分辨率。利用集合卡曼滤波对1 h气压及变压进行资料同化,预报结果表明,同化智能手机气压资料后,对于未来1 h气压、风和降水等要素的预报精度有一定改善作用。Hanson[86]修改了PSU WRF-EnKF数据同化模式,使得高分辨率的智能手机气压资料作为海平面气压进行直接同化。敏感性实验表明,智能手机气压资料的同化对于提高2 m温度和10 m风等要素预报的精度都有积极作用。集合预报结果发现,智能手机资料具有与常规地面观测资料相类似的预报效果,因此对于某些缺乏常规观测仪器地区,就可以利用广泛分布的智能手机填补这一空白,为高分辨率数值预报模式提供高分辨率观测资料,从而保证数值天气预报的效果。
智能手机摄像头主要有CCD(Charge Coupled Device)和CMOS(Complementary Metal-Oxide Semiconductor)2种,与CCD相比,CMOS的耗电低、价格低,传输速率快,是目前的主流。随着智能手机的普及,摄像头不仅越来越广泛地应用于人脸识别、心率与脉搏检测、定向与测距等不同领域,在大气辐射和气溶胶的测量中也展现出了极大的潜力。
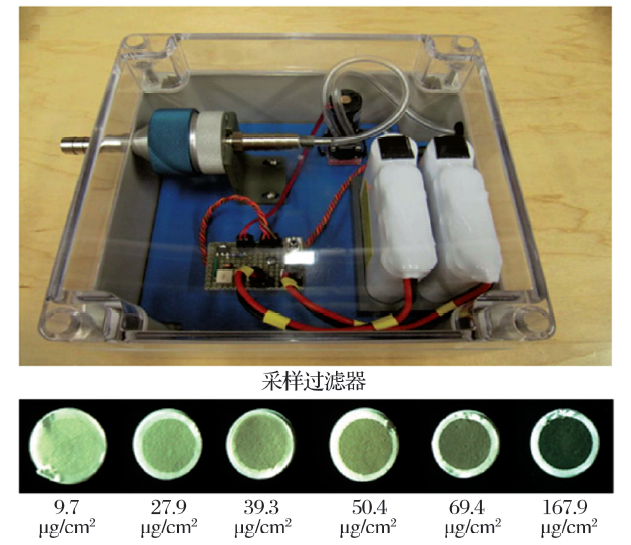
Ramanathan等[87]首先提出了采用手机拍照测量黑炭粒子的方法,设计了一个微型气溶胶过滤采样器(图9)。空气样本采样后滤纸会呈现不同的灰度,手机对滤纸拍照并传输到成分检测中心,通过与标准校验片的对比得到黑炭的质量浓度,其测量范围可从0.1 μg/m3到200 μg/m3。该方法具有操作简便、实时和低功耗的优点,但是需要仪器体积较大,不便于随时探测。
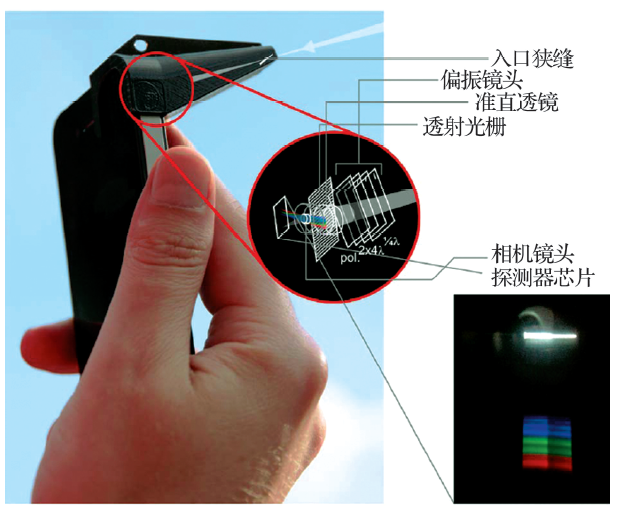
荷兰莱顿大学的Snik等[88]首先设计了适用于手机摄像头的外置分光偏振计(iPhone Spectropolarimeter for Planetary Exploration, iSPEX),iSPEX直接安装在iPhone手机摄像头位置,根据多角度扫描天空背景计算得到不同波段(480580 nm)的线偏振度来反演大气气溶胶的大小、形状和化学成分等[89](图10)。在荷兰征集了8 000多名志愿者进行探测,据此可以得到2 km分辨率的气溶胶光学厚度分布[90]。该手段在实时性、灵活性、时空分辨率、覆盖范围和气溶胶参数方面,可以作为常规星基和地基气溶胶遥感方式的有效补充。通过对志愿者相关专业知识的培训[91],采用众包方式[92]收集并分析iSPEX观测资料,对于评估细颗粒物带来的健康风险,理解大气气溶胶和气候变化之间的关系等具有重要意义。目前,iSPEX是公众参与度最高的智能手机探测气溶胶的手段。
Igoe等[93,94]在研究LG Optimus手机CMOS摄像头(图11)对长波紫外辐射响应特性以及不同温度暗响应特性的基础上,建立了像素值和辐射的关系。基于此讨论了晴空无云条件下利用太阳辐射反演气溶胶光学厚度的方法[95],在380 nm和340 nm波段处的反演误差在5%10%[96]。设计了用于计算长波紫外辐射(UVA,320~420 nm)波段的气溶胶光学厚度和直接辐射的安卓客户端[97],并分别研究了手机摄像头对UVA宽带和窄带辐射的测量能力[98,99]。将摄像头的外层防护滤镜移除后,还可以把测量范围扩展到中波紫外辐射(UVB,280320 nm)[100],Igoe分别选取了三星Galaxy SII、iPhone 5 m和诺基亚Lumia 800 3种手机摄像头,利用图像RGB三原色方法测试了摄像头对UVB的暗响应、温度响应、辐射响应和频谱响应[101],研究发现3种手机经过辐射订正后,均能够用来定量探测UVB辐射,但是其响应特性各不相同,因此需要分别建立色比与入射光辐照度、曝光时间和图像数字信息的关系模型。
图11 Igoe等利用智能手机装配滤光片与实验场景
Fig.11 Smartphone assembled with filters and experimental scene by Igoe
Cao等[102]在iPhone 4摄像头前加装中性密度滤光片和黄、绿、蓝3种颜色滤光片,通过分析晴空无云和有云条件下成像RGB值的差异,基于langley外推法研究了利用白、蓝、绿、黄4个通道图像反演光学厚度的方法(图12)。反演光学厚度的不确定度为0.12左右,广泛部署后,可以通过适当的定标来提高区域的反演精度。Tith等[103]研究了利用手机CMOS摄像头测量Gamma射线的方法,选取三星Galaxy GT-S5570 mini、Galaxy SII、Galaxy SIII和Huawei P7 4种手机,用黑胶带盖住手机摄像头,研究铯-137和铱-192发射Gamma射线在CMOS图像传感器上留下的光斑,通过定标后,就可以根据光斑的计数得到Gamma射线剂量率。
图12 太阳图像及其反演的气溶胶光学厚度
Fig.12 Solar images and inversed aerosol optical thickness
国内方面,刘肖阳[104]研究了基于参与式感知的空气质量检测系统,在图像归一化处理和分析PM2.5图像特征的基础上,提出了利用手机拍摄图像进行PM2.5浓度估计的方法。钱堃[30]设计并实现了基于Android参与式气象信息感知系统,研究了基于内嵌传感器、扩展传感器、位置信息和拍照图像等数据的参与式感知系统框架体系。
利用手机摄像头进行大气气溶胶和辐射的测量,仅需要加装滤光片和相关APP,操作简便,公众须经简单培训才可参与探测。基于大量手机参与探测的资料,可以在与人体健康有关的大气环境、污染和辐射监测等方面发挥重要作用。
总结智能手机对大气探测的贡献,可以将公众参与大气探测方法分为3类:一是利用智能手机及传感器对气象要素进行实时测量与采集;二是召集志愿者参与测量或对天气实况的拍摄;三是利用手机无线链路的衰减效应来反演大气。目前,公众参与大气探测这一非专业手段在降水、气温、气压、气溶胶和辐射测量等方面的测量能力已得到初步验证。我国智能手机的数量居于全球首位,下一代5G通信也即将布网,若能充分利用智能手机参与感知大气,将极大提高大气探测的时空分辨率和覆盖范围,成为大气探测专业手段的有效补充,在气象业务、科研和公众服务等领域具有广阔的应用前景。为了推动智能手机参与感知大气技术的深入研究及应用推广,下一步应重点研究如下关键技术:
(1)加强机理研究。智能手机采集的数据与各气象要素之间的相互关系相互耦合,难以准确提取有效信息。因此需要加强多个传感器与温压湿等气象要素的影响机理研究,采用数值模拟及实验研究等手段,建立大气影响下的智能手机传感器采集及信号传播模型,为智能手机参与感知大气奠定理论基础。
(2)挖掘可用信源。除了嵌入式传感器以外,外置的小型风传感器、PM2.5传感器等传感器与手机连接,也可以实现大气的实时探测。因此需要尽可能多地挖掘可用信源,依托物联网的发展,由智能手机向其他智能终端扩展,由单一传感器向多传感器联合扩展,为智能手机参与感知大气提供充分的信息来源。
(3)数据质量控制。智能手机所处环境随机变化,非气象因素的强背景噪声条件下,有效和无效信息均可能淹没在采集的数据中。因此需要考虑智能手机工作场景,建立多源资料的质量控制模型,研究单点和区域信源联合的数据质量控制方法,实现对无效数据的剔除。
(4)大数据处理技术。智能手机数量庞大,单次采集可能超过数百万个样本,除了直接反算和间接反演外,还要从大样本数据中提炼出隐藏的有价值的信息。这就需要引入大数据处理的思想,采用神经网络、机器学习等智能算法研究传感器数据与大气条件的非线性关系,建立映射模型库,利用数据挖掘的方式重构大气状况。
(5)与其他观测网络的结合。要解决气象和气候观测资料不足的问题,不仅要扩大智能手机测量大气测量的功能与应用,还要注重与其他观测网络相结合,比如利用民航飞机、商船、火车、汽车等平台建立流动大气监测系统[105],多种非专用手段共同弥补专用探测手段的不足,为提高数值天气预报水平提供重要数据。
(6)与业务、科研、服务的匹配衔接。公众利用智能手机参与感知大气所获取的资料,直接应用于天气监测与预报的业务、科学研究及公共气象服务,将发挥更大的效益。因此应在建立非专业探测资料共享渠道的基础上,考虑非专业资料的时空分辨率和准确性,研究非专业探测资料与专业探测资料的数据融合方法,建立参与感知资料的同化模型。
The authors have declared that no competing interests exist.
| [1] |
Crowdsourcing for climate and atmospheric sciences: Current status and future potential [J].
ABSTRACT Crowdsourcing is traditionally defined as obtaining data or information by enlisting the services of a (potentially large) number of people. However, due to recent innovations, this definition can now be expanded to include ‘and/or from a range of public sensors, typically connected via the Internet.’ A large and increasing amount of data is now being obtained from a huge variety of non-traditional sources02–02from smart phone sensors to amateur weather stations to canvassing members of the public. Some disciplines (e.g. astrophysics, ecology) are already utilizing crowdsourcing techniques (e.g. citizen science initiatives, web 2.0 technology, low-cost sensors), and while its value within the climate and atmospheric science disciplines is still relatively unexplored, it is beginning to show promise. However, important questions remain; this paper introduces and explores the wide-range of current and prospective methods to crowdsource atmospheric data, investigates the quality of such data and examines its potential applications in the context of weather, climate and society. It is clear that crowdsourcing is already a valuable tool for engaging the public, and if appropriate validation and quality control procedures are adopted and implemented, it has much potential to provide a valuable source of high temporal and spatial resolution, real-time data, especially in regions where few observations currently exist, thereby adding value to science, technology and society.
|
| [2] |
The application of climate information in urban planning in China: Retrospect and future prospect [J].我国城市规划中气候信息应用回顾与展望 [J].
<p>城市规划中气候信息的应用经历了从早期的风玫瑰图利用到考虑风、温、湿、压等要素的气候适宜性分析以及目前关注城市通风环境、热环境以及污染敏感区的城市环境气候图技术的历程。气候信息获得的途径也从数量极为有限的基本气象观测站资料到空间加密的自动气象站资料、更精细的气象数值模式以及精细化地理信息技术的应用。同时,细化的技术导则和规范的建立以及不同行业间的联合发文有力推动了气候信息的实际应用。此外,研究展示了近年开展的伊犁、深圳、北京实际案例主要内容。最后,针对未来我国将根据大气环流特征和生态环境承载能力、走优化城镇空间布局和城镇规模结构的新型城镇化道路,从工作层面和技术层面给出了需要不断完善并深入研究的几个重点。</p>
|
| [3] |
Hourly variation of surface urban heat island over the Yangtze river delta urban agglomeration [J].长三角城市群表面城市热岛日内逐时变化规律 [J].
表面城市热岛多时间尺度变化的遥感研究已取得了阶段性进展。然而,受限于热红外遥感模型与数据的不足,目前典型城市群表面城市热岛的日内逐时变化规律仍不清楚。以MODIS(Moderate-resolution Imaging Spectrometer)遥感影像为主要数据源,结合地表温度日内变化INA08模型,率先模拟并分析了长三角城市群在夏、冬两季的表面城市热岛空间格局与热岛强度的逐时变化特征。结果表明:在夏季,日内所有城市整体而言均呈现热岛效应,但由于城市植被或水体的降温作用,白天至上半夜(08:00~21:00)部分城市存在相对"冷点",而这些"冷点"在21:00之后基本消失。此季节内城市热岛强度与地表温度日内逐时变化规律相似,两者均在上午迅速上升,并于12:00~14:00到达峰值,而后逐渐下降,并持续至次日日出前。在冬季,多数城市在白天出现了"城市冷岛",但"冷岛"多在午后至傍晚(14:00~17:00)消失,此后所有城市均恢复为"热岛"。此季节内城市热岛强度与地表温度日内逐时变化规律区别较大,且以农田和森林为背景计算的城市热岛强度的逐时变化趋势存在明显差异,前者在日内到达峰值的时间(约18:00)显著晚于后者(约13:30)。
|
| [4] |
Investigation on snow characteristics and their distribution in China [J].中国积雪特性及分布调查 [J]. |
| [5] |
|
| [6] |
Sensors and the city: A review of urban meteorological networks [J].
The heterogeneous nature of urban environments means that atmospheric research ideally requires a dense network of sensors to adequately resolve the local climate. With recent advances in sensor technology, a number of urban meteorological networks now exist with a range of research or operational objectives. This article reviews and assesses the current status of urban meteorological networks, by examining the fundamental scientific and logistical issues related to these networks. The article concludes by making recommendations for future deployments based on the challenges encountered by existing networks, including the need for better reporting and documentation of network characteristics, standardized approaches and guidelines, along with the need to overcome financial barriers via collaborative relationships in order to establish the long-term urban networks essential for advancing urban climate research. Copyright 2013 Royal Meteorological Society
|
| [7] |
The community collaborative rain, hail, and snow network: Informal education for scientists and citizens [J].
This article discusses the Community Collaborative Rain, Hail, and Snow Network (CoCoRaHS), an informal education for scientists and citizens. The CoCoRaHS originated in the aftermath of a flash-flood storm that dropped more than 12-inches of rain over a small portion of Fort Collins, Colorado on July 28, 1997, and a similar storm the following evening over the grasslands of northeastern Colorado. These floods were responsible for several fatalities and at least 200 million-dollars in property damage.
|
| [8] |
MPING: Crowd-sourcing weather reports for research [J].
http://journals.ametsoc.org/doi/abs/10.1175/BAMS-D-13-00014.1
|
| [9] |
From Conservation to Crowdsourcing: A Typology of Citizen Science [C]. |
| [10] |
People-Centric Urban Sensing [C]. |
| [11] |
Implementation Plan for the Global Observing System for Climate in Support of the UNFCC [R]. |
| [12] |
Crowdsourcing user-generated mobile sensor weather data for densifying static geosensor networks [J].
Reliable weather estimation traditionally requires a dense network of meteorological measurement stations. The concept of participatory sensing promises to alleviate this requirement by crowdsourcing weather data from an ideally very large set of participating users instead. Participation may involve nothing more than downloading a corresponding app to enable the collection of such data, given... [Show full abstract]
|
| [13] |
Urban sensing APP—A mobile tool for urban sensing and climate monitoring in smart cities [C]∥ |
| [14] |
|
| [15] |
Understanding the potential of human-machine crowdsourcing for weather data [J].
61Sensor readings revealed significant variations during users’ commuting times.61User inputs were more accurate in estimating actual temperature than sensor inputs.61Bagged decision trees with user reported temperature achieved the lowest error rate.61A 32-month public deployment on Google Play Store.
|
| [16] |
|
| [17] |
CoCoRaHS the evolution and accomplishments of a volunteer rain gauge network [J]. |
| [18] |
|
| [19] |
A Crowdsourced Hail Dataset: Potential, Biases, and Inaccuracies [D]. |
| [20] |
The value of dual-polarization radar in diagnosing the complex microphysical evolution of an intense snowband [J].
The northeast U.S. extratropical cyclone of 8 x80; 9 February 2013 produced blizzard conditions and over 0.6 x80; 0.9 m (2 x80; 3 feet) of snow from Long Island through eastern New England. A surprising aspect of this blizzard was the development and rapid weakening of a snowband to the northwest of the cyclone center with radar reflectivity factor exceeding 55 dBZ. Because the radar reflectivity within snowbands in winter storms rarely exceeds 40 dBZ, this event warranted further investigation. The high radar reflectivity was due to mixed-phase microphysics in the snowband, characterized by high differential reflectivity (ZDR > 2 dB) and low correlation coefficient (CC < 0.9), as measured by the operational dual-polarization radar in Upton, NY (KOKX). Consistent with these radar observations, heavy snow and ice pellets (both sleet and graupel) were observed. Later as the reflectivity decreased to less than 40 dBZ, surface observations indicated a transition to primarily high-intensity dry snow, consistent with lower-tropospheric cold advection. Therefore, the rapid decrease of the 50+ dBZ reflectivity resulted from the transition from higher-density, mixed-phase precipitation to lower-density, dry-snow crystals and aggregates. This case study indicates the value that dual-polarization radar can have in an operational forecast environment for determining the variability of frozen precipitation (e.g., ice pellets, dry snow aggregates) on relatively small spatial scales.
|
| [21] |
Verifying forecast precipitation type with mPING [J].
Not Available
|
| [22] |
The uncertainty of precipitation-type observations and its effect on the validation of forecast precipitation type [J].
react-text: 199 Accurate prediction of mixed-phase precipitation remains challenging for numerical weather prediction models even with high-resolution and a sophisticated explicit microphysics scheme and diagnostic algorithm to designate surface precipitation type. Since mixed-phase winter weather precipitation can damage infrastructure and produce significant disruptions to air and road travel, incorrect... /react-text react-text: 200 /react-text [Show full abstract]
|
| [23] |
Atmos: A hybrid crowdsourcing approach to weather estimation [C]∥ |
| [24] |
"Weather With You": Evaluating report reliability in weather crowdsourcing [C]∥ |
| [25] |
Community weather observation program in hongkong [C]∥香港社区天气观测计划 [C]∥ |
| [26] |
|
| [27] |
Development and trend of weather information dissemination service in China [J].新中国气象信息传播服务发展及未来趋势分析 [J].
分析了电视、广播、报刊、电话、电子显示屏等传统媒体及微信、微博、气象网站、手机app等新媒体在气象信息传播服务中的发展变化.分析发现,近十年传统气象信息传播方式所占份额出现下降趋势,而微信、微博、手机app等新媒体发展迅速,社会力量开始参与气象信息传播服务.新时期,气象信息服务呈现新特征,气象信息产品内容更加丰富、形式更加多样、提供主体更加多元,气象在国民经济中的地位更加突出.气象信息传播方式更新迭代,反映出7大趋势:发布主体与传播主体渐相分离;气象信息附加值将被深度挖掘;创新力量加入气象服务市场,民营气象公司发展势头强劲;气象事业单位重在提供基础性、公益性气象数据服务以及平台服务和技术支撑,其核心任务是提高预报预测准确率和精细化水平;以用户需求为导向的精细化气象服务是气象事业立根之本;气象信息服务多技术融合发展及全球一体化发展趋势.随着经济社会的发展和技术的进步,社会对气象服务的需求越来越大,气象服务解决的将不仅仅是气象信息传播的问题,更是解决如何提供更具针对性的气象服务、发挥气象信息更大社会价值的问题.新技术的发展使气象与其他行业融合成为可能,借助国家“互联网+”战略,气象服务市场将大有可为.
|
| [28] |
Application and development on Twitter in public meteorological service [J].
微博在公共气象服务中的应用及发展 [J].
随着社会的发展进步,公众对公共气象服务的需求和要求也日益增高,在这样的历史发展背景下,公共服务产品和信息传播途径只有不断创新,不断满足公众的需求,才能得到不断地发展。作为一种新的公共气象服务尝试。气象微博的出现,为整个公共气象服务市场增色不少。
|
| [29] |
Application and development of WeChat in meteorological service [J].微信在气象服务中的应用及发展 [J].
对微信在气象服务中的应用及发展进行讨论,从微信适合气象服务的特点,如服务内容丰富、功能选择更多、无收信压力、一对一的互动、跨平台沟通无障碍、无资费困扰更加免费、盈利模式的扩展等几个方面进行介绍;再根据不同的微信平台进行区别,推荐简单气象信息服务可选择公众平台订阅号,更加完善且内容丰富的的气象业务服务则可选择公众平台的服务号;通过"扫一扫"二维码、提高服务质量绑定忠实用户、与朋友圈微博进行互动等方式对气象微信进行推广使用,使微信的群发与后台功能得到一定的改善,使气象服务提供者更便予与公众交流,更好地向公众推广。
|
| [30] |
Design and Implementation of Participative Weather Information Perception System Based on Android [D].基于Android参与式气象信息感知系统设计与实现 [D]. |
| [31] |
Overview of the development of mobile weather APP service in China [J].等国内手机天气app服务发展状况概述 [J].
正"有10个手机天气app的下载量超过350万,份额达97.5%;墨迹天气下载量遥遥领先,达到近3亿,份额占48%"。1 手机天气app发展概况1.1手机天气app总量利用关键词"天气"在360手机助手、豌豆荚、安卓市场、91助手、PP助手等几大主流(1)手机助手中检索,检索结果如表1。综合这几大手机助手的检索结果,截至2015年10月,初步统计结果显示手机天气
|
| [32] |
Development of meteorological service system on the mobile client [J].基于客户端移动信息化气象服务平台 [J].
在移动互联网快速发展时代,为推动福建气象服务移动信息化发展,满足气象服务多元化、本地化、移动化和互动社交需求,研发国内首个具备气象服务产品、平台属地化展示和集约管理的"知天气"掌上气象手机客户端服务系统,为决策气象、行业专项、公众服务用户提供属地化、智能化、定制化的气象服务。从系统架构方面阐述了系统结构、组成逻辑、数据流转和业务流程,分析关键技术成果转化开发,详解主要功能实现方式方法和气象服务产品的精细化、专业性和信息化方向。经过近7年的实践运行,证明系统具有安全稳定性高、性能可靠、管理高效集约等特点,产品受众面广,提升了气象服务质量和效益。
|
| [33] |
China Will Actively Cultivate New Growth Points of Meteorological Development [N]. ,我国将积极培育气象发展新增长点 [N]. |
| [34] |
Effect of different precipitation on millimeter wave propagation characteristics [J].不同类型降水对毫米波传播特性的影响研究 [J].
为了提高复杂降水条件下毫米波传播衰减的评估精度,通过分析多个地区的降水谱特征,得出具有代表性的层状云降雨、积层混合云降雨、积雨云降雨以及干雪、湿雪的谱分布参数,然后结合降水粒子的形状、相态、介电模型,计算降水体目标在毫米波波段的散射特性.结果表明,降水强度不是唯一影响毫米波传播衰减的因素;降水粒子相态、谱分布、入射波频率和温度等对毫米波传播特性均有不同程度的影响,其中谱分布和数密度是影响降雨对毫米波衰减的主要因素;冰水构成比例是影响降雪对毫米波衰减的主要因素;不同相态的降水,尤其是干雪、湿雪和雨对毫米波传播影响的差异较大;而温度的影响较小.并建立了考虑谱分布和温度的降水衰减模型.
|
| [35] |
Effects analysis of rainfall on microwave transmission characteristics [J].降雨对微波传输特性的影响分析 [J].
在归一化雨滴谱分布、雨滴的介电模型和Mie散射理论的基础上计算群雨滴在微波波段的散射和衰减特性,讨论分析雨滴谱分布、降雨强度、入射波频率和温度等因素对微波传输特性的影响.数值模拟结果表明,不同谱分布的群雨滴散射能力从大到小依次为JD,MP,Gamma和JT分布,降雨强度对微波传输特性的影响最大,入射波频率次之,温度的影响最小.所得出的结论有助于准确评估降雨对微波传输的影响以及提高利用测雨雷达和毫米波雷达等定量探测降水的精度.
|
| [36] |
Weather monitoring by the signals of mobile communication networks [J].用手机网络信号监测天气状况 [J].
手机是人们现代日常生活中的基本通讯联络手段之一.用手机网络信 号可以来监测天气状况.手机微波通讯专家和气象专家的联合研究发现:数字频段通讯微波返回信号的衰减强烈地受近地面雨滴的大小和分布的影响,数字频段通讯 微波返回信号的衰减可获得地面降水的高空间分辨率即时监测资料.研究表明:利用通讯信号衰减测得的降雨值与传统雨量筒的观测值非常接近,精确度要明显高于 雷达观测的结果;并且可以大大弥补传统雨量筒监测的布设站点数量少、空间分辨率低的不足.对强降雨和洪涝的高空间分辨率实时监测,具有重要意义.现在科学 工作者已研制出了用手机网络信号监测降雨的专利产品.深信用手机网络信号监测降雨是人类对降水观测的又一次重大技术进步,必将对高空间分辨率的精细降雨预 报产生推动作用.
|
| [37] |
Wireless access methods in the relay link between base stations of mobile communication network [J].移动通信基站中继接入中的几种无线接入方式 [J].
结合数字微波、固定无线接入(M M D S、LM D S)、自由空间光通信(FSO )等技术的特点以及移动通信网络的建设发展,对移动通信基站中继接入中采用无线接入手段的应用情况做了总结。
|
| [38] |
Precipitation measurement by microwave links and key techniques analysis [J].微波链路测量降水新方法及关键技术分析 [J].
准确测量降水对于气象、水文、地质以及洪涝等自然灾害的监测与预警有着重要的意义。随着手机、通讯等多种微波信号的广泛分布,出现了一种利用微波链路的衰减、极化等信息来反演区域降水分布的新方法,具有直接与降水粒子相作用、时空分辨率高、覆盖范围广等优势。本文在分析微波链路反演降水研究现状的基础上,重点分析了频段选取、降雨起止时间判别、反演建模等关键技术,为促进微波链路反演降水在我国的应用提供技术支撑。
|
| [39] |
Research on microwave link measurement of precipitation [J].微波链路测量降水研究综述 [J].
利用微波链路测量降水是降水测量的最新技术,具有作用于近地面大气、时空分辨率高等优势。文章总结了微波链路测量降水方法的发展现状和技术难点,结合微波通信的实际应用,分析了频段的选择依据、雨衰减量的精确测量和正演模型的精确建模需要考虑的因素,指出降水起始时间的准确识别和区域化反演算法是解决该方法实用化问题的关键技术,为利用微波链路测量降水的进一步研究提供了借鉴。
|
| [40] |
Path-and area-integrated rainfall measurement by microwave attenuation in the 1-3 cm Band [J].
Abstract At a wavelength of about 0.9 cm, microwave attenuation is demonstrated to be linearly related to rainfall rate and independent of drop size distribution and temperature. In addition, practical methods for measuring path- and area-averaged rainfall rate are reviewed. A compromise between maximum path-averaged rainfall rate sensitivity and minimum sensing errors may be achieved by the use of one-way methods between the transmitter and the receiver, with a wavelength of 1.5 to 2.0 cm. Corrections for nonspherical drops and for multiple scattering are also discussed.
|
| [41] |
A new atnlospheric observation method by earth electromagnetic network [J].地球电磁密织网大气探测新方法 [J].
地球电磁密织网是指客观存在于地球陆地或海表上空的多源电磁波信号的统称。这些信号不仅包括自然物体的自身辐射,还包括微波中继通讯、星地通信、卫星导航信号、无线宽带、手机移动通信等人工发射信号。这些电磁波信号时刻与大气海洋环境发生相互作用,科学家从微波通信信号的衰减中发现了探测降水的可行性,从GPS导航信号的折射延迟中发现了探测温湿廓线的可行性,等等。这些均是零星利用电磁密织网进行大气探测的典型案例。事实上,虽然电磁波无处不在,但由于其间存在复杂的多路径效应、网络拓扑结构的无规则改变以及电磁波发射源的非合作性等等难题,这一“海量气象信息隐性携带者”一直难以被有效利用。地球电磁密织网既是信息传输的网络,同时又是信息感知的网络。本文提出充分利用地球电磁密织网这一有利工具,突破多路径效应下电磁波与多种气象要素的相互作用机理、动态自适应的电磁波进行区域气象要素反演方法、非合作多源电波脉动数据的气象信息挖掘与综合应用等关键技术,基于现有通信卫星、导航卫星、通信链路、无线蜂窝网等多源电磁波信号,建立一种系统利用地球电磁密织网进行大气探测的新方法。该方法不仅可以作为传统大气探测手段的有效补充,而且具有全球覆盖性和形式多样性,具有获取全球范围大气信息的能力,因此在未来具有广阔的应用前景。
|
| [42] |
Hydrometeorological Application of Microwave Links: Measurement of Evaporation and Precipitation [D].
|
| [43] |
Hydrometeorological application of a microwave link: 1. Evaporation [J].
A method to estimate areal evaporation using a microwave link (radio wave scintillometer) in combination with an energy budget constraint is proposed. This radio wave scintillometry-energy budget method (RWS-EBM) is evaluated for its applicability in different meteorological conditions and for its sensitivity to various variables (the structure parameter of the refractive index of air C n 2, the total available energy R n G, the wind velocity u, the effective average vegetation height h 0, and the correlation coefficient between the temperature and humidity fluctuations r TQ ). The method is shown to be best suited for use in wet to moderately dry conditions, where the latent heat flux is at least a third of the total available energy (i.e., Bowen ratio 2). It is important to accurately measure the total available energy and the wind velocity as the RWS-EBM is most sensitive to these variables. The Flevoland field experiment has provided the data, obtained with a 27-GHz radio wave scintillometer (over 2.2 km), a large-aperture scintillometer (also 2.2 km), and four eddy covariance systems, which are used to test the RWS-EBM. Comparing 92 daytime measurements (30-min intervals) of the evaporation estimated using the RWS-EBM to that determined in alternative manners (eddy covariance and two-wavelength scintillometry) leads to the conclusion that the method provides consistent estimates (coefficient of determination r 2 = 0.85 in both cases) under relatively wet conditions.
|
| [44] |
Hydrometeorological application of a microwave link: 2. Precipitation [J].
The suitability of a 27-GHz microwave link for measuring path-averaged precipitation is investigated. Theoretical analyses show that the specific attenuation of an electromagnetic signal at this frequency varies nearly linearly with the rainfall intensity, which is ideal for line-integrating instruments. The dependence of this relation on the drop size distribution and on the temperature is small, so that uncertainties in these variables do not play large roles in the estimation of rainfall intensity. Data from an experiment with a 4.89-km microwave link and a line configuration of seven tipping bucket rain gauges are used to test whether this instrument is indeed suitable for the estimation of path-averaged rainfall. Results from this experiment show that the attenuation due to wet antennas can have a significant effect on the retrieved rainfall intensity. However, when a two-parameter wet antenna correction function is applied to the link data, comparisons with the rain gauge data show that the instrument is indeed well suited for the measurement of path-averaged rainfall
|
| [45] |
Rainfall measurement using radio links from cellular communication networks [J].URL 摘要
We investigate the potential of radio links such as employed by commercial cellular communication companies to monitor path-averaged rainfall. We present an analysis of data collected using two 38-GHz links during eight rainfall events over a 2-month period (October-November 2003) during mostly stratiform rainfall in the Netherlands. Comparisons between the time series of rainfall intensities estimated using the radio links and those measured by a nearby rain gauge and a composite of two C band weather radars show that the dynamics of the rain events is generally well captured by the radio links. This shows that such links are potentially a valuable addition to existing methods of rainfall estimation, provided the uncertainties related to the reference signal level, signal level resolution, wet antenna attenuation, and temporal sampling can be resolved.
|
| [46] |
Environmental monitoring by wireless communication networks [J].
The global spread of wireless networks brings a great opportunity for their use in environmental studies. Weather, atmospheric conditions, and constituents cause propagation impairments on radio links. As such, while providing communication facilities, existing wireless communication systems can be used as a widely distributed, high-resolution atmospheric observation network, operating in real time with minimum supervision and without additional cost. Here we demonstrate how measurements of the received signal level, which are made in a cellular network, provide reliable measurements for surface rainfall. We compare the estimated rainfall intensity with radar and rain gauge measurements.
|
| [47] |
Estimation of rainfall fields using commercial microwave communication networks of variable density [J].
The use of commercial microwave radio networks which are a part of cellular communication infrastructure for mapping of the near-the-ground rainfall is challenging for many reasons: the network geometry in space is irregular, the distribution of links by frequencies and polarizations is inhomogeneous, and measurements of rain-induced attenuation are distorted by quantization. A non-linear tomographic model over a variable density grid is formulated, and its applicability and performance limits are studied by means of a simulated experiment using a model of a real microwave network. It is shown that the proposed technique is capable to accurately measure integrated near-the-ground rainfall amounts over the area of 3200 km 2 with a bias smaller than 10%. In urban area, where the density of microwave links is high, the average correlation in space between the simulated model and reconstructed rainfall fields reaches 0.89 over the variable density grid with average cell size of 5.7 km 2 and 0.74 when interpolated into the rectangular grid with pixel size 0.775 0.775 km 2, for the quantization interval of 0.1 dB.
|
| [48] |
Frontal rainfall observation by a commercial microwave communication network [J].
ABSTRACT ABSTRACT A novel approach for reconstructionof rainfall spatial-temporal dynamics,from a wireless microwave,network is presented. It employs a stochastic space-time model based on a rainfall advection model, assimilated using a Kalman filter. The technique is able to aggregate the data in time and space along the direction of motion of the rainfall field, which is recovered from the simultaneous observation of a multitude of microwave links. The technique is applied on a standard microwave,communication network used by cellular communication system and comprising 23 microwave links, and it allows observation of near-surface rainfall at the temporal resolutions of 1 minute. The accuracy of the method is demonstrated by comparing instantaneous rainfall estimates with measurements from five rain gauges, reaching correlations of up to 0.85 at 1 minute time interval with bias and RMSE of -0.2 mm h,1. The results are compared to those of other spatial reconstruction techniques. The proposed dynamic,rainfall reconstruction approach can be applied to larger scale dynamic rainfall assimilation methods, enabling interpolation over data-void regions and straightforward incorporation of data from other sources, e.g. rain gauge networks and radars. 3
|
| [49] |
Rain rate estimation using measurements from commercial telecommunications links [J].
In this paper, we propose a novel method for estimating the rain rate at any given point within a two-dimensional plain using measurements of the received signal level extracted from power control records of an existing deployed fixed wireless communication network. The path-average rainfall intensity along each microwave radio link is estimated from the rainfall-induced attenuation using an empirical relationship. The proposed algorithm consists of appropriate preprocessing of the links data, followed by a modified weighted least squares algorithm to infer on the rain level at any given point in space. The algorithm can be used to interpolate measurements onto a regular grid to construct a two-dimensional rainfall intensity field. The novelty of the proposed estimation method comes from its ability to be applied on an arbitrary geometry network comprising different microwave links lengths and frequencies and allowing easy integration of rain gauge observations into the model to improve estimation accuracy. The technique has been applied to an existing fixed wireless communication network comprising 22 microwave links covering an area of about 15times15 km2 and operating at carrier frequencies of about 20 GHz. The resulting rainfall field estimates have been compared to rain gauge stations in the vicinity and to weather radar data, showing good agreement.
|
| [50] |
Measuring urban rainfall using microwave links from commercial cellular communication networks [J].
The estimation of rainfall using commercial microwave links is a new and promising measurement technique. Commercial link networks cover large parts of the land surface of the earth and have a high density, particularly in urban areas. Rainfall attenuates the electromagnetic signals transmitted between antennas within this network. This attenuation can be calculated from the difference between the received powers with and without rain and is a measure of the path-averaged rainfall intensity. This study uses a 17-day data set of, on average, 57 single-frequency links from 2009 to estimate rainfall in the Rotterdam region, a densely populated delta city in Netherlands ( 1250 km, >1 million inhabitants). A methodology is proposed where nearby links are used to remove signal fluctuations that are not related to rainfall in order to be able to reliably identify wet and dry weather spells. Subsequently, received signal powers are converted to path-averaged rainfall intensities, taking into account the temporal sampling protocol and attenuation due to wet antennas. Link-based rainfall depths are compared with those based on gauge-adjusted radar data. In addition, the rainfall retrieval algorithm is applied to an independent data set of 21 rainy days in 2010 with on average 16 single-frequency links in the same region. Rainfall retrievals are compared against gauge-adjusted radar rainfall estimates over the link path. Moreover, the retrieval algorithm is also tested using high-resolution research link data to investigate the algorithm's sensitivity to temporal rainfall variations. All presented comparisons confirm the quality of commercial microwave link data for quantitative precipitation estimation over urban areas.
|
| [51] |
Country-wide rainfall maps from cellular communication networks [J].
Accurate and timely surface precipitation measurements are crucial for water resources management, agriculture, weather prediction, climate research, as well as ground validation of satellite-based precipitation estimates. However, the majority of the land surface of the earth lacks such data, and in many parts of the world the density of surface precipitation gauging networks is even rapidly declining. This development can potentially be counteracted by using received signal level data from the enormous number of microwave links used worldwide in commercial cellular communication networks. Along such links, radio signals propagate from a transmitting antenna at one base station to a receiving antenna at another base station. Rain-induced attenuation and, subsequently, path-averaged rainfall intensity can be retrieved from the signal's attenuation between transmitter and receiver. Here, we show how one such a network can be used to retrieve the space-time dynamics of rainfall for an entire country (The Netherlands, similar to 35,500 km(2)), based on an unprecedented number of links (similar to 2,400) and a rainfall retrieval algorithm that can be applied in real time. This demonstrates the potential of such networks for real-time rainfall monitoring, in particular in those parts of the world where networks of dedicated ground-based rainfall sensors are often virtually absent.
|
| [52] |
Two and a half years of country-wide rainfall maps using radio links from commercial cellular telecommunication networks [J]. |
| [53] |
Accumulated mixed precipitation estimation using measurements from multiple microwave links [J]. |
| [54] |
Potential of commercial microwave link network derived rainfall for river runoff simulations [J].
Commercial microwave link networks allow for the quantification of path integrated precipitation because the attenuation by hydrometeors correlates with rainfall between transmitter and receiver stations. The networks, operated and maintained by cellphone companies, thereby provide completely new and country wide precipitation measurements. As the density of traditional precipitation station networks worldwide is significantly decreasing, microwave link derived precipitation estimates receive increasing attention not only by hydrologists but also by meteorological and hydrological services. We investigate the potential of microwave derived precipitation estimates for streamflow prediction and water balance analyses, exemplarily shown for an orographically complex region in the German Alps (River Ammer). We investigate the additional value of link derived rainfall estimations combined with station observations compared to station and weather radar derived values. Our river runoff simulation system employs a distributed hydrological model at 100 100 m grid resolution. We analyze the potential of microwave link derived precipitation estimates for two episodes of 30 days with typically moderate river flow and an episode of extreme flooding. The simulation results indicate the potential of this novel precipitation monitoring method: a significant improvement in hydrograph reproduction has been achieved in the extreme flooding period that was characterized by a large number of local strong precipitation events. The present rainfall monitoring gauges alone were not able to correctly capture these events.
|
| [55] |
Rainfall monitoring based on microwave links from cellular telecommunication networks: First results from a West African test bed [J].
Abstract Rainfall monitoring based on commercial terrestrial microwave links is tested for the first time in Burkina Faso, in Sahelian West Africa. In collaboration with one national cellular phone operator, Telecel Faso, the attenuation on a 2965km long microwave link operating at 765GHz was monitored at 165s time rate for the monsoon season 2012. The time series of attenuation is transformed into rain rates and compared with rain gauge data. The method is successful in quantifying rainfall: 95% of the rainy days are detected. The correlation with the daily rain gauge series is 0.8, and the season bias is 6%. The correlation at the 565min time step within each event is also high. These results demonstrate the potential interest of exploiting national and regional wireless telecommunication networks for monitoring rainfall in Africa, where operational rain gauge networks are degrading and the hydrometeorological risk increasing.
|
| [56] |
Improving rainfall measurement in gauge poor regions thanks to mobile telecommunication networks [J].
Bulletin of the American Meteorological Society 2015 ; e-View doi: http://dx.doi.org/10.1175/BAMS-D-15-00164.1
|
| [57] |
Rain forecasts go mobile—Analysis of wireless communications data could give accurate weather at street level [J].
Real-time analysis of wireless communications data could improve weather forecasts around the world.
|
| [58] |
New trend in weather forecasting—Using mobile phone signals to predict rainfall [J].天气预报新趋势——利用手机信号预测降雨 [J].
正据Nature,2017,544:146-147报道,气象学家有望通过手机信号网络来预测降雨。天气预测的精度通常受限于观测站点的分布密度、遥感资料的使用以及计算机的运算能力。由于这些都需要高昂的经费投入,发展中国家和偏远地区无法获得精确的天气预测。但如果仅仅
|
| [59] |
The potential of commercial microwave networks to monitordense fog-feasibility study [J].
Here we show the potential for dense fog monitoring using existing measurements from wireless communication systems. Communication networks widely deploy commercial microwave links across the terrain at ground level. Operating at frequencies of tens of gigahertz, they are affected by fog and are, practically, an existing, sensor network, spatially distributed worldwide, which can provide crucial information about fog concentration and visibility. The goal of this paper is to show the feasibility for fog identification and intensity estimation. A method is proposed and is demonstrated by two cases of heavy fog that took place in Israel. During these events, fog covered wide areas (tens of kilometers) and caused severe decrease in visibility, dropping as low as several tens of meters. Liquid water content and visibility values were estimated using measurements from tens of microwave links deployed in the observed area for each event. Each of the links provided a single measurement which was taken simultaneously across all of the links in the system. The values were found to be in the range of 0.5-0.8 gr/m(3), high concentration values that match the maximum value range observed in field measurements carried out for prior studies in different test areas in the world. The visibility ranges calculated, between 30 and 70 m, fit the visibility assessments from the specialized measuring equipment operating in the observed area at the same time. These results point to the strong potential of the proposed technique.
|
| [60] |
Cellular network infrastructure—The future of fog monitoring? [J].
http://journals.ametsoc.org/doi/abs/10.1175/BAMS-D-13-00292.1
|
| [61] |
Using cellular communication networks to detect air pollution [J].
Abstract Accurate real time monitoring of atmospheric conditions at ground level is vital for hazard warning, meteorological forecasting, and various environmental applications required for public health and safety. However, conventional monitoring facilities are costly and often insufficient, for example, since they are not representative of the larger space and are not deployed densely enough in the field. There have been numerous scientific works showing the ability of commercial microwave links that comprise the data transmission infrastructure in cellular communication networks to monitor hydrometeors as a potential complementary solution. However, despite the large volume of research carried out in this emerging field during the past decade, no study has shown the ability of the system to provide critical information regarding air quality. Here we reveal the potential for identifying atmospheric conditions prone to air pollution by detecting temperature inversions that trap pollutants at ground level. The technique is based on utilizing standard signal measurements from an existing cellular network during routine operation.
|
| [62] |
The potential of microwave communication networks to detect dew-experimental study [J].
At microwave frequencies of tens of GHz, various hydrometeors cause attenuations to the electromagnetic signals. Here, we focus on the effect of liquid water films accumulating on the outer coverage of the microwave units during times of high relative humidity (RH). We propose a novel technique to detect moist antenna losses using standard received signal level (RSL) measurements acquired simultaneously by multiple commercial microwave links (MLs). We use the generalized likelihood ratio test (GLRT) for detecting a transient signal of unknown arrival time and duration. The detection procedure is applied on real RSL measurements taken from an already existing microwave network. It is shown that moist antenna episodes can be detected, information which provides the potential to identify dew, an important hydro-ecological parameter.
|
| [63] |
Development of propagation model by considering different climatic conditions [J].
Abstract: It is important to consider many technical issues before going to design and establish an expensive Wireless system. It is necessary to see the mathematical predictions or calculations of different parameters before going to design such type of systems. One of those parameters is path loss. Here the mathematical study of path loss is carried out in different climatic conditions like summer, winter, etc. The study helped to design better wireless network for the urban areas which has the same atmospheric conditions like Narnaul, Haryana (INDIA). The comparative study between fields measured data and path loss models shows that the Okumura path loss model is giving better results than other path loss models. Still it needs some modification to give accurate results in the mentioned environment. The modification of Okumura model is given by considering climatic effects along with the area factor in the above mentioned area. The goal of this paper is to analyze attenuation impact on the performance of a mobile station respectively on the received signal quality to the end user. In the end of the paper, two approaches have been followed to verify and test the developed Okumura path loss model. In the first approach the developed path loss model attenuation has been compared with reference attenuation of Fog and Rain which were given by M. Sridhar and Altshuler. In second approach a comparative analysis has been done between field measured data and the developed Okumura model in Hisar (Haryana, India).
|
| [64] |
Investigation of GSM signal variation dry and wet earth effects [J]. |
| [65] |
Effect of environmental parameters on GSM and GPS [J]. |
| [66] |
Instantaneous GSM signal strength variation with weather and environmental factors [J]. |
| [67] |
Radio signal-based measurements for localized heavy rain detection using smartphones [C]∥ |
| [68] |
Discussion on electromagnetic scattering characteristics of ice-water two-phases particles in atmosphere [J].大气中冰水两相粒子的电磁散射特性研究 [J].
为了研究大气中冰水两种相态共同存在时粒子的电磁散射特性,本文从Aden-Kerker散射理论出发,分别计算了外包水膜冰球和外包冰膜水球在S波段、C波段和X波段的电磁散射特性,讨论外层覆膜相态和厚度对粒子散射特性的影响;并在MP粒子谱分布和Gamma粒子谱分布的基础上,讨论了融化冰球和冻雨群粒子在S波段、C波段和X波段的衰减、散射、吸收和后向散射特性.结果表明,粒子的衰减截面和后向散射截面并不随外包膜厚度的增大呈现单调变化的趋势,而是与粒子的尺度参数有关,且在不同波段呈现不同的变化特征;融化冰球和过冷却雨的衰减系数、散射系数、吸收系数和后向散射系数与频率和降水强度呈正相关关系,其中MP分布的传播系数要比Gamma分布的传播系数大.此结论对于研究冰水两相粒子对电磁波的散射机制、提高天气雷达探测精度、改善冰水两相粒子的探测效果等具有重要意义.
|
| [69] |
Microwave characteristics of rain attenuation and its application in rainfall measurement [J].微波雨衰特性在降雨测量中的应用 [J].
利用微波链路雨衰测量值反演雨强是一种新型降雨测量方法,可以依托全球广泛分布的微波通信链路获取丰富的气象观测资料。本文在分析微波雨衰特性的基础上,首次进行了15~20GHz频段链路测量降雨的试验研究。试验设计了距离6km的视距微波通信链路,选择降雨前临界时间段内接收电平的均值作为雨衰计算的基准值,通过实际接收电平与基准接收电平的雨衰减差值反演计算实际降雨量。试验结果表明,降水强度为2~70mm/h时,该频段微波雨衰值变化显著,完全可以进行更精确空间尺度局部降水的实时测量,通过雨衰减值反演计算的降雨量值与雨滴谱仪的实际测量值有较好的相关性,分析了试验中的误差及误差产生的原因,为下一步在正演模型等方面的深入研究指明了方向。
|
| [70] |
Investigation of the inversion of rainfall field based on microwave links [J].基于微波链路的降雨场反演方法研究 [J].
本文基于微波雨衰的幂律关系,研究了使用微波链路反演降雨场 的方法,采用层析技术建立了降雨场反演模型。并利用 SIRT 算法与正则化算法实现对降雨场层析反演模型的求解。数值模拟结果表明,该模型与反演算法能够较为准确地重建降雨场强度与空间分布特征,能够提供高时空分辨 率的二维降雨强度分布。因此,利用微波衰减数据进行降雨探测可以作为常规的雨量计与天气雷达观测手段的有效补充。
|
| [71] |
Research on the method and experiment of path rainfall intensity inversion using a microwave link [J].基于微波链路的路径雨强反演方法及实验研究 [J].
从大气气体吸收衰减模型出发,基于微波雨衰特性和雨滴谱统计资料建立了微波链路降雨有效衰减的修正模型和视距微波链路的降雨反演模型.设计并搭建一条视距微波链路测雨实验系统,利用降雨反演模型反演了路径平均降雨强度,并与雨滴谱仪进行了同步对比.观测结果表明,视距微波链路降雨反演模型的反演雨强与雨滴谱仪测量结果的相关系数大多高于0.6,最高可达0.9647;累积降雨量的绝对误差大多在0.5 mm以内,最小偏差仅有0.0827 mm;相对偏差大部分在15%以内,最小相对误差为3.3415%.实验结果验证了微波链路反演降雨的有效性和准确性.
|
| [72] |
Method and experiment of rainfall intensity inversion using a microwave link based on support vector machine [J].基于支持向量机的微波链路雨强反演方法 [J].
为提高微波链路雨致衰减反演雨 强精度,在Mie散射理论、气体吸收衰减模型以及Gamma雨滴谱分布的基础上,将支持向量机引入到微波链路测量降水中,提出了基于支持向量机的微波链路 雨强反演方法,并开展了15—20 GHz频段的视距微波链路与地面雨滴谱仪的同步观测降雨实验.实验结果表明,基于支持向量机的微波链路雨强反演模型的反演雨强与实测雨强的相关系数全部高 于0.6,最高达到0.9674;雨强的均方根误差最小值为0.5780 mm/h,累积降雨量的绝对最小误差仅为0.0080 mm;相对偏差大部分在10%以内,最小偏差为0.7425%.实验结果验证了基于支持向量机的微波链路雨强反演方法的有效性、准确性和适用性,对于进一 步提高微波链路反演降雨精度、改善降水监测效果具有重要意义.
|
| [73] |
Method and experiment of path rainfall intensity inversion using a microwave link based on nonspherical rain-induced model [J].基于非球形雨衰模型的微波链路雨强反演方法 [J].
以T矩阵理论、Gamma谱分布为理论基础,基于Pruppacher-Beard降雨粒子模型,对OTT雨滴谱仪的Gamma谱参数历史资料与降雨强度值进行非线性拟合得到具有实地谱分布的幂律系数,建立适合于本地区的雨衰模型,提出了基于非球形雨衰模型的微波链路雨强反演方法,分析了温度对模型幂律系数的影响,并开展了15—20 GHz频段的视距微波链路与地面雨滴谱仪的同步观测降雨实验.实验结果表明:反演雨强的相关系数全部高于0.6,最高达到了0.96,RMSE最小值为0.79,累积降雨量的绝对偏差在2.47 mm以内,最小偏差仅为0.28 mm,相对误差低于1.84%.实验结果验证了基于非球形雨衰模型的微波链路雨强反演方法的有效性、准确性和适用性,对于进一步提高微波链路反演降雨精度、改善降水监测效果具有重要意义.
|
| [74] |
Regional attenuation correction of weather radar using a distributed microwave-links network [J]. |
| [75] |
Attenuation correction of weather radar reflectivity with arbitrary oriented microwave link [J]. |
| [76] |
Crowdsourcing urban air temperatures from smartphone battery temperatures [J]. |
| [77] |
Urban air temperature estimation from smartphone battery temperatures [C]∥ |
| [78] |
Using smartphone batteries as an urban thermometer [C]∥ |
| [79] |
Crowdsourcing urban air temperatures through smartphone battery temperatures in São Paulo, Brazil [J].
Crowdsourcing as a method to obtain and apply vast datasets is rapidly becoming prominent in meteorology, especially for urban areas where traditional measurements are scarce. Earlier studies showed that smartphone battery temperature readings allow for estimating the daily and city-wide air temperature via a straightforward heat transfer model. This study advances these model estimations by studying spatially and temporally smaller scales. The accuracy of temperature retrievals as a function of the number of battery readings is also studied. An extensive dataset of over 10 million battery temperature readings is available for S茫o Paulo (Brazil), for estimating hourly and daily air temperatures. The air temperature estimates are validated with air temperature measurements from a WMO station, an Urban Fluxnet site, and crowdsourced data from 7 hobby meteorologists' private weather stations. On a daily basis temperature estimates are good, and we show they improve by optimizing model parameters for neighbourhood scales as categorized in Local Climate Zones. Temperature differences between Local Climate Zones can be distinguished from smartphone battery temperatures. When validating the model for hourly temperature estimates, initial results are poor, but are vastly improved by using a diurnally varying parameter function in the heat transfer model rather than one fixed value for the entire day. The obtained results show the potential of large crowdsourced datasets in meteorological studies, and the value of smartphones as a measuring platform when routine observations are lacking.
|
| [80] |
Look at the Role of Pressure Sensors in Smart Phones [J].看看压力传感器在智能手机中的作用 [J].
正压力传感器首次在智能手机上使用是在Galaxy Nexus上,而之后推出的一些Android旗舰手机里也包含了压力传感器,如Galaxy S Ⅲ、Galaxy Note 2和小米2,不过大家对于压力传感器仍非常陌生。其实,压力传感器在这里是用来测量大气压的,但测量大气压对于普通的手机用户来说又有什么作用呢?海拔高度测量对于喜欢登山的人来说,都会非常关心自己所处的高度。海拔高度的测量方法,一般常用的有2种方式,一是通过GPS全球定位系统,二是通过测出大气压,然后根据气压值计算出海拔高度。由于受到技术和其它方面原因的限制,
|
| [81] |
Surface pressure observations from smartphones [J].
Not Available
|
| [82] |
Correcting air-pressure data collected by mems sensors in smartphones [J].
We present a novel correction method for air-pressure data collected by microelectromechanical pressure sensors embedded in Android-based smartphones, in order to render them usable as meteorological data. The first step of the proposed correction method involves removing the mechanically derived outliers existing beyond the physical limits and those existing outside 3 , as well as a reduction to the mean sea level pressure using the altitude data from digital elevation models. The second correction step involves classifying data by location and linear-regression analysis utilizing the temperature and humidity sensed by the smartphone to reduce correction errors by performing the analysis according to personalized settings. Air-pressure data obtained from smartphones is subject to several influential factors, depending on the users external environment. However, once corrected for spatial location, temperature, and humidity and for individual users after a comprehensive quality control, the corrected air-pressure data was highly reliable as an auxiliary resource for automatic weather stations.
|
| [83] |
Improved correction of atmospheric pressure data obtained by smartphones through machine learning [J].
A correction method using machine learning aims to improve the conventional linear regression (LR) based method for correction of atmospheric pressure data obtained by smartphones. The method proposed in this study conducts clustering and regression analysis with time domain classification. Data obtained in Gyeonggi-do, one of the most populous provinces in South Korea surrounding Seoul with the size of 10,000???km2, from July 2014 through December 2014, using smartphones were classified with respect to time of day (daytime or nighttime) as well as day of the week (weekday or weekend) and the user???s mobility, prior to the expectation-maximization (EM) clustering. Subsequently, the results were analyzed for comparison by applying machine learning methods such as multilayer perceptron (MLP) and support vector regression (SVR). The results showed a mean absolute error (MAE) 26% lower on average when regression analysis was performed through EM clustering compared to that obtained without EM clustering. For machine learning methods, the MAE for SVR was around 31% lower for LR and about 19% lower for MLP. It is concluded that pressure data from smartphones are as good as the ones from national automatic weather station (AWS) network.
|
| [84] |
A survey on data correction of observation and prediction using machine learning: Preliminary study for optimizing oil spill model [J]. |
| [85] |
Evaluating smartphone pressure observations for mesoscale analyses and forecasts [J]. |
| [86] |
Impact of Assimilating Surface Pressure Observations from Smartphones on a Regional, High Resolution Ensemble Forecast: Observing system simulation experiments [D]. |
| [87] |
A cellphone based system for large-scale monitoring of black carbon [J].
Black carbon aerosols are a major component of soot and are also a major contributor to global and regional climate change. Reliable and cost-effective systems to measure near-surface black carbon (BC) mass concentrations (hereafter denoted as [BC]) globally are necessary to validate air pollution and climate models and to evaluate the effectiveness of BC mitigation actions. Toward this goal we describe a new wireless, low-cost, ultra low-power, BC cellphone based monitoring system (BC_CBM). BC_CBM integrates a Miniaturized Aerosol filter Sampler (MAS) with a cellphone for filter image collection, transmission and image analysis for determining [BC] in real time. The BC aerosols in the air accumulate on the MAS quartz filter, resulting in a coloration of the filter. A photograph of the filter is captured by the cellphone camera and transmitted by the cellphone to the analytics component of BC_CBM. The analytics component compares the image with a calibrated reference scale (also included in the photograph) to estimate [BC]. We demonstrate with field data collected from vastly differing environments, ranging from southern California to rural regions in the Indo-Gangetic plains of Northern India, that the total BC deposited on the filter is directly and uniquely related to the reflectance of the filter in the red wavelength, irrespective of its source or how the particles were deposited. [BC] varied from 0.1 to 1 g m 3 in Southern California and from 10 to 200 g m 3 in rural India in our field studies. In spite of the 3 orders of magnitude variation in [BC], the BC_CBM system was able to determine the [BC] well within the experimental error of two independent reference instruments for both indoor air and outdoor ambient air. Accurate, global-scale measurements of [BC] in urban and remote rural locations, enabled by the wireless, low-cost, ultra low-power operation of BC_CBM, will make it possible to better capture the large spatial and temporal variations in [BC], informing climate science, health, and policy.
|
| [88] |
iSPEX: The creation of an aerosol sensor network of smartphone spectropolarimeters [C]∥ |
| [89] |
iSPEX: First results of aerosols measured by smartphones in the Netherlands [C]∥ |
| [90] |
Mapping atmospheric aerosols with a citizen science network of smartphone spectropolarimeters [J]. |
| [91] |
Citizen science on a smartphone: Participants' motivations and learning [J].
Abstract Citizen science provides researchers means to gather or analyse large datasets. At the same time, citizen science projects offer an opportunity for non-scientists to be part of and learn from the scientific process. In the Dutch iSPEX project, a large number of citizens turned their smartphones into actual measurement devices to measure aerosols. This study examined participants' motivation and perceived learning impacts of this unique project. Most respondents joined iSPEX because they wanted to contribute to the scientific goals of the project or because they were interested in the project topics (health and environmental impact of aerosols). In terms of learning impact, respondents reported a gain in knowledge about citizen science and the topics of the project. However, many respondents had an incomplete understanding of the science behind the project, possibly caused by the complexity of the measurements. The Author(s) 2015.
|
| [92] |
Smart phone science [J].智能手机科学 [J]. |
| [93] |
Characterization of a smartphone camera's response to ultraviolet a radiation [J].
As part of a wider study into the use of smartphones as solar ultraviolet radiation monitors, this article characterizes the ultraviolet A (UVA; 320 400 nm) response of a consumer complementary metal oxide semiconductor (CMOS)-based smartphone image sensor in a controlled laboratory environment. The CMOS image sensor in the camera possesses inherent sensitivity to UVA, and despite the attenuation due to the lens and neutral density and wavelength-specific bandpass filters, the measured relative UVA irradiances relative to the incident irradiances range from 0.0065% at 380 nm to 0.0051% at 340 nm. In addition, the sensor demonstrates a predictable response to low-intensity discrete UVA stimuli that can be modelled using the ratio of recorded digital values to the incident UVA irradiance for a given automatic exposure time, and resulting in measurement errors that are typically less than 5%. Our results support the idea that smartphones can be used for scientific monitoring of UVA radiation.
|
| [94] |
A method for determining the dark response for scientific imaging with smartphones [J].
The proliferation of smartphone technology has provided an unprecedented opportunity for greater community participation in collaborative scientific observations that were once out of reach due to cost, accessibility, and ease of use. Currently, there have been several applications making use of the various sensors included in a smartphone, particularly the image sensor, which has been used in a wide range of scientific endeavors including air quality and medicine. Like all digital image sensors, the smartphone sensor is subject to noise, particularly that related to dark current. The objective of this article is to present the development and testing of a method to determine the dark response that a smartphone camera may experience under different temperatures representative of the environmental conditions for scientific imaging. This has required the development and testing of a specially developed application. This was tested in the evaluation and analysis of the dark response of a smartphone camera for the range of 8 38 C. The mean of the dark response was relatively unchanged over this range. The method developed in this paper allows the rapid and easy determination of the dark response of smartphone image sensors, enabling this to be readily subtracted from the signal in the development of scientific investigations.
|
| [95] |
Evaluating UVA aerosol optical depth using a smartphone camera [J].
Abstract This research evaluates a smartphone complementary metal oxide semiconductor (CMOS) image sensor's ability to detect and quantify incident solar UVA radiation and subsequently, aerosol optical depth at 340 and 38002nm. Earlier studies revealed that the consumer grade CMOS sensor has inherent UVA sensitivities, despite attenuating effects of the lens. Narrow bandpass and neutral density filters were used to protect the image sensor and to not allow saturation of the solar images produced. Observations were made on clear days, free from clouds. The results of this research demonstrate that there is a definable response to changing solar irradiance and aerosol optical depth can be measured within 5% and 10% error margins at 380 and 34002nm respectively. The greater relative error occurs at lower wavelengths (34002nm) due to increased atmospheric scattering effects, particularly at higher air masses and due to lower signal to noise ratio in the image sensor. The relative error for solar irradiance was under 1% for observations made at 38002nm. The results indicate that the smartphone image sensor, with additional external narrow bandpass and neutral density filters can be used as a field sensor to evaluate solar UVA irradiance and aerosol optical depth. 08 2013 The American Society of Photobiology.
|
| [96] |
Development and Characterisation of a Modified Smartphone Camera for Determining UVA Aerosol Optical Depth [D]. |
| [97] |
Smartphone-based and roid APP for determining UVA aerosol optical depth and direct solar irradiances [J].
This research describes the development and evaluation of the accuracy and precision of an Android app specifically designed, written and installed on a smartphone for detecting and quantifying incident solar UVA radiation and subsequently, aerosol optical depth at 340 and 380 nm. Earlier studies demonstrated that a smartphone image sensor can detect UVA radiation and the responsivity can be calibrated to measured direct solar irradiance. This current research provides the data collection, calibration, processing, calculations and display all on a smartphone. A very strong coefficient of determination of 0.98 was achieved when the digital response was recalibrated and compared to the Microtops sun photometer direct UVA irradiance observations. The mean percentage discrepancy for derived direct solar irradiance was only 4% and 6% for observations at 380 and 340 nm, respectively, lessening with decreasing solar zenith angle. An 8% mean percent difference discrepancy was observed when comparing aerosol optical depth, also decreasing as solar zenith angle decreases. The results indicate that a specifically designed Android app linking and using a smartphone image sensor, calendar and clock, with additional external narrow bandpass and neutral density filters can be used as a field sensor to evaluate both direct solar UVA irradiance and low aerosol optical depths for areas with low aerosol loads.
|
| [98] |
Broadband direct UVA irradiance measurement for clear skies evaluated using a smartphone [J].
UVA wavelengths (320-400 nm) have been implicated in recent studies to contribute to melanoma induction and skin photoaging in humans and damage to plants. The use of smartphones in UVA observations are a way to supplement measurements made by traditional radiometric and spectroradiometric technology. Although the smartphone image sensor is not capable of determining broadband UVA irradiances, these can be reconstructed from narrowband irradiances, which the smartphone, with narrowband and neutral density filters, can quantify with discrepancies not exceeding 5%. Three models that reconstruct direct broadband clear sky UVA were developed from narrowband irradiances derived from smartphone image sensor pixel data with coefficients of determination of between 0.97 and 0.99. Reasonable accuracy and precision in determining the direct broadband UVA was maintained for observations made with solar zenith angles as high as 70 . The developed method has the potential to increase the uptake of the measurement of broadband UVA irradiances.
|
| [99] |
Evaluation of a smartphone sensor to broadband and narrowband ultraviolet a radiation [J].
Smartphone image sensor response is compared for broadband and narrowband (34002nm and 38002nm) UVA wavelengths (320–40002nm) based on previous studies that have demonstrated quantitative response to solar radiation at 38002nm and 34002nm to reconstruct broadband irradiance. This article compares broadband and narrowband sensing using a common readily accessible smartphone equipped with a broadband UVA filter that displayed strong sensitivity to long wavelength UVA irradiances from 37002nm with a maximum at 38002nm. However, the use of narrow passband and neutral density filters allowed quantitative observations at the biologically significant wavelength of 34002nm. Narrow passband filter observations also had less variation at 34002nm than observed for broadband measurements. The results indicate that the smartphone image sensor, with the addition of narrow passband and neutral density filters, is a viable tool for UVA observations, but is unsuitable for broadband filter measurements.
|
| [100] |
Characterisation of a smartphone image sensor response to direct solar 305 nm irradiation at high air masses [J].
61Novel means of measuring and quantifying solar 305nm radiation are proposed.61The use of a smartphone image sensor with only external filters was used.61The smartphone provides an inexpensive, accessible and accurate UVB measuring tool.61Accurate measurements of solar 305nm made at high air masses (>2)
|
| [101] |
Detection of Ultraviolet B radiation with internal smartphone sensors [J].
Smartphones have the potential to monitor ultraviolet radiation within the terrestrial solar spectrum. Additionally, the ability to accurately estimate personal ultraviolet exposure using a smartphone may one day allow an individual control of their ultraviolet exposure. Previous studies have demonstrated the detection of ultraviolet A from 320 to 40065nm with a smartphone. However, the measurement of ultraviolet B from 280 to 32065nm is desirable to monitor biological effects such as erythema. No previous reports have been reported for the detection of ultraviolet B detection with a smartphone camera. This study characterized the ultraviolet B response of smartphone cameras and shows that these devices detect this radiation without additional hardware. Three smartphones were tested in the ultraviolet B waveband for dark response, temperature response, irradiance response, and spectral response. The used protocols adhered to international standards where applicable. All characterized smartphones were sensitive to ultraviolet B radiation; however, each type provides a unique response.
|
| [102] |
Remote sensing of atmospheric optical depth using a smartphone sun photometer [J].
In recent years, smart phones have been explored for making a variety of mobile measurements. Smart phones feature many advanced sensors such as , capability, and accelerometers within a handheld device that is portable, inexpensive, and consistently located with an end user. In this work, a smartphone was used as a sun photometer for the remote sensing of atmospheric optical depth. The top-of-the-atmosphere (TOA) irradiance was estimated through the construction of Langley plots on days when the sky was cloudless and clear. Changes in optical depth were monitored on a different day when clouds intermittently blocked the sun. The device demonstrated a measurement precision of 1.2% relative standard deviation for replicate photograph measurements (38 trials, 134 datum). However, when the accuracy of the method was assessed through using optical filters of known transmittance, a more substantial uncertainty was apparent in the data. Roughly 95% of replicate smart phone measured transmittances are expected to lie within 11.6% of the true transmittance value. This uncertainty in transmission corresponds to an optical depth of approx. 0.12-0.13 suggesting the smartphone sun photometer would be useful only in polluted areas that experience significant optical depths. The device can be used as a tool in the classroom to present how aerosols and gases effect atmospheric transmission. If improvements in measurement precision can be achieved, future work may allow monitoring networks to be developed in which citizen scientists submit acquired data from a variety of locations.
|
| [103] |
Measurement of gamma-rays using smartphones [J].
The CMOS (Complementary Metal Oxide Semiconductor) image sensor of a smartphone has been known for its sensitivity to gamma-rays. In this research, some smartphones were selected and tested for measurement of gamma-rays emitted from Cesium-137 and Iridium-192 sources. During measurements, the phones were set in video mode while the camera lenses were covered with black adhesive tape to prevent light exposure. Interaction of gamma-rays with the CMOS appeared as flashing bright spots on the image. The bright spots were then counted by using the freely available ImageJ software. Preliminary results indicated that the number of bright spots increased linearly with increase of gamma-ray dose rate. An in-house Android application software was then developed for real-time counting of the bright spots. The application software also allowed users to input a calibration equation so that the phones could simultaneously convert the count rate to display in dose rate. This research demonstrated that, after appropriate calibration, smartphones could be used as gamma-ray measuring devices for radiation safety control involving high activity sources such as in industrial radiography, gamma-ray irradiation facility and medical treatment.
|
| [104] |
Research and Implementation of Air Quality Monitoring System Based on Participatory Sensing [D].基于参与式感知的空气质量检测系统的研究与实现 [D]. |
| [105] |
Mobile systems for monitoring the atmosphere and its environments based on commercial transport platforms [J].基于商用运输平台的流动大气和环境监测系统 [J].
<p>高时空精度大气观测资料的缺乏,仍是制约提高数值天气预报水平和深入开展大气科学研究的一个主要因素。为了克服这一问题,除了研制自动化程度高、测量精度高和性能价格比高的仪器设备来装备现有的定点大气观测网外,还应建设一些流动的大气监测系统,以获得常规大气观测台站空档间(如大洋、山区和荒漠等无人区)的天气现象和大气环境变化的信息。然而,在现有台站网之外,再重新建立并运行一个流动专业观测网,既不经济也是不现实的。随着交通和通信技术的快速发展,利用民用的交通运输工具(主要是商船、民航飞机、火车甚至长途汽车),加装大气环境监测传感器,逐步建立海陆空三位一体的流动大气环境监测系统已成为可能。</p>
|

 甘公网安备62010202000687
/
| 〈 |
|
〉 |


