

陆架边缘迁移轨迹研究现状及应用前景
[丛富云 , 徐尚
, 徐尚* ]
, 徐尚]
|
|


作者简介:丛富云(1992-),男,湖北潜江人,博士研究生,主要从事层序地层与沉积储层方面的研究.E-mail:fuyuncong@hotmail.com
迁移轨迹分析是沉积学与层序地层学关注的热点和前沿研究领域。与传统的分析方法相比,迁移轨迹分析方法旨在更加直观地识别沉积体系及预测砂岩储层。基于国内外研究进展,介绍了迁移轨迹基本理论和方法,并重点介绍了盆地方向的陆架边缘迁移轨迹类型(上升型、平缓型和下降型)、定量化评价指标以及在深水砂岩储层预测方面的应用。盆底扇的形成与陆架边缘迁移轨迹密切相关,大量实例研究表明大规模的盆底扇通常形成于平缓或者下降型迁移轨迹中。随着研究的深入,深水砂体发育与陆架边缘迁移轨迹的配置关系被认为受多种因素影响,应综合考虑沉积物供给、可容纳空间、古气候等因素才能准确预测有利深水砂岩储层的发育和分布。此外,还介绍了迁移轨迹分析理论的外延:①走向上迁移轨迹差异演化;②限制性沉积盆地的迁移轨迹分析理论;③碳酸盐岩沉积环境中迁移轨迹的应用,拟将该分析方法引入并应用到其他类型沉积盆地中。
First author:Cong Fuyun (1992-), male, Qianjiang City, Hubei Province, Ph.D student. Research areas include sequence stratigraphy and reservoir prediction.E-mail:fuyuncong@hotmail.com
Trajectory analysis is the hotspot and research frontier of sedimentology and sequence stratigraphy. Compared with conventional analytical methods, trajectory analysis is aiming at identifying sedimentary systems and predicting sandstone reservoirs more directly. The definition of trajectory analysis has been made by Helland-Hansen as “The study of the lateral and vertical migration of geomorphological features and associated sedimentary environments, with emphasis on the paths and directions of migration”. Based on current research progress, the basic concepts and methods of trajectory analysis, types of basinward-migrating trajectories (ascending, flat and descending), quantitative parameters and the application in predicting deep-water sandstone reservoirs were introduced. Trajectory analysis mainly centers on two scales: Shoreline trajectories and shelf-edge trajectories. The formation of basin-floor fans has close relation with shelf-edge trajectories, and multiple case studies have confirmed that large-scale basin floor fan usually form under flat or descending shelf-edge trajectories. As research advances, trajectory analysis theory, which developed in continental margins, is believed to have been influenced by multiple factors. Thus, the accurate prediction of sandstone reservoirs requires the comprehensive consideration of the influence of sediment supply, accommodation spaces, past climate and so on. In addition, the problems and extensions of trajectory analysis were also introduced, including ①the along-strike lateral differential evolution; ② trajectory analysis theory in hydrological-closed sedimentary basins; ③the application of trajectory analysis in carbonate settings. As a developing theory, the terminology of trajectory analysis still needs standardization, and the coupling between shelf-edge trajectories and the development and distribution of deep-water sandstones also needs further understanding. The next research focus could be placed on interpreting the evolution of three-dimensional sedimentary systems, and the extension of shelf-edge trajectory theory to hydrologically-closed basin and carbonate sedimentary environments. The research methods of trajectory analysis should also follow the newest trends to allow researchers to better study the evolution of shelf-edge trajectories, for instance, integrating high-resolution seismic data and logging data, core samples, outcrops and high-resolution dating techniques to describe ancient sedimentary environment and geomorphology, combining satellite imaging, ground penetrating radar to portray the modern morphology of continental margins, and utilizing remote sensing to construct more precise three-dimensional models for outcrops.
层序地层学将不同地层单元赋予低位、海侵和高位体系域的概念[1~4]。然而, 传统层序地层学模型并不能解释所有沉积现象。迁移轨迹分析(trajectory analysis)则将传统相对独立的体系域模型视为更加连续的沉积序列, 系统研究轨迹迁移趋势与大陆边缘和盆底沉积体系的耦合关系, 动态分析沉积物的搬运与展布, 从而较为准确地预测岩相和深水有利勘探目标[5~11]。
自Helland-Hansen等[6]首次提出迁移轨迹概念以来, 轨迹迁移现象在全球许多盆地中被报道, 其中以大陆边缘深水盆地居多[8, 12, 13]。随着近年来迁移轨迹分析理论不断完善[9~11, 14], 及其在深水砂体预测方面的成功应用[12, 15, 16], 迁移轨迹分析已成为沉积学与层序地层学关注的热点和前沿研究领域。本文基于国内外研究进展, 系统介绍迁移轨迹的理论基础和研究方法, 探讨陆架边缘迁移轨迹定量化研究及相应的深水砂岩储层预测, 拟将迁移轨迹分析方法引入并应用到其他沉积盆地中。
坡折地形(clinoform)是迁移轨迹分析的基本地貌单元。Rich[17]最早提出坡折地形的概念, 主要关注坡折地形的斜坡部分。Steel等[8]将坡折地形定义为拥有顶积层(topset)— 前积层(foreset)— 底积层(bottomset)的“ S” 形沉积剖面, 被坡折地形所围限的岩石单元称为坡折单元(clinothems)。
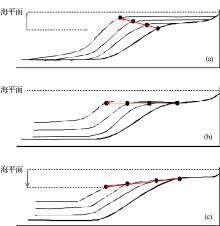
根据轨迹迁移的研究尺度, 坡折地形分为滨线坡折地形和陆架边缘坡折地形(图1)。滨线坡折地形的高度通常为几米至几十米, 滨线坡折拐点记录了不同时期滨线的位置(图1a)。高能水动力形成的三角洲沉积体系可以形成高度较大的水下三角洲坡折地形(subaqueous delta clinoforms)[9](图1b)。陆架边缘坡折地形高度可达数百米, 其坡折拐点记录了不同时期陆架边缘的位置(图1)。陆架边缘坡折地形和水下三角洲坡折地形可根据规模大小进行区分(如高度和宽度等)。
Helland-Hansen等[9]将迁移轨迹分析定义为对坡折体系侧向和垂向地貌特征和相应沉积环境迁移的研究, 重点关注迁移的路径和方向。虽然轨迹迁移分析可以应用在不同尺度, 例如从小尺度的波纹迁移到大尺度的陆架边缘进积[9], 但轨迹迁移分析方法主要应用于滨线(shoreline)沉积系统[6, 9]和陆架边缘(shelf-edge)沉积系统的迁移[8, 12]。迁移轨迹记录了滨线和陆架边缘坡折点(break-in-slope)垂向和侧向迁移的位置, 反映了沉积体系演化的历史。
陆架和陆架边缘不只是一种特定的地形, 同时也体现了沉积过程[18]。随着研究的深入, 陆架和陆架边缘的概念并不局限于被动大陆边缘。Steel等[8]认为在任何类型的盆地中, 只要可以观察到大规模的坡折地形(几百米及以上), 均可用陆架和陆架边缘进行描述。
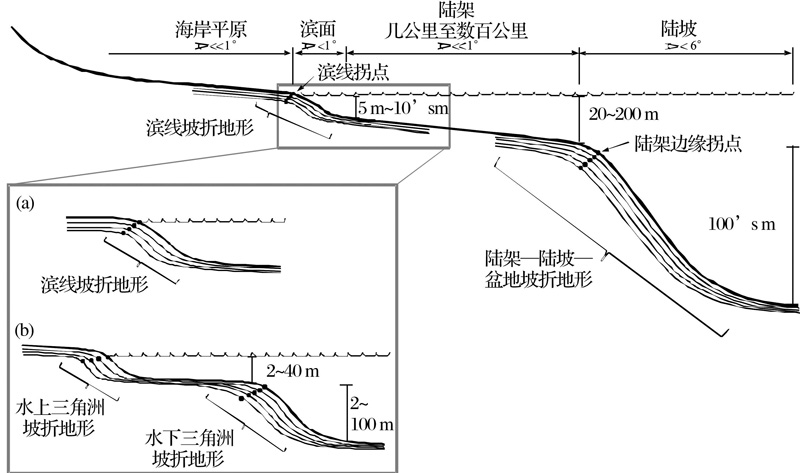 | 图1 滨线及陆架边缘坡折地形示意图(据参考文献[9]修改) (a) 单独的滨线坡折地形; (b) 高能三角洲环境下形成的水下三角洲坡折地形Fig.1 Sketch illustrating shoreline clinoforms and shelf-edge clinoforms(modified after reference[9]) (a) Single shoreline clinoform; (b) Subaqueous delta clinoforms in high energy settings |
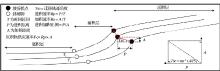
地震资料解释是研究陆架和滨线迁移轨迹的有效方法。在地震剖面上, 沿地层倾向可以直观地观察到陆架坡折地形及相应的陆架边缘迁移轨迹[15, 16, 19, 20], 其中迁移轨迹可以通过坡折拐点垂向和纵向连续变化的位置进行识别(图1)。利用三维地震属性提取技术, 能在平面上观察到不同时期陆架坡折的位置和展布特征, 并识别相应的陆架边缘沉积体系[15, 16, 21~23]。受地震资料分辨率的限制, 滨线迁移轨迹(图1)往往不易在常规地震剖面中识别, 但高分辨率浅层地震[24, 25]和探地雷达[26~29]能有效识别滨线坡折地形和滨线迁移轨迹(图2)。
由于野外露头的尺度通常小于陆架边缘坡折地形, 其坡折拐点和迁移轨迹难以在野外露头中识别出来。但在一些出露较好的大尺度野外露头中, 也可以清晰地观察到陆架边缘坡折拐点及其迁移轨迹[8, 12, 30, 31](图2)。在缺乏高品质地震资料的情况下, 综合野外露头[32, 33]、岩心[34]以及测井数据[14, 35, 36]中记录的沉积相突变的位置, 可以对陆架边缘坡折拐点进行识别。
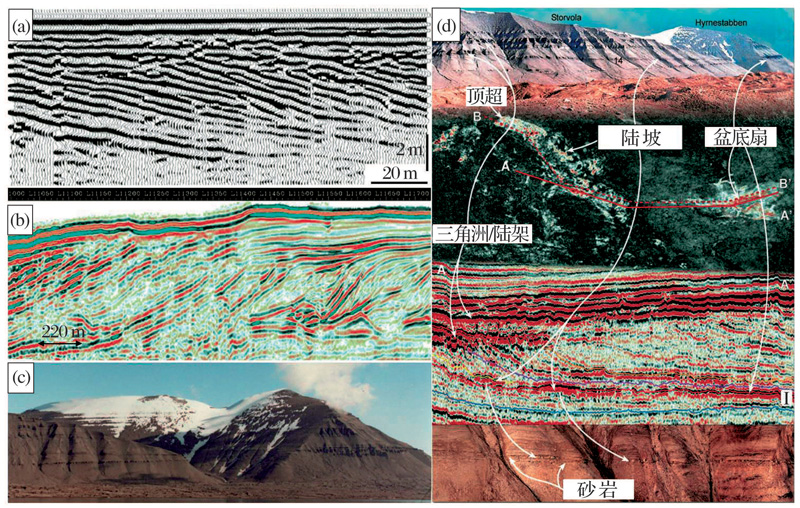 | 图2 轨迹迁移不同研究方法 (a)探底雷达识别滨线迁移轨迹(据参考文献[26]修改); (b)地震剖面识别陆架边缘迁移轨迹(据参考文献[11]修改); (c) 野外露头识别陆架边缘迁移轨迹(据参考文献[12]修改); (d)露头、地震综合识别陆架边缘迁移轨迹(据参考文献[12]修改)Fig.2 Different approaches for trajectory analysis (a)Identifying shoreline trajectories using ground penetrating radar (modified after reference[26]); (b) Identifying shelf-edge trajectories using seismic data (modified after reference[11]); (c) Identifying shelf-edge trajectories in outcrops (modified after reference[12]); (d) Identifying shelf-edge trajectories by the integrated use of outcrops and seismic data (modified after reference[12]) |
根据迁移的方向, 陆架边缘迁移轨迹可以分为两大类:向陆方向迁移和向盆地方向迁移。虽然峡谷下切、溯源侵蚀等作用可能导致陆架边缘短时间内向陆迁移, 但一般而言, 能观察到的大规模陆架边缘轨迹主要是向着盆地方向迁移[9]。根据陆架边缘迁移轨迹的形态特征可以将盆地方向迁移轨迹分为上升型(ascending)、平缓型(flat)和下降型(descending)3种类型(图3)。
上升型陆架边缘迁移轨迹以明显的向上加积和向盆地进积为特征, 坡折地形常显示出较厚的顶积层、前积层和较薄的底积层。上升型轨迹反映了相对海平面的长期上升, 使陆架可容纳空间增加。上升型轨迹还可细分为高角度上升轨迹和低角度上升轨迹, 其差别在于前者相对后者拥有更厚的顶积层和更薄的前积层(图3a)。
平缓型陆架边缘迁移轨迹以明显的进积为特征, 坡折地形发育较薄的顶积层以及较厚的前积层和底积层, 表现为平行或接近于古水平面的迁移轨迹, 反映沉积时固定不变的相对海平面(图3b)。
下降型陆架边缘迁移轨迹以明显的进积为特征, 坡折地形不发育顶积层或发育极薄的顶积层, 并发育较厚的前积层和底积层。下降型轨迹反映了相对海平面长期的下降, 造成陆架可容纳空间变小。
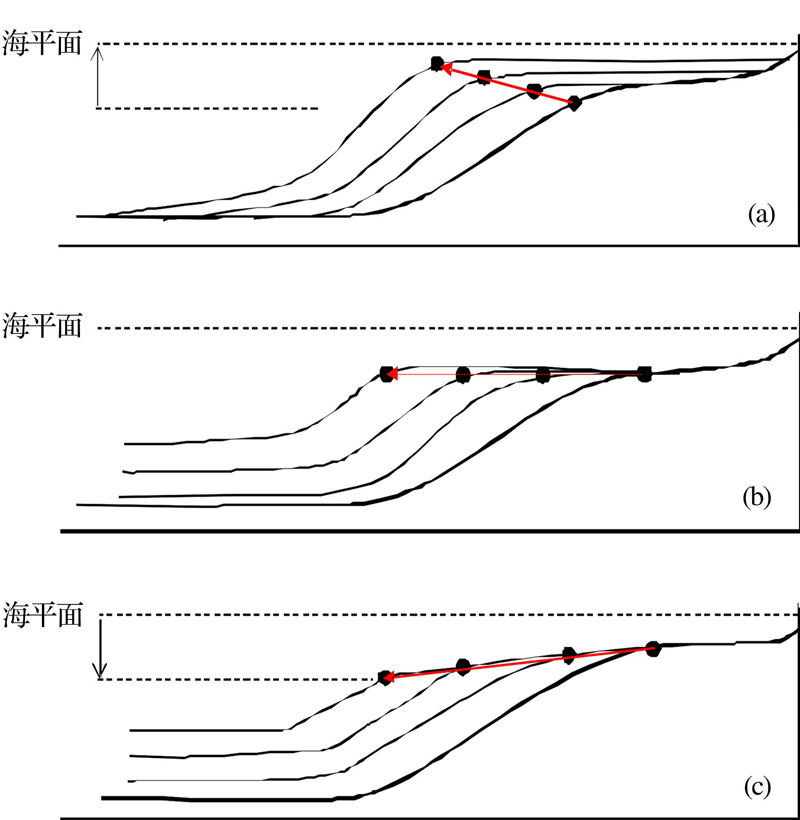 | 图3 陆架边缘迁移轨迹类型(据参考文献[11]修改) (a)上升型陆架边缘迁移轨迹; (b)平缓型陆架边缘迁移轨迹; (c)下降型陆架边缘迁移轨迹Fig.3 Types of shelf-edge trajectories(modified after reference[11]) (a)Ascending shelf-edge trajectory; (b) Flat shelf-edge trajectory; (c) Descending shelf-edge trajectory |
根据迁移轨迹角度的大小, 下降型轨迹还可细分为高角度下降轨迹和低角度下降轨迹(图3c)。
研究学者提出了不同的指标来表征陆架边缘迁移轨迹[14, 37~40], 以定量— 半定量研究沉积物供应量、陆架可容纳空间、气候条件等因素对迁移轨迹形态及相应的沉积物展布样式的影响。
定量化计算的参考面通常选取平面上可追踪的、连续的古水平面, 包括最大海泛面、煤线、深海泥岩等标志层[9]。考虑到压实作用, 在地震反射剖面进行计算时, 还需要对研究层段进行去压实处理。
常用的定量化指标包括坡折地形高度(Rc)、加积距离(A)、进积距离(P)、迁移轨迹角度(Tse)、时间区间(T)、进积速率(Rp)、加积速率(Ra)、进积与加积比例(P/A ratio)、沉积物供应速率(Fc)等(图4)。总体而言, 这些指标可以分为2类:一类可以在地层倾向方向的反射地震剖面上直接进行测量, 比如坡折地形高度、加积距离、进积距离和迁移轨迹角度; 另一类需要结合研究层段的年代学约束进行计算, 如时间区间、进积速率、加积速率、进积与加积比例和沉积物供应速率。其中坡折地形高度可以反映古水深, 进积速率、加积速率、进积与加积比例和沉积物供应速率可以用来评价沉积物供应量, 迁移轨迹角度可以用来表征陆架可容纳空间和迁移轨迹的样式。
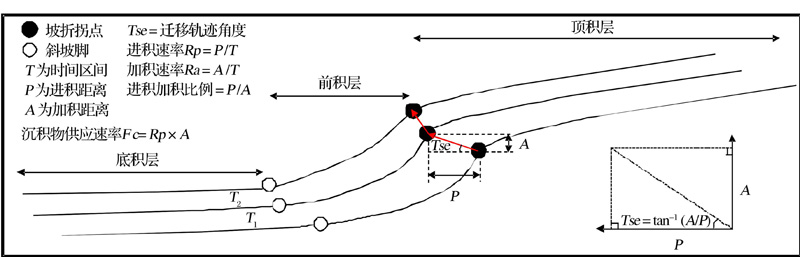 | 图4 坡折地形定量化指标计算示意图(据参考文献[20]修改)Fig.4 Sketch showing quantitative parameters for clinoforms(modified after reference[20]) |
不同学者在Porcupine盆地、琼东南盆地和Spitsbergen盆地陆架边缘的研究表明, 盆底扇的形成与陆架边缘迁移轨迹密切相关, 大规模的盆底扇通常形成于下降或者平缓型迁移轨迹中, 而上升型迁移轨迹中则不发育盆底扇[7, 8, 12, 21, 41, 42]。下降或平缓型迁移轨迹形成于相对海平面下降或稳定的时期, 陆架可容纳空间变小, 粗碎屑沉积物过路搬运至陆坡和盆地形成盆底扇, 这与传统层序地层学低位扇的预测模型相吻合。上升型迁移轨迹形成于相对海平面上升的时期, 陆架可容纳空间变大, 沉积物堆积于陆架形成较厚的三角洲序列不太容易形成盆底扇。
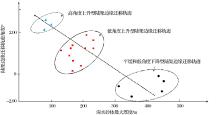
应用陆架边缘迁移轨迹理论有助于半定量— 定量化预测深水砂体。Gong等[15, 16]在琼东南盆地的研究中, 定量统计了陆架边缘迁移轨迹角度、陆架边缘加积与进积比例(A/P)、陆架和盆底沉积厚度比例(As/Ab)、坡折地形高度和深水砂体厚度(%SS), 并进行相关性拟合分析, 结果显示陆架边缘迁移轨迹角度、陆架边缘加积与进积比例、陆架和盆底沉积厚度比例、坡折地形高度均与深水砂体厚度呈明显的负相关关系, 并能作为深水砂体的预测指标(图5), 据此总结出深水砂体展布的半定量预测公式:
(Tse; A/P, RcAs/Ab)∝ 1/%SS
随着研究的深入, 陆架边缘迁移轨迹与深水砂体发育的耦合关系被认为受多种因素的影响。首先, 即使迁移轨迹呈现下降或平缓型也不一定发育盆底扇。Spitsbergen中央盆地始新统地层中, 相对海平面下降造成陆架和陆坡顶部暴露剥蚀, 但由于陆坡缺少有效的沉积物搬运通道(海底峡谷、水道等), 沉积物仅堆积于陆坡形成斜坡扇, 而未能搬运至盆底形成深水扇[30]。其次, 在高沉积物供应量条件下, 深水扇也可以发育在上升型迁移轨迹中。南怀俄明Lewis Shale盆地[13]和西委内瑞拉陆架边缘[11]地层中, 在高沉积物供应量条件下, 上升型迁移轨迹中沉积物不仅足够在陆架垂向加积较厚的沉积序列, 也能过路搬运至盆底发育深水扇体。
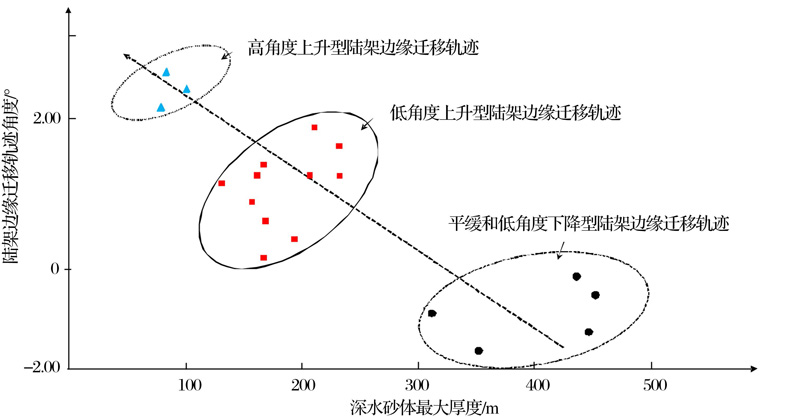 | 图5 陆架边缘迁移轨迹与深水砂体厚度相关关系(据参考文献[15]修改)Fig.5 Correlation between shelf-edge trajectories and deep-water sandstone thickness(modified after reference[15]) |
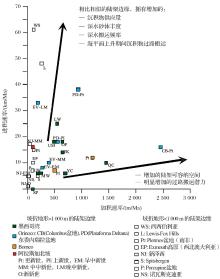
沉积物供应量是控制陆架边缘迁移和深水砂体发育的一种主要因素[34, 43, 44]。Carvajal等[14]对沉积物供应量驱动陆架边缘生长和深水砂体沉积的讨论强调了沉积物供应量的重要性, 并提出用陆架边缘进积速率表征沉积物供应量大小(图6)。他们通过统计发现, 陆架边缘的长期高进积速率(10’ s km/Ma)与大规模盆底砂体的发育有良好的关联性。高进积速率和高进积/加积比例能反映高沉积物供应量, 即使在上升型迁移轨迹中沉积物也足够充填陆架可容纳空间, 并频繁搬运至盆底形成大规模盆底扇(图6)。低进积速率和低进积/加积比例则反映了低沉积物供应量, 只有在下降或平缓型轨迹中才形成盆底扇。随后的研究成果均支持了此观点[34, 38, 39, 45]。除了沉积物供应量, 其他因素也被认为驱动着陆架边缘迁移以及深水砂体发育, 比如气候条件(温室/冰室)[39, 46, 47]、陆架可容纳空间[4, 48, 49]、地质营力作用(河流、波浪和潮汐)[12, 14, 50, 51]以及沉积物粒度[40]等。
前人的研究成果表明, 应用迁移轨迹理论预测深水砂体的发育和展布需要综合考虑沉积物供应量、气候条件、陆架可容纳空间、沉积物粒度和地质营力作用等因素的影响。在迁移轨迹动态演化的框架下, 可以通过对各种影响因素进行定量化表征和评价达到准确预测深水砂体的目的。如Gong等[39]系统讨论了沉积物供应量、气候条件和陆架可容纳空间的相互影响, 并对不同类型陆架边缘迁移轨迹与深水砂体的发育和展布的耦合关系进行了总结(图7)。
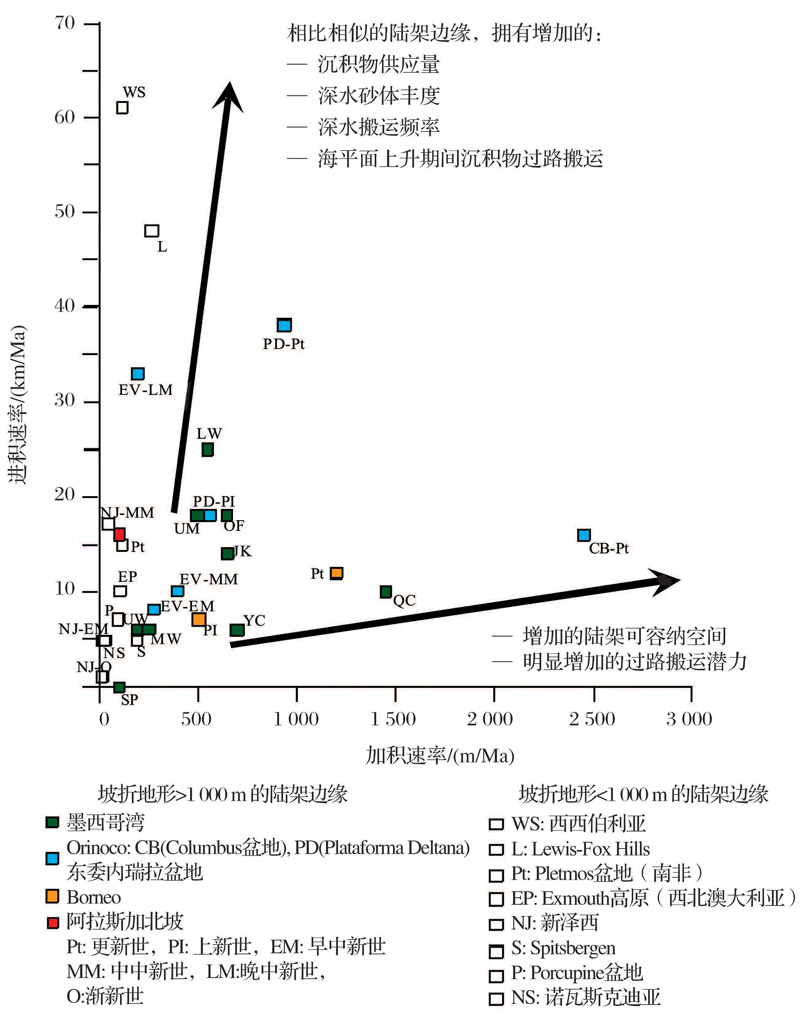 | 图6 进积速率和沉积物供应量、深水砂体的统计关系(据参考文献[14]修改)Fig.6 Progradation rates and inferred trends for sediment supply and deep-water sandstone volumes(modified after reference[14]) |
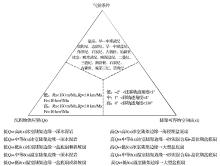
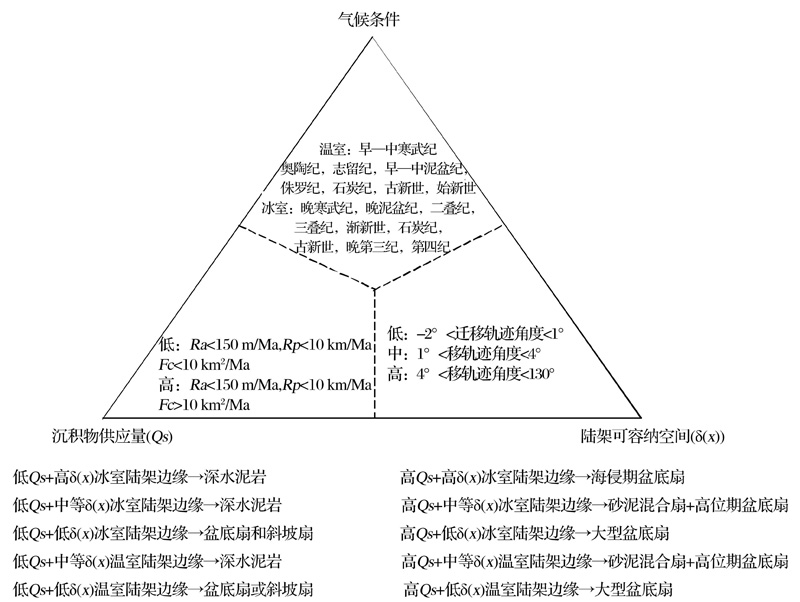 | 图7 基于沉积物供应量、气候条件和陆架可容纳空间的陆架边缘迁移轨迹分类及与深水砂体发育的关系(据参考文献[39]修改)Fig.7 Classification of shelf-margin trajectoreis and the relationship with deep-water sandstone development, on the basis of variations in the interplay of sediment supply, shelf accommodation, and climatic factors(modified after reference[39]) |
长期以来地层学家只是在二维框架下研究地层倾向方向陆架边缘迁移轨迹与沉积物展布的关系, 而往往忽略了走向上的变化[10, 33, 50, 52]。对现代沉积系统的观测表明, 陆架形态、沉积物展布样式、沉积物搬运机制和沉积物供应量大小与走向上都存在变化[52]。因此在单独的地层倾向剖面上观察到的现象, 不一定在走向上具有代表性。有以下几个因素影响走向上陆架边缘轨迹的变化:
(1) 盆地形态。包括陆架宽度的变化以及盆底地貌的多样性。陆架边缘的宽窄直接影响了陆架可容纳空间。巴西近海陆架边缘从南至北, 随着陆架宽度变窄, 陆架可容纳空间逐渐变小, 反应于陆架边缘迁移轨迹由南边的上升型过渡为北边的下降型, 导致沉积物供应在南边不够充填陆架可容纳空间, 而在北边却可以过路搬运至盆地形成盆底扇[10]。盆地地貌的变化会导致局部地势高低的起伏, 北美Tyee前陆盆地中, 火山弧的发育造成盆底局部较高的地势和较低的古水深, 相比火山弧发育形成的浅水区, 深水区发育进积量更多的坡折地形和规模更大的盆底扇[32]。
(2) 区域性差异沉降。特别是构造活动引起的差异沉降会导致局部相对海平面变化。罗马尼亚中新统Dacian前陆湖盆中断层活动引起差异构造沉降, 导致盆地南北同时期形成的陆架边缘迁移轨迹呈现不同的角度, 甚至出现截然相反的趋势。构造沉降强则迁移轨迹角度高, 陆架进积少, 盆底扇规模更小[23]。
(3) 物源体系。特别是点物源对走向上沉积物供给有很大的影响。靠近点物源主河道的陆架边缘区域沉积物供应量大, 陆架边缘进积和加积速率相应变大, 陆坡角度也更高, 在条件合适的情况下可以形成盆底扇; 远离点物源主河道区域沉积物供应量低, 陆架边缘进积和加积速率小, 难以形成盆底扇[52]。
(4) 沉积物搬运通道。如果陆坡上发育的大型海底峡谷或水道直接与陆架边缘连通, 沉积物会通过海底峡谷和水道直接搬运至盆底, 而较少在陆坡上堆积。即使在高沉积物供应量条件下, 区域上仍会形成低进积量的坡折地形[23, 39]。
(5) 地质营力作用。包括河流、波浪和潮汐作用。波浪和潮汐的顶托作用, 会在陆架边缘阻拦沉积物向深水搬运, 形成沿岸泥沙流[14, 50, 51]。相比波浪和潮汐作用, 河流作用则能更有利地搬运砂体至深水区[12, 50]。
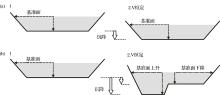
南非二叠系Karoo盆地Waterford组陆架边缘是盆地形态、地质营力作用以及沉积物搬运通道变化综合影响陆架边缘走向上变化的典型例证[33](图8)。由南至北陆架边缘宽度逐渐变窄, 大型河流带来充足沉积物供应形成陆架边缘三角洲, 足够充填陆架可容纳空间, 并通过峡谷水道以及重力流搬运至盆底形成盆底扇。小型河流携带的少量沉积物则在波浪作用下形成沿岸流向北再搬运, 剩余的沉积物形成浅水陆架三角洲, 不足以充填陆架可容纳空间, 不能形成盆底扇。
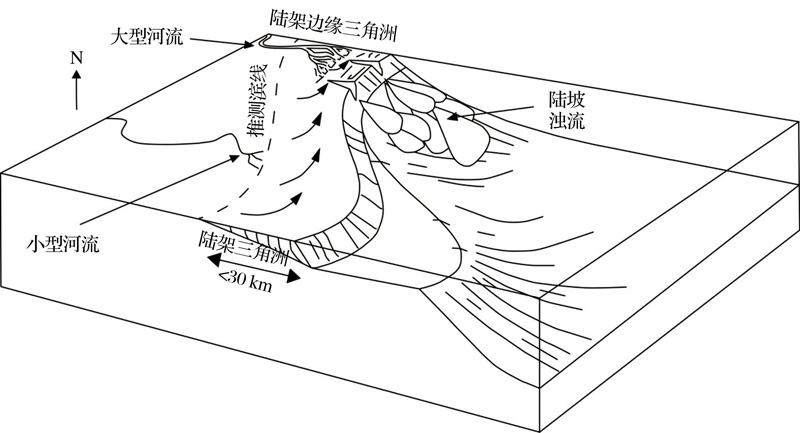 | 图8 盆地形态、地质营力作用以及沉积物搬运通道变化综合影响Karoo盆地Waterford组陆架边缘走向上迁移轨迹和沉积物展布的变化(据参考文献[33]修改)Fig.8 Lateral variability along the lower Waterford margin in the Karoo basin caused by the influence of basin physiography, process regimes and sediment transport conduits(modified after reference[33]) |
在封闭水文条件下, 特别是湖相盆地中, 影响陆架边缘迁移轨迹和沉积物展布的因素与海相盆地有很大的区别。目前轨迹迁移的相关研究主要关注在海相陆架边缘, 而相比海相盆地的开放水文环境, 轨迹迁移分析思路在封闭水文条件的湖相盆地中仍有不适用之处, 特别是湖盆类型、区域性气候变化和构造沉降对沉积物供应量和海平面升降的影响仍需研究人员进一步分析总结。
首先, 封闭水文条件下基准面变化不直接受全球海平面变化调控。当盆内水体未完全充满湖盆时(如Carroll等[53]提出的平衡型和未充满型湖盆类型), 基准面变化同时受长期构造运动和短期局部气候变化控制, 典型例证是匈牙利Pannonian湖相盆地[19]。当盆内水体完全充满湖盆并向外溢出时(如Carroll等[53]提出的溢出型湖盆类型), 若与盆外水体连通, 则基准面受盆外水体水平面升降影响; 若未与盆外水体连通, 则基准面不再上升, 受蒸发强度影响, 只形成平缓和下降型陆架边缘迁移轨迹, 典型例证是Dacian深湖盆地[23]。
其次, 气候通过蒸发/降雨量和风化作用同时影响基准面变化和沉积物供应量。以Pannon湖盆为例, 潮湿气候下, 高降雨量导致Pannon湖盆河流流量增大, 引起湖平面上升形成上升型的陆架边缘迁移轨迹; 与此同时, 强烈的化学风化作用产生大量的沉积物供应, 沉积物不仅足够充填陆架可容纳空间, 也能搬运至盆底形成盆底扇。而在干旱气候下, 高蒸发量导致Pannon湖盆河流流量减小, 湖平面下降形成平缓或下降型的陆架边缘迁移轨迹; 与此同时, 物理剥蚀作用不强烈, 而河流流量的减小也降低了所携带的沉积物供应量, 沉积物不足以充填陆架可容纳空间, 无法形成盆底扇。
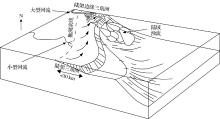
此外, 差异沉降对基准面变化有不可忽视的影响。若封闭水文环境中水体体积不变, 均匀的沉降作用并不会引起基准面变化。而差异沉降, 特别是湖盆中普遍存在的断层活动引起的局部构造沉降, 会导致基准面在高沉降速率区域快速上升形成上升型迁移轨迹, 而在低沉降速率区域呈现下降趋势形成下降型迁移轨迹[19](图9)。
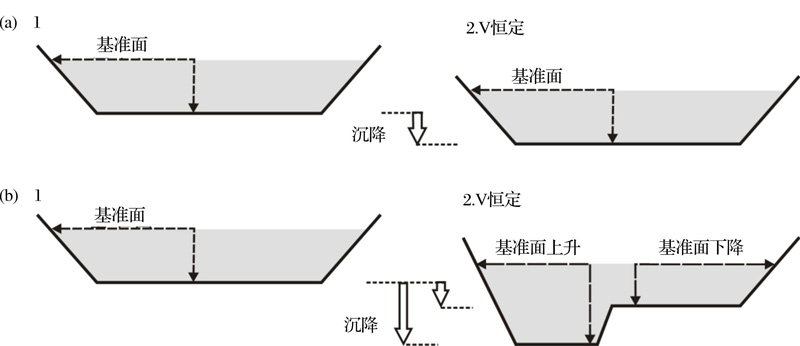 | 图9 沉降对湖相盆地基准面的影响(据参考文献[19]修改) (a) 假设湖水体积(V)不变, 均匀沉降不影响基准面高低; (b)假设湖水体积(V)不变, 高沉降速率区域基准面上升, 低沉降速率区域基准面下降Fig.9 The influence of tectonic subsidence on base level change in lacustrine basins(modified after reference[19]) (a)If volume of water mass (V) is constant and rate of subsidence is homogeneous base level is not influenced; (b) If volume of water mass is constant, base level rises in area with high rate of subsidence and falls in area with low rate of subsidence |
陆架边缘迁移轨迹分析在动态演化的框架下解释地层演化历史, 综合考虑沉积物供应量、海平面升降和沉降/隆升的影响, 是一种层序地层学研究新思路。通过对陆架边缘迁移轨迹定量化表征, 可以限定沉积物供应量、气候条件等因素对深水砂体发育和展布的控制作用, 从而进行准确的深水砂岩储层预测。
相比层序地层学的体系域模式分析思路, 迁移轨迹分析有如下几点优势:①综合考虑海平面升降、沉降和沉积物供应量; ②在连续演化的背景下进行分析; ③没有既定的假设, 特别是传统层序地层学理论中强调的“ S” 型海平面变化和固定的沉积物供应量; ④不用过分关注和识别关键界面(如最大海泛面和层序界面)。迁移轨迹分析提供了没有任何前提假设约束的理论框架, 将地质资料放在动态持续演化的框架下进行描述, 为地质沉积历史提供了客观、准确的解释。
作为一种正在发展的沉积学研究方法, 陆架边缘迁移轨迹分析的相关术语仍需进一步规范, 陆架边缘迁移轨迹和深水砂体发育和展布的耦合关系也需要进一步认识。陆架边缘迁移轨迹分析下一步的研究重点, 应该在于对三维地质体沉积系统演化的刻画, 以及向封闭水文条件盆地和碳酸盐岩沉积环境扩展。陆架边缘迁移轨迹的研究方法也需要紧跟潮流, 综合运用高精度三维地震数据体与测井数据、岩心数据、野外露头和高精度定年手段对古沉积环境和古地貌的刻画, 结合卫星成像、探地雷达技术对现代陆架边缘地貌的描绘, 以及运用遥感技术对野外露头古沉积环境建立精确的三维模型都有助于研究人员更好地研究陆架边缘迁移轨迹的演化。
The authors have declared that no competing interests exist.
| [1] |
|
| [2] |
|
| [3] |
|
| [4] |
|
| [5] |
|
| [6] |
|
| [7] |
|
| [8] |
|
| [9] |
|
| [10] |
|
| [11] |
|
| [12] |
|
| [13] |
|
| [14] |
|
| [15] |
|
| [16] |
|
| [17] |
|
| [18] |
|
| [19] |
|
| [20] |
|
| [21] |
|
| [22] |
|
| [23] |
|
| [24] |
|
| [25] |
|
| [26] |
|
| [27] |
|
| [28] |
|
| [29] |
|
| [30] |
|
| [31] |
|
| [32] |
|
| [33] |
|
| [34] |
|
| [35] |
|
| [36] |
|
| [37] |
|
| [38] |
|
| [39] |
|
| [40] |
|
| [41] |
|
| [42] |
|
| [43] |
|
| [44] |
|
| [45] |
|
| [46] |
|
| [47] |
|
| [48] |
|
| [49] |
|
| [50] |
|
| [51] |
|
| [52] |
|
| [53] |
|
| [54] |
|