江苏近海有色可溶有机物时空分布特征
马其琦, 柯长青*
南京大学 地理与海洋科学学院, 江苏 南京 210023
*通信作者:柯长青(1969-),男,陕西丹凤人,教授,主要从事冰雪遥感及其应用研究.E-mail:kecq@nju.edu.cn

作者简介:马其琦(1994-),男,安徽蚌埠人,硕士研究生,主要从事遥感及其应用研究.E-mail:mq113115@163.com

摘要

有色可溶有机物(CDOM)是重要的水色要素之一,在“江苏沿海大开发”背景下,利用遥感分析其时空分布特征对监测近海水质及污染状况有重要的实际意义。用高时间分辨率的韩国静止水色卫星(GOCI)影像,在日、周、月多时间尺度上分析2011年4月至2016年5月江苏近海有色可溶有机物的时空分布特征。结果表明江苏近海CDOM以陆源为主,近岸高于远岸;月平均浓度最大值(0.180~0.206 m-1)在长江口最大浑浊带外,南黄海西岸次之(0.167~0.201 m-1),南黄海中南部较低(0.086~0.187 m-1,440 nm吸收系数)。结合潮位数据,发现沿岸海域CDOM日变化与潮汐变化一致,但远海区域呈先减后增的特征。利用余弦函数对CDOM月均值进行拟合,发现南黄海月尺度变化周期性明显,其中南黄海中部海域拟合优度为0.823。南黄海主要受黄海冷水团影响,各子区季节变化显著,CDOM在冬春季高于夏秋季;长江口由于冲淡水及其他水团共同影响,情况复杂,冬春季低于夏秋季。月尺度下,CDOM浓度与悬浮物(TSM)呈正相关关系(相关系数 r为0.72),且南黄海中部与南部CDOM随TSM的变化趋势较为显著。

关键词: 有色可溶有机物(CDOM); 静止水色卫星(GOCI); 高时间分辨率; 时空分布特征; 江苏近海
中图分类号:P734.4 文献标志码:A 文章编号:1001-8166(2017)05-0524-11
Temporal and Spatial Distribution Characteristics of Colored Dissolved Organic Matter in Coastal Waters of Jiangsu Province
Ma Qiqi, Ke Changqing*
School of Geographic and Oceanographic Science, Nanjing University, Nanjing 210023, China
*Corresponding author:Ke Changqing(1969-),male,Danfeng County,Shannxi Province,Professor. Research areas include remote sensing and its application.E-mail:kecq@nju.edu.cn

First author:Ma Qiqi(1994-),male,Bengbu City,Anhui Province,Maste student.Research areas include remote sensing and its application.E-mail:mq113115@163.com

Abstract

Colored Dissolved Organic Matter (CDOM) is one of important ocean color factors. In the background of “Jiangsu Coastal Development”, it is important to monitor the water quality and pollution status of coastal waters by analyzing its spatial and temporal distribution characteristics with remote sensing data. This paper was based on the high temporal resolution of Geostationary Ocean Color Imager (GOCI) image downloaded from Korea Ocean Satellite Center. The temporal-spatial distribution of CDOM in Jiangsu coastal waters was analyzed on daily, weekly and monthly time scales from April, 2011 to May, 2016. CDOM in Jiangsu coastal waters are mainly terrigenous, and higher inshore than that of offshore. The monthly average concentration of CDOM in the western coast of the South Yellow Sea was 0.167~0.201 m-1, and those of central and southern regions were 0.086~0.187m-1. The maximum values were outside the maximum turbidity zone of the Yangtze River Estuary, which was 0.180~0.206 m-1 (absorption coefficient at 440 nm). The diurnal variation of CDOM in near shore waters was found to coincide with the change of tide, which decreased at first and then increased in the sea area. By fitting the monthly mean using cosine function, significantly cyclical variation of mean CDOM was found in the South Yellow Sea. The central region of the South Yellow Sea waters fitting coefficient was 0.823. Affected by the Yellow Sea cold water mass, the sub-regions of the South Yellow Sea changed seasonally, whose CDOM concentration in winter and spring was higher than that in summer and autumn. Because of Changjiang Diluted Water and other water masses, seasonal variation of the Yangtze River Estuary was contrary to that of the South Yellow Sea. On monthly scale, CDOM concentration was positively correlated with total suspended matter, with correlation coefficient r being 0.72. The trend of the central and southern region was more significant.

Keyword: Colored Dissolved Organic Matter (CDOM); GOCI; High temporal resolution; Temporal and spatial distribution characteristics; Coastal waters of Jiangsu Province.
1 引 言

有色可溶有机物(Colored Dissolved Organic Matter, CDOM)是水体中溶解有机物(Dissolved Organic Matter, DOM)的有色吸光部分, 是水体中各类高分子化合物的总称, 一般认为其主要组成为浮游植物、浮游动物腐烂的降解物。随着研究的深入, 人们还发现自然水体中的CDOM由可溶性有机物碎片组成。由于其特殊的光学特性, 能够吸收蓝光并散射黄光, 使水体呈现黄色, 所以又称“ 黄色物质” 。近岸海域的CDOM主要来源为陆源有机质, 来自江河的径流输入[1, 2]; 而远海区域以海洋源生为主, 如浮游植物生长、浮游动物摄食和微生物活动[3, 4]。CDOM是表层水体固有光学特性的主要决定因素(对蓝光(440 nm)的吸收在近海占20%~70%, 在远海中大于50%)[5~7]

CDOM作为重要的水色要素之一, 在生物过程和光化学过程起着重要作用。它的光谱吸收峰主要为紫外光与蓝光, 且化学性质较为稳定, 吸收的紫外光对水生生物有保护作用; 但对蓝光的吸收则会影响光合有效辐射和初级生产力, 尤其是在高纬度地区或混浊水体[8]。而江苏近海水体混浊, 属于二类水体, 常年悬浮物(Total Suspended Matter, TSM)含量较高, 对CDOM的反演有一定影响[9], 研究CDOM含量、光学特性及其与TSM的关系在江苏近海水色及水生生态系统中具有重要地位。由于近海CDOM主要为陆源, 而陆源有机质中含量较高的有机污染物是由人类活动产生的。自古以来江苏沿海的开发利用就备受政府重视, 2009年, 国务院更是将江苏沿海开发提高到国家战略的地位, 大规模开发促进经济发展的同时, 环境、生态等问题也不容忽视, 因此, 利用遥感手段研究江苏近海CDOM的时空分布对大范围海域的水质及污染状况, 特别是有机物污染监测有重要的实际意义。

国际上关于CDOM的研究始于20世纪30~40年代, 研究区遍布世界各大洋、近岸海域及陆地湖泊, 研究内容涉及CDOM的物质组成[10, 11]、光谱特征[12, 13]、生化作用[14, 15]以及应用等[16]。关于我国近海中CDOM的研究起步较晚, 且主要研究内容集中于CDOM的吸收特征、荧光特性及其空间分布。如利用实测数据分别对东海、黄海和渤海CDOM吸收光谱的研究[17~19]。肖隆庚等[20]和闫丽红等[21]利用三维荧光光谱技术分析了CDOM荧光组分的垂直分布特征。在空间分布方面, 张国朋[22]和周虹丽等[23, 24]就黄海、东海、渤海及南海进行过分布特征的研究。在之前的研究中, 实测数据由于采样时空间隔的局限性, 难以对大面积海域进行时间上连续、空间上全覆盖的研究; 而利用遥感手段的分析在时间尺度上以季节、年际为主, 因此高时间分辨率的CDOM空间变化研究就显得尤为迫切。本文基于高时间分辨率的静止水色卫星(Geostationary Ocean Color Imager, GOCI)影像, 在日、周、月的多时间尺度上分析江苏近海CDOM时空分布特点。

2 数据与方法
2.1 研究区

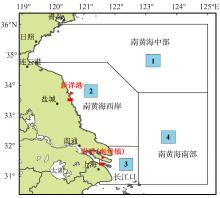
主要针对江苏近海海域表层水体CDOM浓度进行分析, 范围为30.75° ~36° N, 119° ~125° E。参考相关区划[25], 结合各海域CDOM来源及浓度情况, 将研究区划分为南黄海中部、南黄海西岸、长江口及南黄海南部4个子区(图1)。其中, 南黄海南部子区包含部分东海海域, 为表述方便, 统一称为南黄海南部。

2.2 数据与方法

GOCI传感器搭载在COMS(Communication Ocean and Meteorological Satellite)卫星上, 发射于2010年。GOCI遥感数据有6个可见光波段(412, 443, 490, 555, 660和680 nm)和2个近红外波段(745和865 nm), 空间覆盖范围为24.75° ~47.25° N, 116.08° ~143.92° E, 主要用于水色要素提取、海洋生态环境监测等方面。影像空间分辨率为500 m, 时间分辨率为1 h, 监测时间为08:00~15:00(北京时间), 每天8景。本文所用数据由韩国海洋卫星中心(Korea Ocean Satellite Center, KOSC)提供(http://kosc.kiost.ac/eng/p10/kosc_p11.html)。

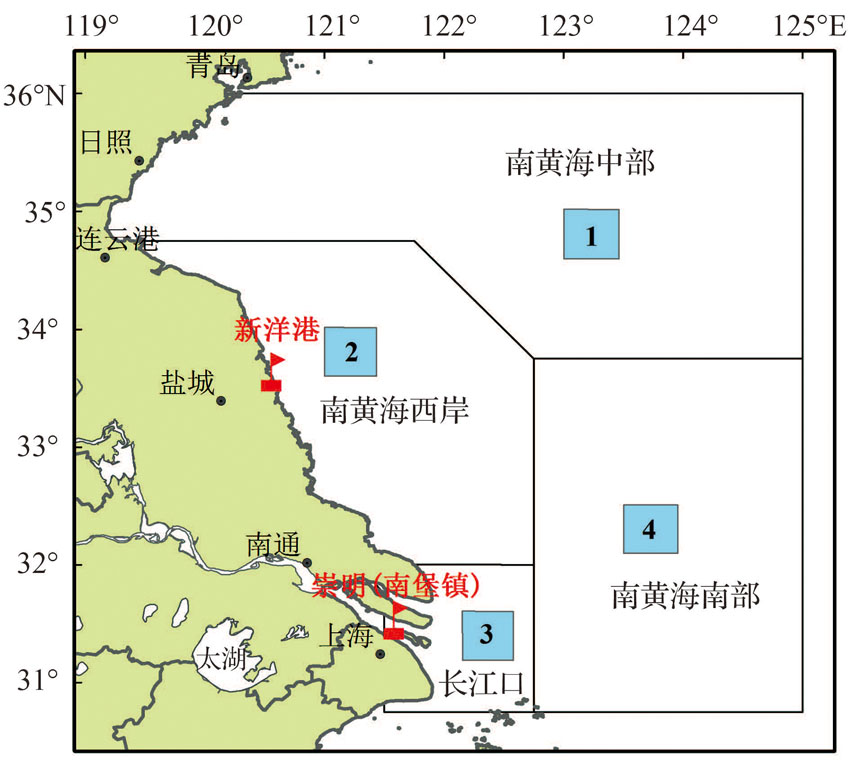
图1 江苏近海地理位置与子区划分, 采样区(浅蓝色方形区域)分布及潮位站(红色站点)位置Fig.1 Location andsub-regions of Jiangsu coastal waters, distribution of sampling areas (light blue square) and location of tide stations (red site)

CDOM浓度日变化研究采用GOCI Level 1B数据, 是经过几何校正的初级产品, 选取云量较少的2天:2015年5月12日和10月15日。利用KOSC提供的GOCI数据处理软件(GOCI Data Processing System, GDPS V1.4)反演得到逐时变化的CDOM浓度。使用的是KOSC标准大气校正算法[26, 27]与GOCI水色反演标准算法YOC(Yellow Sea Large Marine Ecosystem Ocean Color Work Group), 算法的函数形式最早由Tassan[28]提出, 后由Siswanto等[29]根据中国黄东海数十年的实测数据修正进而形成区域性经验算法。YOC算法使用440 nm吸收系数代表有色可溶有机物的浓度, 单位是m-1, 模型如下:

CDOM=1 0(c1+c2lgR+c3(lgR)2)(1)

R=( Rrs490Rrs555)(Rrs(443) )c4(2)

式中:Rrs(443), Rrs(490)和Rrs(555)分别为3个波段(443, 490和555 nm)的遥感反射率, 系数c1=-0.990, c2=-1.781, c3=-2.180, c4=0.059。

周、月尺度CDOM的时空变化研究采用Level 2(Ver 1.3)数据, 其生成算法同为YOC, 时间为2011年4月1日至2016年5月30日。由于数据源及数据质量的限制, 选用每天10:00~12:00的3景影像来合成不同时间分辨率的CDOM吸收系数分布影像。其中, 由于云与近岸高浓度悬浮物的影响, 日、周变化数据不全, 无法完整覆盖各研究子区, 故在4个子区中选取4个采样区来研究CDOM的时空变化, 具有一定的代表性。采样区大小为50 km× 50 km, 即100个× 100个像元(图1)。

采用KOSC的悬浮泥沙日产品数据(Level 2, Ver 1.3)来分析月尺度下CDOM与悬浮物(单位:g/m3)之间的关系, 生成算法同为YOC, 如公式(3)所示:

TSM=10 (e1+e2×(Rrs(555)+Rrs(670))+e3×Rrs490Rrs555)(3)

式中:e1=0.649, e2 =25.623, e3=-0.646。TSM月平均数据合成方法与CDOM相同, 选用每日同时段的3景。

另结合2015年5月12日和10月15日新洋港与崇明(南堡镇)的潮位数据(中国港口网, http://www.chinaports.com/chaoxi/)分析CDOM日变化与潮汐之间的关系。

2.3 大气校正与算法精度

根据对比分析结果, 在混浊水体, GOCI可见光波段(412~680 nm)大气校正精度约为10%; 清澈水体, 在蓝绿光波段(412~555 nm), GOCI归一化离水辐亮度(normalized water leaving radiance, nLw)与实测值之间存在一定差异[25]。针对上述问题, 在GDPS 1.3及以后版本的大气校正模块中增加了替代定标增益因子(vicarious calibration gains), 由KOSC标准大气校正算法反演得到的遥感反射率产品Rrs(443), Rrs(490), Rrs(555), Rrs(680)与实测值的的绝对误差百分比(Absolute Percentage Difference, APD)分别为25.4%, 16.5%, 13.5%, 35.5%[27]

由于近岸水体为浑浊的二类水体, 悬浮物浓度较高时, 对CDOM反演及水体光学特性有一定影响[9, 30]。悬浮物浓度较高的水体(> 25 g/m3), 随着浓度增加, 波谱反射峰值产生“ 红移” [31], 但在400~550 nm, 悬浮物浓度的变化对Rrs影响较小[32]。在悬浮物浓度较高(平均浓度18.66 g/m3)的春季(3~5月), YOC算法反演的CDOM与实测值绝对误差百分比为16%~40%; 悬浮物浓度较低(平均浓度2.87 g/m3)的秋季(9~10月), 其结果APD为27%~49%; 总体APD为35.9%, R2=0.82, 算法表现稳定[29]。另一方面, 悬浮物浓度过高的水体(江苏浅滩与长江河口)在近红外波段反射率过高, 出现过饱和现象, 导致暗像元假设不成立, 该部分水体在大气校正过程中误认为气溶胶[33~35]。GDPS就这一问题进行了改进, 并将误差较大区域腌膜(图2)[27]

YOC算法反演TSM效果良好, 春季反演结果与实测值间的绝对误差百分比为20%~30%; 秋季为20%~60%; 总体APD为46%, R2=0.92。

图2 2015年5月12日江苏近海CDOM变化
白色区域为由于云覆盖而在大气校正时被掩膜(陆架区域), 或由于近红外波段反射率过高无法反演(沿岸区域)
Fig.2 CDOM variation in the coastal waters of Jiangsu on 12 May, 2015
The white areas are the regions masked byatmospheric correction due to the cloud coverage (shelf area), or too high reflectance at the near infrared wavelength to retrieve (offshore area)

3 结果与讨论
3.1 CDOM日变化

2015年5月12日江苏近海CDOM逐时变化(图2)表明长江口区域、南黄海西岸CDOM吸收系数较高, 其次是南黄海南部, 南黄海中部最低, 总体为近岸海域大于远离海岸的中央海区, 南方海域高于北方海域。江苏沿海地区城镇化与海洋经济发展造成近岸海域生态环境的不稳定[36], 陆源有机污染物输入是南黄海西岸区域CDOM高浓度的主要原因, 所以呈现自西向东逐渐减少的态势[37]。长江口区域高值主要分布在122.5° ~123° E, 不同于南黄海西岸的由近岸向远海逐渐扩展的分布特征。这是由于长江口最大混浊带外的条带状区域表层叶绿素浓度高于附近海域[38], 浮游植物与细菌等生物活动、长江冲淡水与东海表层水团汇合, 导致该区域有机物富集, CDOM吸收系数明显偏高。南黄海南部主要受长江口海域的辐射影响, 因此外围的浓度低于近长江口海域的浓度。南黄海中部水体情况单一, 为一类水体, 该区域有机物以海源为主[37], 初夏黄海冷水团开始形成[39], 导致海水表面温度与叶绿素含量都低于南黄海南部海域, 浮游生物活动产生的有机物较少[40]; 且距离大陆较远, 陆源输入的影响较小, 所以这一海域的CDOM浓度最低。此外, 南黄海西岸与中南部海域交界处有一线状高值区, 这是由于黄海陆架海洋锋的存在[41, 42], 锋面的上升流使营养物质涌升, 使其成为生产力高的“ 海洋中的绿洲” [43], 因而CDOM浓度较高。且锋区辐聚现象的存在、锋面的屏障作用使营养盐、水体温度等无法交换, 这也是两侧CDOM等物质浓度差异较大的主要原因[41]

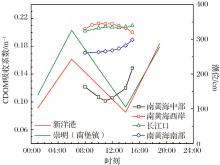
逐时变化(图3)表明南黄海西岸表层水体CDOM浓度日内变化趋势呈倒“ U” 型。采样区2内平均浓度上午逐渐升高, 10:16达到最大值0.213 m-1, 午间10:16~12:16保持较高浓度, 随后逐渐降低, 15:16最低, 为0.200 m-1, 日均为0.209 m-1。由于高浓度悬浮物的影响, 反演结果存在一定误差, 该结果较往年春季实测值高10%[9]。由于该区域的CDOM主要来源为地表径流与河流输入[37], 所以海水中CDOM浓度与陆地的距离呈负相关。江苏浅滩水体较浅, 物质搬运主要受潮汐的影响, 苏北沿岸流在春夏季方向为由南向北[44], 涨潮时, 南部海域CDOM含量较高的水体向北部移动。所以采样区2日内CDOM变化浓度在涨潮时上升, 停潮时保持稳定, 而退潮时则会下降。CDOM变化比潮位变化滞后2~3 h, 一是由于潮位站与采样区之间的距离造成监测的滞后, 二是物质输送速率小于水体运动的速率。长江口区域日内采样区3的平均CDOM吸收系数为(0.206± 0.005)m-1, 日均为0.208 m-1, 与朱伟健等[45]2009年5月航次实测值(440 nm吸收系数变化范围为0.200~0.770 m-1, 均值0.37 m-1)相比, 低估了40%左右, 可能是受冲淡水的影响[45]。采样区3日变化较小, 与该区域的物质来源关系密切。除了长江淡水输送陆源的CDOM与浮游生物现场生产的有机物之外, 表层沉积物的再悬浮也是近岸水体中CDOM的重要来源, 而潮汐流与长江入海水的共同作用使表层沉积物再悬浮, 致使采样区3的CDOM浓度居高不下。采样区1和4离岸较远, 潮汐活动影响很小, 日内CDOM整体呈现上升的趋势, 由于这2个区域的CDOM以海源生物生产为主[37], 白天的海水表层温度在光照作用下有所上升, 其变化主要由生物活动逐渐频繁所致。

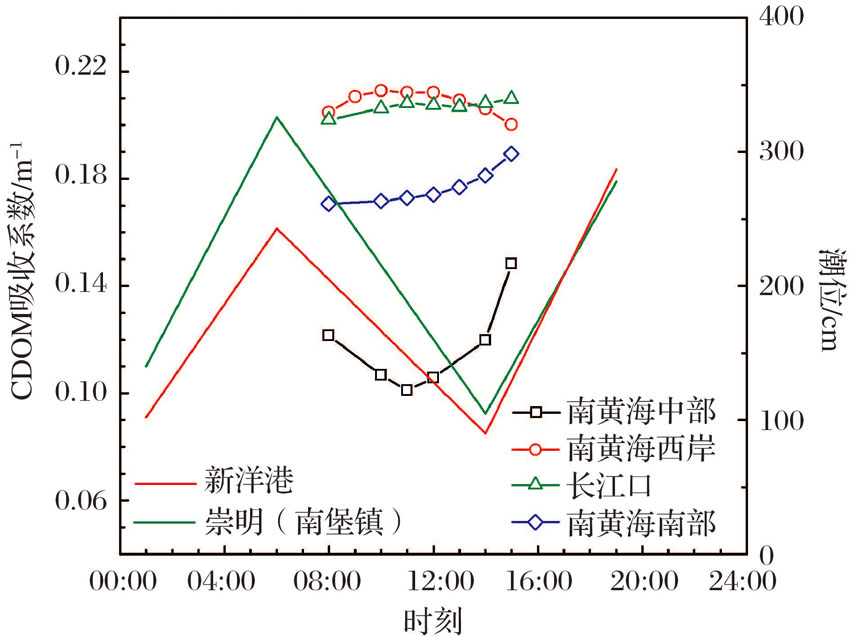
图3 2015年5月12日各采样区CDOM逐时变化
数据点为成像时刻采样区内CDOM浓度的平均值
Fig.3 Hourly CDOM of sampling areas on 12 May, 2015
Points are average values of CDOM concentration in the sampling area of the imaging time

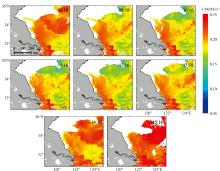
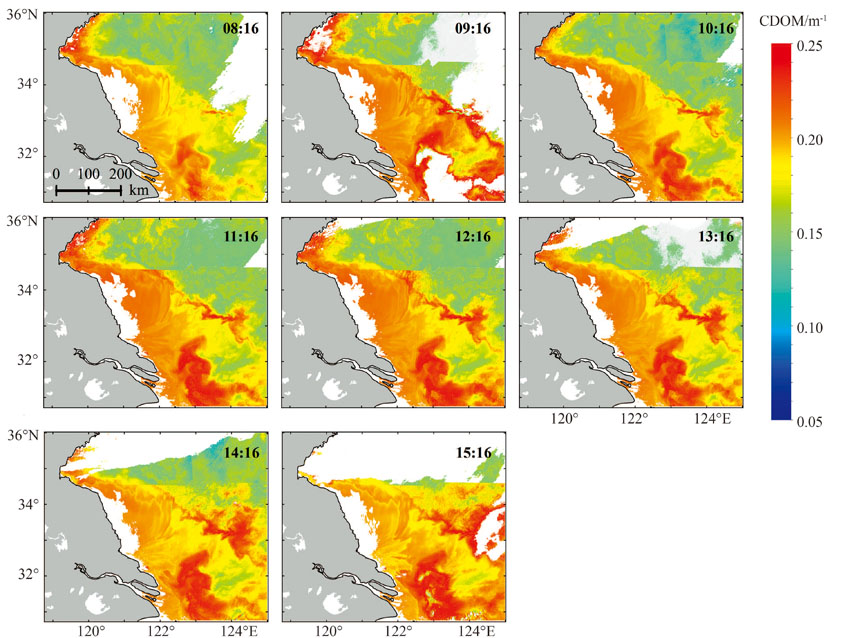
2015年10月15日江苏沿海CDOM逐时变化空间分布特征(图4)与5月12日基本一致, 长江口、南黄海西岸、南黄海南部、南黄海中部依次降低, 近岸海域大于远岸海域。南黄海西岸CDOM高值区呈现扇形分布, 由于10月南黄海西岸附近黄海冷水团及水体跃层的减弱, 陆架锋锋面向东推移[39, 41], 因此高值区域较春季向东有所扩大。南黄海南部受低温的黄海水团冲淡影响, 高值区域有所减小。

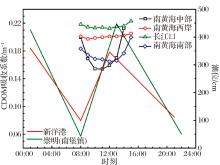
10月15日江苏沿海CDOM逐时变化表明4个采样区日内CDOM平均浓度变化均呈“ U” 型(图5)。由于10月15日新洋港、崇明(南堡镇)2个潮位站没有潮位观测值, 故使用9月30日与10月30日的平均值代替。采样区2内平均浓度上午由0.200 m-1逐渐降低至0.154 m-1, 12:16开始逐渐上升, 15:16达最大值0.234 m-1

由于苏北沿岸流持续增强, 南黄海西岸CDOM浓度变化主要受潮汐影响[21], 趋势与潮位变化一致。由于秋季南黄海中部冷水团衰减, 次表层海水温度升高, 与表层水体物质交换频繁[39], 生物活动增多, CDOM浓度较春季有所增加, 日均值由0.117 m-1增长为0.174 m-1。南黄海区域CDOM浓度变化范围为0.154~0.234 m-1, 与周虹丽等[24]2008年9月航次实测 (440 nm吸收系数变化范围0.060~0.230 m-1)结果基本一致。秋季长江冲淡水流量减少, 黄海、东海混合水团在长江口附近海域形成, 长江口区域物质运输行为受该混合水团影响[46], 因此采样区3的CDOM浓度日变化主要受潮汐影响。且台湾暖流前缘水的北上增强诱发长江口外海海域上升流[47], 表层沉积物再悬浮且营养物质更为丰富, 采样区3日变化范围为0.212~0.223 m-1, 均值为0.216 m-1, 高于5月12日的0.208 m-1, 与2013年10月航次实测结果(0.15~0.29 m-1)吻合[21], 但无更高值(> 0.235 m-1)的结果。

图4 2015年10月15日江苏沿海CDOM变化Fig.4 CDOM variation in the coastal waters of Jiangsu on 15 October, 2015

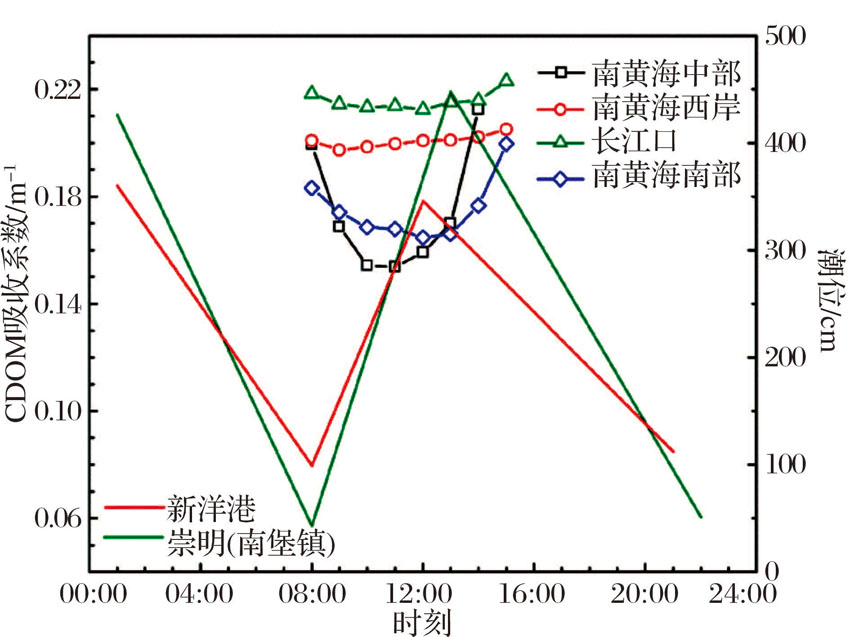
图5 2015年10月15日各采样区CDOM逐时变化Fig.5 Hourly CDOM of sampling areas on 15 October, 2015

3.2 多年周平均CDOM变化

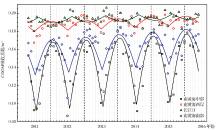
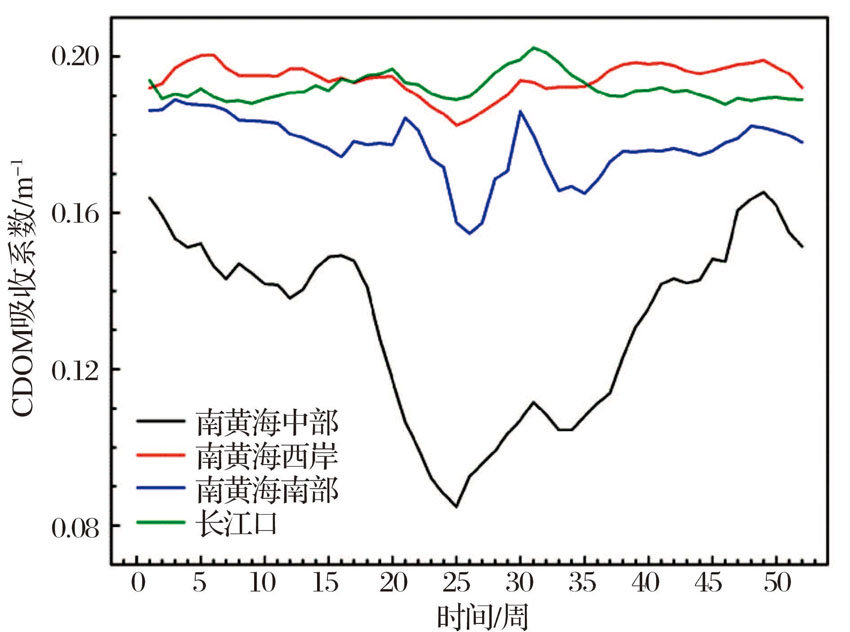
将每年52个周CDOM的反演结果按采样区提取并计算多年平均值, 得到每个采样区多年周平均CDOM吸收系数的变化(图6)。

可以看出, 南黄海西岸海域与长江口海域全年CDOM浓度较高, 是由于陆源有机物的持续输送。在20~31周, 4个区域浓度都呈现出显著的“ V” 型变化, 其主要原因为初夏黄海冷水团开始形成, 水体出现跃层, 表层营养盐缺失, 抑制了浮游生物生长[48], 影响效果由南黄海中央向周围海域逐渐减弱, 南黄海中部海域变化幅度最大, 长江口海域最小; 而25周后, 夏季海水温度逐渐升高, 次表层水体跃层的屏障作用减弱, 生物活动增加, 各区域CDOM吸收系数逐渐回升, 在31周左右到达极值。而后的小幅度下降以南黄海南部尤为明显, 可能与夏季较强光照导致CDOM光化学降解有关[49]

图6 多年周平均CDOM变化Fig.6 Multi-year variation of weekly average CDOM

3.3 月平均CDOM的年际变化

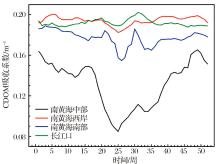
计算2011年4月至2016年5月各研究子区的CDOM浓度月平均数据, 得到气候态月平均变化情况(图7)。针对其周期性, 利用余弦函数模型对CDOM月均值进行回归分析, 以更好地揭示其随时间变化特征:

y=A+Bx+C|cos(2π x/24+D)| (4)

式中:A+Bx描述CDOM浓度的线性变化趋势; C|cos(2π x/24+D)|描述月均值的周期性循环; 其中x代表2011年4月以后的月数(1相当于2011年4月); y代表x月的平均CDOM浓度。A, B, C, D为模型参数, B代表月平均变化趋势, C代表月尺度变化的振幅。

图7 月平均CDOM变化Fig.7 Variation of monthly average CDOM

月尺度下, 长江口海域CDOM浓度最高, 变化范围为0.180~0.206 m-1, 较2011— 2014年实测结果(0.150~0.360 m-1)更保守[21]; 南黄海西岸次之, 为0.167~0.201 m-1; 南黄海中南部最低, 为0.086~0.187 m-1, 与日、周尺度下的分析结果相符合。南黄海中部、西岸及南部海域CDOM吸收系数月均值变化有明显的周期性(图7), 冬季、春季高于夏季、秋季, 在每年的1, 2, 12月达到最大, 6, 7月最小[21, 23]。南黄海中部的拟合效果最好, R2为0.823(表1), 主要原因是CDOM来源稳定, 以海洋源生为主, 受黄海水团的控制, 随季节变化明显。南黄海南部的情况与中部相似, 拟合效果较好, 但长江冲淡水与黄海、东海水团的共同影响使情况变得复杂。南黄海西岸水体较浅, 秋季和冬季向外海输送扩散CDOM, 而在春季和夏季大部分沉积在浅海、河口附近, 导致春夏季表层CDOM浓度偏低, 形成沿海区域CDOM“ 春夏储秋冬运” 的季节性运动特征[44], 人工排放有机污染物的随机性导致陆源输入不稳定, 所以拟合优度较低。

表1 月平均CDOM变化拟合参数 Table 1 Fitting parameters of monthly average CDOM

长江口海域的月尺度变化周期性较弱, 主要由于CDOM来源多样, 有冲淡水的输入、浮游植物与细菌活动产生以及沉积物再悬浮; 水体成分也极其复杂, 有冲淡水、黄东海混合水团、台湾暖流等。与其他子区季节变化特征相反, 长江口CDOM浓度夏季、秋季高于冬季、春季, 在每年的7~8月达到最大, 1月和12月最小[21, 22], 主要因为夏季长江的巨量径流携带大量的污染物与营养盐[50, 51]。由于CDOM产品对高值部分的计算较为保守(最大值为0.235 m-1), 长江口附近海域的浓度应该更高[21, 45]。南黄海西岸与长江口子区的模拟参数A较大, 且振幅C小于南黄海中部、南部子区, 说明沿岸2个子区CDOM浓度较高, 且常年处于高值; 4个子区的线性参数B均为正值, 说明CDOM浓度在逐年缓慢上升。

3.4 CDOM与TSM的关系

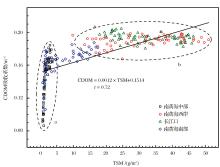
将4个研究子区的CDOM浓度与TSM浓度月平均值进行相关性分析 (图8), 通过了显著性水平为0.05的F检验, 表明研究区内CDOM与TSM显著正相关。

各研究子区CDOM与TSM的相关性有空间差异。在悬浮物浓度较低(月均值小于5 g/m3)的南黄海中部, CDOM浓度随TSM上升而增加的变化量较大(图8a), 正相关关系较显著。在南黄海南部, 悬浮物浓度季节性差异明显, 冬春季高于夏秋季[52], CDOM浓度与其变化特征基本一致。悬浮物浓度较高(月均值大于10 g/m3)的南黄海西岸与长江口海域, CDOM浓度常年较高, 随TSM变化不显著(图8b), 在其他悬浮物浓度较高的沿岸水体及内陆河流也发现类似现象[30, 53]

图8 月平均CDOM与TSM的关系Fig.8 Relationship of monthly average CDOM and TSM

4 结论与展望

江苏近海CDOM主要来源为陆地与河流径流, 其次由海洋浮游植物与细菌活动所产生[37], 因此总体空间分布特征为近岸高、远岸低; 长江口外海海域上升流的存在[38, 50], 该子区在最大混浊带外CDOM浓度最高。由于南黄海中南部海洋锋的存在, 夏季会在锋区出现线状高值区, 且锋面两侧物质分布差异较大[41~43]。江苏近岸海域与长江口水深较浅, 日内CDOM变化主要受潮汐影响[44], 但比潮位变化滞后2~3 h; 远海区域受光照与海表温度影响, 日内呈先下降后上升的变化特征。由于江苏浅滩高浓度悬浮物的影响, CDOM反演结果偏高10%左右; 但在长江口区域结果较为保守, CDOM产品低估了高于0.235 m-1的部分, 但时空变化特征与同类研究基本一致[21]。各研究区在20~31周都呈现出显著的“ V” 型变化, 主要是由于初期黄海冷水团与水体跃层的形成阻碍了养分、盐分、水温等垂向交换, 造成南黄海中心区域生产力下降[39, 40], CDOM浓度快速下降, 后期冷水团及跃层的衰退为营养盐等物质上下层交换提供了条件, 表层生物活动逐渐增多, CDOM浓度有所回升。南黄海各区域CDOM月变化周期性显著, 冬春季高于夏秋季; 长江口附近海域水体情况复杂, 周期性较弱, 由于冲淡水流量的季节性变化导致该区CDOM浓度夏秋季高于冬春季。

月尺度下, CDOM浓度与TSM浓度呈正相关关系, 相关系数r=0.72, 但存在空间差异性, 南黄海中部与南部相关性较显著, 南黄海西岸与长江口海域次之。

CDOM时空变化的影响因素众多, 本文只分析了潮汐、海流、水团、悬浮物等因素, 需在进一步的研究中纳入盐度、温度、光照、叶绿素a含量以及生物量等参量, 深入探究CDOM生成与消亡的机理, 以此来揭示CDOM的来源与运动轨迹, 对海洋环境与生态污染监测与防治有重要意义。

The authors have declared that no competing interests exist.

参考文献
[1] Del Castillo C E, Coble P G, Morell J M, et al. Analysis of the optical properties of the Orinoco River plume by absorption and fluorescence spectroscopy[J]. Marine Chemistry, 1999, 66(1/2): 35-51. [本文引用:1]
[2] Del Vecchio R, Blough N V. Spatial and seasonal distribution of chromophoric dissolved organic matter and dissolved organic carbon in the Middle Atlantic Bight[J]. Marine Chemistry, 2004, 89(1/4): 169-187. [本文引用:1]
[3] Andrew A A, Del Vecchio R, Subramaniam A, et al. Chromophoric Dissolved Organic Matter (CDOM) in the Equatorial Atlantic Ocean: Optical properties and their relation to CDOM structure and source[J]. Marine Chemistry, 2013, 148: 33-43, doi: 10.1016/j.marchem.2012.11.001. [本文引用:1]
[4] Steinberg D K, Nelson N B, Carlson C A, et al. Production of Chromophoric Dissolved Organic Matter (CDOM) in the open ocean by zooplankton and the colonial cyanobacterium Trichodesmium spp[J]. Marine Ecology Progress Series, 2004, 267: 45-56. [本文引用:1]
[5] Del Vecchio R, Subramaniam A. Influence of the Amazon River on the surface optical properties of the western tropical North Atlantic Ocean[J]. Journal of Geophysical Research: Oceans, 2004, 109(C11), doi: 10.1029/2004JC002503. [本文引用:1]
[6] Pan X, Mannino A, Russ M E, et al. Remote sensing of the absorption coefficients and chlorophyll a concentration in the United States southern Middle Atlantic Bight from SeaWiFS and MODIS-Aqua[J]. Journal of Geophysical Research: Oceans, 2008, 113(11): C11022. [本文引用:1]
[7] Siegel D A, Maritorena S, Nelson N B, et al. Global distribution and dynamics of colored dissolved and detrital organic materials[J]. Journal of Geophysical Research: Oceans, 2002, 107(12): C12. [本文引用:1]
[8] Mannino A, Novak M G, Hooker S B, et al. Algorithm development and validation of CDOM properties for estuarine and continental shelf waters along the northeastern U. S. Coast[J]. Remote Sensing of Environment, 2014, 152: 576-602. [本文引用:1]
[9] Wu Shaoyuan, Wu Yongsen, Zhang Shikui. The satellite retrieval of marine yellow substance in Yellow Sea and East China Sea[J]. Oceanologia et Limnologia Sinica, 2013, 44(5): 1 223-1 228.
[吴绍渊, 吴永森, 张士魁. 黄、东海海洋黄色物质的卫星反演[J]. 海洋与湖沼, 2013, 44(5): 1 223-1 228. ] [本文引用:3]
[10] Kalle K. Fluorescence and contents of yellow substance in the Gulfs of Bothnia and Finland [J]. Deutsche Hydrographische Zeitschrift, 1949, 2(4): 117-124. [本文引用:1]
[11] Gagosian Robert B, Stuermer Daniel H. The cycling of biogenic compounds and their diagenetically transformed products in seawater[J]. Marine Chemistry, 1977, 4(5): 605-633. [本文引用:1]
[12] Bricaud A, Morel A, Prieur L. Absorption by dissolved organic matter of the sea (yellow substance) in the UV and visible domains[J]. Limnology and Oceanography, 1981, 26(1): 43-53. [本文引用:1]
[13] Helms J R, Stubbins A, Ritchie J D, et al. Absorption spectral slopes and slope ratios as indicators of molecular weight, source, and photobleaching of chromophoric dissolved organic matter[J]. Limnology and Oceanography, 2008, 53(3): 955-969. [本文引用:1]
[14] Swan C M, Siegel D A, Nelson N B, et al. Biogeochemical and hydrographic controls on chromophoric dissolved organic matter distribution in the Pacific Ocean[J]. Deep-Sea Research Part I: Oceanographic Research Papers, 2009, 56(12): 2 175-2 192. [本文引用:1]
[15] Stedmon C A, Markager S, Kaas H. Optical properties and signatures of Chromophoric Dissolved Organic Matter (CDOM) in Danish coastal waters. Estuarine[J]. Coastal and Shelf Science, 2000, 51(2): 267-278. [本文引用:1]
[16] Stedmon C A, Osburn C L, Kragh T. Tracing water mass mixing in the Baltic-North Sea transition zone using the optical properties of coloured dissolved organic matter[J]. Coastal and Shelf Science, 2010, 87(1): 156-162. [本文引用:1]
[17] Lei Hui, Pan Delu, Tao Bangyi, et al. The spectral absorption and distribution characteristics of CDOM in the typical waters of the East China Sea[J]. Acta Oceanological Scinica, 2009, 31(2): 57-62.
[雷惠, 潘德炉, 陶邦一, . 东海典型水体的黄色物质光谱吸收及分布特征[J]. 海洋学报, 2009, 31(2): 57-62. ] [本文引用:1]
[18] Wang Lin, Zhao Dongzhi, Yang Jianhong, et al. Near ultraviolet absorption spectral properties of Chromophoric Dissolved Organic Matter in the north area of Yellow Sea[J]. Spectroscopy and Spectral Analysis, 2010, 30(12): 3 379-3 383.
[王林, 赵冬至, 杨建洪, . 黄海北部CDOM近紫外区吸收光谱特性研究[J]. 光谱学与光谱分析, 2010, 30(12): 3 379-3 383. ] [本文引用:1]
[19] Xie Linping, Wang Baodong, Xin Ming, et al. Distribution and spectral characteristics of Colored Dissolved Organic Matter in the costal area of Bohai Sea[J]. Advance in Marine Science, 2016, 34(1): 58-69.
[谢琳萍, 王保栋, 辛明, . 渤海近岸水体有色溶解有机物的光吸收特征及其分布[J]. 海洋科学进展, 2016, 34(1): 58-69. ] [本文引用:1]
[20] Xiao Longgeng, Chen Wensong, Chen Guofeng, et al. Fluorescence excitation-emission matrix spectroscopy of chromophoric dissolved organic matter in the South China Sea[J]. Acta Scientiae Circumstantiae, 2014, 34(1): 160-167.
[肖隆庚, 陈文松, 陈国丰, . 中国南海CDOM三维荧光光谱特征研究[J]. 环境科学学报, 2014, 34(1): 160-167. ] [本文引用:1]
[21] Yan Lihong, Su Rongguo, Duan Yali, et al. The fluorescence excitation emission matrix spectroscopy ofchromophoric dissolved organic matter in the Bohai Sea[J]. Oceanologia et Limnologia Sinica, 2013, 44(5): 1 162-1 169.
[闫丽红, 苏荣国, 段亚丽, . 渤海有色溶解有机物的三维荧光光谱特征[J]. 海洋与湖沼, 2013, 44(5): 1 162-1 169. ] [本文引用:8]
[22] Zhang Guopeng. Temporal and Spatial Distribution Characteristics of Yellow Substance in Yellow Sea and East China Sea[D]. Qingdao: Ocean University of China, 2015.
[张国朋. 黄东海黄色物质时空分布特征[D]. 青岛: 中国海洋大学, 2015. ] [本文引用:2]
[23] Zhou Hongli, Zhu Jianhua, Li Tongji. Study on the proportion distribution characteristics of three elements absorption in the coastal waters of China[J]. Journal of Ocean Technology, 2014, 33(5): 59-65.
[周虹丽, 朱建华, 李铜基. 中国近海水体三要素吸收系数的比例分布特征研究[J]. 海洋技术学报, 2014, 33(5): 59-65. ] [本文引用:2]
[24] Zhou Hongli, Zhu Jianhua, Li Tongji, et al. Interannual variability analysis of yellow substance content in typical nearshore area of China[J]. Ocean Technology, 2012, 31(3): 60-63.
[周虹丽, 朱建华, 李铜基, . 中国近海典型海区黄色物质含量年际变化分析[J]. 海洋技术, 2012, 31(3): 60-63. ] [本文引用:2]
[25] Zheng Xiaoshen, Wei Hao, Wang Yuheng. Seasonal and inter-annual variations of Chlorophyll-a concentration based on the remote sensing data in the Yellow Sea and East China Sea[J]. Oceanologia et Limnologia Sinica, 2012, 43(3): 649-654.
[郑小慎, 魏皓, 王玉衡. 基于水色遥感的黄、东海叶绿素a浓度季节和年际变化特征分析[J]. 海洋与湖沼, 2012, 43(3): 649-654. ] [本文引用:2]
[26] Ahn J H, Park Y J, Ryu J H, et al. Development of atmospheric correction algorithm for Geostationary Ocean Color Imager (GOCI)[J]. Ocean Science Journal, 2012, 47(3): 247-259. [本文引用:1]
[27] Ahn J H, Park Y J, Kim W, et al. Vicarious calibration of the geostationary ocean color imager[J]. Optics Express, 2015, 23(18): 23 236-23 258. [本文引用:3]
[28] Tassan S. Local algorithms using seawifs data for the retrieval of phytoplankton, pigments, suspended sediment, and yellow substance in coastal waters[J]. Applied Optics, 1994, 33(12): 2 369-2 378. [本文引用:1]
[29] Siswanto E, Tang J, Yamaguchi H, et al. Empirical ocean-color algorithms to retrieve chlorophyll-a, total suspended matter, and colored dissolved organic matter absorption coefficient in the Yellow and East China Seas[J]. Journal of Oceanography, 2011, 67(5): 627-650. [本文引用:2]
[30] Devlin M J, Barry J, Mills D K, et al. Relationships between suspended particulate material, light attenuation and Secchi depth in UK marine waters[J]. Estuarine, Coastal and Shelf Science, 2008, 79(3): 429-439. [本文引用:2]
[31] Chen Tao, Li Wu, Wu Shuchu. The relation between suspended sediment concentration and the maximum of the spectral reflectance[J]. Acta Oceanologica Sinica, 1994, 16(1): 38-43.
[陈涛, 李武, 吴曙初. 悬浮泥沙浓度与光谱反射率峰值波长红移的相关关系[J]. 海洋学报, 1994, 16(1): 38-43. ] [本文引用:1]
[32] Fan Hui, Huang Haijun, Tang Junwu. Spectral signature of waters in Huanghe Estuary and estimation of suspended sediment concentration from remote sensing data[J]. Geomatics and Information Science of Wuhan University, 2007, 32(7): 601-604.
[樊辉, 黄海军, 唐军武. 黄河口水体光谱特性及悬沙浓度遥感估测[J]. 武汉大学学报: 信息科学版, 2007, 32(7): 601-604. ] [本文引用:1]
[33] Hu C, Carder K L, Muller-Karger F E. Atmospheric correction of SEAWiFS imagery over turbid coastal waters: A practical method[J]. Remote Sensing of Environment, 2000, 74(2): 195-207. [本文引用:1]
[34] Siegel D A, Wang M H, Maritorena S, et al. Atmospheric correction of satellite ocean color imagery: The black pixel assumption[J]. Applied Optics, 2000, 39(21): 3 582-3 592. [本文引用:1]
[35] Wang Menghua, Wei Shi. The NIR-SWIR combined atmospheric correction approach for MODIS ocean color data processing[J]. Optics Express, 2007, 15(24): 15 722-15 733. [本文引用:1]
[36] Wang Guangsheng. A Study on the Interplay between the Coastal Economic Growth and the Marine Environmental Pollution[D]. Qingdao: Ocean University of China, 2013.
[王光升. 中国沿海地区经济增长与海洋环境污染关系实证研究[D]. 青岛: 中国海洋大学, 2013. ] [本文引用:1]
[37] Liu Jun, Yu Zhigang, Zang Jiaye, et al. Distribution and budget of organic carbon in the Bohai and Yellow Seas[J]. Advances in Earth Science, 2015, 30(5): 564-578.
[刘军, 于志刚, 臧家业, . 黄渤海有机碳的分布特征及收支评估研究[J]. 地球科学进展, 2015, 30(5): 564-578. ] [本文引用:5]
[38] Zhu Jianrong. The distribution and dynamic analysis of chlorophyll a concentrations in Yangtze estuary[J]. Science in China (Series D), 2004, 34(8): 757-762.
[朱建荣. 长江口外海区叶绿素a浓度分布及其动力成因分析[J]. 中国科学: D辑, 2004, 34(8): 757-762. ] [本文引用:2]
[39] Yu Fei, Zhang Zhixin, Diao Xinyuan, et al. Analysis of evolution of the Huanghai Sea cold water mass and its relationship with adjacent water masses[J]. Acta Oceanologica Sinica, 2006, 28(5): 26-34.
[于非, 张志欣, 刁新源, . 黄海冷水团演变过程及其与邻近水团关系的分析[J]. 海洋学报, 2006, 28(5): 26-34. ] [本文引用:4]
[40] Liu Chunying, Liu Huanhuan, Yang Guipeng, et al. Relationships among the distributions of acrylic acid marine environmental factors and chlorophyll a in the Yellow Sea Cold Water Mass in summer[J]. Advances in Earth Science, 2014, 29(3): 361-368.
[刘春颖, 刘欢欢, 杨桂朋, . 夏季黄海冷水团海域的丙烯酸分布与海洋环境因子和叶绿素a变化之间的关系[J]. 地球科学进展, 2014, 29(3): 361-368. ] [本文引用:2]
[41] Zhao Baoren. A preliminary study of continental shelf front in the western part of Southern Huanghai Sea and circulation structure in the front region of the Huanghai Cold Water Mass(HCWM)[J]. Oceanologia et Limnologia Sinica, 1987, 18(3): 218-226.
[赵保仁. 南黄海西部的陆架锋及冷水团锋区环流结构的初步研究[J]. 海洋与湖沼, 1987, 18(3): 218-226. ] [本文引用:4]
[42] Ren Shihe, Wang Hui, Liu Na. Review of ocean front in Chinese marginal seas and frontal forecasting[J]. Advances in Earth Science, 2015, 30(5): 552-563.
[任诗鹤, 王辉, 刘娜. 中国近海海洋锋和锋面预报研究进展[J]. 地球科学进展, 2015, 30(5): 552-563. ] [本文引用:1]
[43] Wei Qinsheng, Xin’gang, Wang Zongxing, et al. A preliminary analysis of the characteristics of the continental shelf front and its ecological effects in the Yellow Sea[J]. Advances in Earth Science, 2010, 25(4): 435-443.
[韦钦胜, 吕新刚, 王宗兴, . 黄海陆架锋特征及其生态效应的初步分析[J]. 地球科学进展, 2010, 25(4): 435-443. ] [本文引用:2]
[44] Pang Chongguang, Bai Xuezhi, Hu Dunxin. The transport and sedimentation of suspended matter and their seasonal variation are affected by circulation and tide current in the Bohai Sea, the Yellow Sea and the East China Sea[J]. Studia Marina Sinica, 2004, (46): 32-41.
[庞重光, 白学志, 胡敦欣. 渤、黄、东海海流和潮汐共同作用下的悬浮物输运、沉积及其季节变化[J]. 海洋科学集刊, 2004, (46): 32-41. ] [本文引用:3]
[45] Zhu Weijian, Shen Fang, Hong Guanlin. Optical characteristics of Colored Dissolved Organic Material (CDOM) in Yangtze Estuary[J]. Environmental Science, 2010, 31(10): 2 292-2 298.
[朱伟健, 沈芳, 洪官林. 长江口及邻近海域有色溶解有机物(CDOM)的光学特性[J]. 环境科学, 2010, 31(10): 2 292-2 298. ] [本文引用:3]
[46] Cheng Yuanyue, Guo Weidong, Hu Minghui. Fluorescence characteristics of dissolved organic matter released from estuarine sediments during resuspension[J]. Geochimica, 2008, 37(1): 51-58.
[程远月, 郭卫东, 胡明辉. 近岸沉积物再悬浮期间所释放溶解有机物的荧光特征[J]. 地球化学, 2008, 37(1): 51-58. ] [本文引用:1]
[47] Chen Guanxian. Marine Fishery Environment in China[M]. Hangzhou: Zhejiang Science and Technology Publishing House, 1991.
[陈冠贤. 中国海洋渔业环境[M]. 杭州: 浙江科学技术出版社, 1991. ] [本文引用:1]
[48] Wei Qinsheng, Fu Mingzhu, Li Yan, et al. Observation of the seasonal evolution of DO, chlorophyll a maximum phenomena and nutrient accumulating in the Southern Huanghai (Yellow) Sea Cold Water Mass area[J]. Acta Occanologica Sinica, 2013, 35(3): 142-154.
[韦钦胜, 傅明珠, 李艳, . 南黄海冷水团海域溶解氧和叶绿素最大现象值及营养盐累积的季节演变[J]. 海洋学报, 2013, 35(3): 142-154. ] [本文引用:1]
[49] Kieber J D, McDaniel J, Mopper K. Photochemical source of biological substrates in sea water: Implications for carbon cycling[J]. Nature, 1989, 6 243(341): 637-640. [本文引用:1]
[50] Zhao Baoren, Ren Guangfa, Cao Deming, et al. Characteristics of the ecological environment in upwelling area adjacent to the Changjiang River Estuary[J]. Oceanologia et Limnologia Sinica, 2001, 32(3): 327-333.
[赵保仁, 任广法, 曹德明, . 长江口上升流海区的生态环境特征[J]. 海洋与湖沼, 2001, 32(3): 327-333. ] [本文引用:2]
[51] Kong Dexing, Yang Hong, Wu Jianhui. Optical absorption properties of chromophoric dissolvable organic matter in Changjiang Estuary[J]. Marine Environmental Science, 2008, 27(6): 629-631, 646.
[孔德星, 杨红, 吴建辉. 长江口海域黄色物质光吸收特性[J]. 海洋环境科学, 2008, 27(6): 629-631, 646. ] [本文引用:1]
[52] Shao Mihua, Li Yan, Wang Zhengfang, et al. The spatial and temporal variation of suspended substance in the Changjiang Estuary area[J]. Marine Environmental Science, 1996, 15(3): 36-40.
[邵秘华, 李炎, 王正方, . 长江口海域悬浮物的分布时空变化特征[J]. 海洋环境科学, 1996, 15(3): 36-40. ] [本文引用:1]
[53] Song Kaishan, Liu Dianwei, Li Lin, et al. Spectral absorption properties of Colored Dissolved Organic Matter (CDOM) and Total Suspended Matter (TSM) of inland waters[C]∥Processing for SPIE 7811, Atmospheric and Environmental Remote Sensing Data Processing and Utilization VI: Readiness for GEOSS IV, 78110B. United States: SPIE Digital Library, 2010. [本文引用:1]