基于可预测模态分析技术的亚澳夏季风统计—动力季节预测模型及其回报技巧评估
[孙倩1  , 吴波
, 吴波2, * , 周天军2, 3 ]
, 吴波, 周天军|
|


作者简介:孙倩(1992-),女,四川乐山人,硕士研究生,主要从事气候预测研究.E-mail:sunqiancuit@163.com
受模式性能的限制,当前的气候模式在直接预报亚澳季风区的夏季降水变化方面技巧较低。采用统计—动力相结合的方法预报亚澳夏季风降水,首先从观测数据中提取具有清晰物理意义的可预报模态;然后,将国际ENSEMBLES计划提供的多模式、多集合样本耦合模式季节预测试验预测的可预报模态的主成分时间序列与对应观测得到的可预报模态的空间型组合,重构降水场,建立了针对亚澳夏季风降水的统计—动力结合的季节预测系统。分析了该系统提前1个月、4个月和7个月的回报技巧。结果表明,统计—动力预测系统的预测技巧显著优于纯动力预测的技巧。另一方面,多模式集合平均的预测技巧优于单个模式,因此针对季风区降水开展多模式集合预测是非常必要的。
First author:Sun Qian(1992-), female, Leshan City, Sichuan Province, Master student. Research areas include climate prediction.E-mail:sunqiancuit@163.com
*Corresponding author:Wu Bo(1982-),male,Hefei City,Anhui Province,Associate professor. Research areas include climate dynamics and climate modeling.E-mail:wubo@mail.iap.ac.cn
Due to the limitations of model performances, the predictive skills of current climate models for the Asian-Australian summer monsoon precipitation are still poor. The prediction based on the combination of statistical and dynamic approaches is an effective way to improve the predictive skills. We used such method to identify the predictable modes of the Asian-Australian summer monsoon precipitation with clear physical interpretation from the historical observational data. Then we combined the principal components time series of these modes predicted by the coupled models, which is derived from the seasonal prediction experiments in the ENSEMBLES project, and the corresponding spatial patterns derived from the above observational analysis to reconstruct the precipitation field. These formed a statistical-dynamic seasonal prediction model for the Asian-Australian summer monsoon precipitation. We analyzed the predictive skills of the model at 1-, 4-and 7-month leads. The result shows that the forecast skills of the statistical-dynamic prediction model are higher than those of the simple dynamic predictions. In addition, the predictive skills of the Multi-Model Ensemble (MME) mean are superior to those of any individual models. Therefore, it is very necessary to implement multi-model ensemble prediction for the monsoon precipitation.
亚澳季风(30° S~40° N, 40° ~160° E)是世界上最大的季风系统[1]。全球60%以上的人口生活在亚澳季风区。因此, 研究亚澳季风年际变率的机制, 并在此基础上进行季节预测具有重要的现实意义。亚澳季风区包括了东亚季风、南亚季风、澳洲季风和西北太平洋季风等4个典型的子季风区。其中, 前三者是陆地季风, 而西北太平洋季风是海洋季风[2~6]。
对亚澳季风及其子季风系统的年际变率机制已有大量研究。ENSO是影响亚澳季风年际变率的主导因子[7~16]。西北太平洋暖池区的海洋— 大气相互作用是影响亚澳季风年际变率的另外一个重要因子[9~11]。此外, 印度洋偶极子[17, 20]、欧亚大陆和青藏高原上的积雪覆盖也能够影响亚澳季风[2]。
数值模式是研究季风变化的重要工具。Wang等[21]评估了多个大气环流模式集合回报的亚洲夏季风降水, 发现大气环流模式对亚洲夏季风降水的回报技巧远低于对热带区域的回报技巧, 其原因在于, 在北半球夏季, 西北太平洋暖池区主要的海气相互作用过程是大气强迫海洋。缺少海气相互作用的大气环流模式无法抓住这种过程, 因而导致对亚洲夏季风降水的回报技巧和模拟技巧都较低[22~25]。Wang等[12]发现, 海气耦合模式的多模式集合平均能够模拟出亚澳季风降水年际变率的前2个主导模态, 其模拟技巧甚至优于ERA-40和NCEP-2再分析数据的结果。周天军等[22]分析了耦合气候系统模式FGOALS-s2的工业革命前控制试验, 结果表明, FGOALS-s2可以合理模拟出亚澳夏季风的主要年际变率特征。
利用耦合气候系统模式开展动力气候预测是季节预测的常规方法之一。 Wang等[26]评估了CliPAS计划中14个海气耦合模式多模式集合的季节预测结果, 发现多模式集合平均的预报水平优于单个模式的预报水平, 是减小误差的有效方法, 但是对陆地季风区的预报水平仍然偏低。Lee等[27]进一步分析了CliPAS计划中海气耦合模式提前1个月的回报技巧, 发现除了在东亚副热带季风区和热带西北太平洋季风区, 耦合模式对其他季风区降水的回报技巧相当高。
由于单纯的动力预测受模式能力和初值误差等条件的限制, 为借助统计方法提高预测水平, 发展出了动力预测与统计预测相结合的预测方法。如丑纪范提出的相似— 动力方法, 其基本思路是把预报场视为叠加在历史相似上的一个小扰动[28~30]。但是对于复杂模式而言, 直接建立以历史相似为基本态的相似— 动力模式在技术上存在很大困难, 因此进一步发展出利用历史相似样本对应的预报误差对当前预报误差进行估计并订正的方法[31~33]。郑志海等[34]发现基于相似— 动力模式的相似误差订正法能有效提高夏季降水和环流的季节预测技巧。李维京等[35]基于此方法开展了对ENSO季节到年际尺度的预测, 发现在12个月的预报时效内, 相似误差订正法的预测水平优于控制实验的结果。已有研究表明, 若在模式预测信息的基础上同时考虑前期预测因子的观测信息, 可以显著提高预测水平[36~39]。Lang等[37]发现中国夏季降水与南极涛动、北极涛动以及前期冬季海温有密切联系, 结合前期预测因子的观测结果以及同期气候因子的数值预报结果, 建立了统计和动力方法相结合的多元线性回归模型, 研究表明这种模型的预测技巧高于纯动力模式的预测技巧。郎咸梅[38]针对中国冬季降水, 采用多元线性回归分析方法建立统计和动力结合的气候预测模型, 结果表明此预测模型具有较好的预测效果。
为了提升对亚澳季风降水的预测技巧, Wang等[40]发展了“ 可预测模态分析” (Predictable Mode Analysis, PMA)方法。PMA是一种结合了经验分析、物理解释和回报试验的方法。其中, 经验分析的目的是找出年际变率的主导模态; 物理解释是建立预测这些主导模态的物理基础; 回报试验则是利用基于物理解释的经验预测方法或者基于动力模式的预测方法开展预测实践[1]。Lee等[41~43]将此方法用于预测亚洲冬季风温度和对流层环流异常。Wang等[1]利用PMA方法, 并结合使用4个耦合气候系统模式季节预测试验的结果, 构建了针对亚洲夏季风降水的季节预测模型。发现该模型具有高于纯统计或纯动力预测的技巧。但是Wang等[1]只分析了提前1个月的预测结果, 超前多个月份时, 该方法是否仍然有效, 目前尚不清楚。
欧盟委员会于2004年“ 全球变化与生态系统” 专题下启动了ENSEMBLES(Ensembles-Based Predictions of Climate Changes and Their Impacts)计划, 该计划由英国气象局哈德来中心(Hadley Centre)协调, 其目的是基于一些先进的高分辨率全球和区域地球系统模式以及欧洲的高分辨率格点资料, 建立集合气候预测系统, 开展从季节到年代际的气候概率预测[44]。大量研究表明, ENSEMBLES计划开展的集合预测对于气候系统的主要变率模态(如ENSO、太平洋— 北美型遥相关、北大西洋涛动等)的预测技巧较前期的DEMETER(Development of A European Multi model Ensemble System for seasonal to Interannual Prediction)计划相比, 有较大提高[44~47]。但是, ENSEMBLES计划多模式集合预测系统对于亚澳夏季风的回报技巧尚不清楚。
本研究的主要目的是, 基于PMA方法, 利用ENSEMBLES计划提供的多模式、多集合样本的回报结果, 针对亚澳夏季风建立统计— 动力结合的预测系统, 并分析该系统提前1个月、4个月和7个月的回报技巧。
本文使用的观测降水资料为全球气候降水计划(the Global Precipitation Climatology Project, GPCP)提供的月平均降水资料[48]; 海表面温度(Sea Surface Temperature, SST)资料为美国国家海洋和大气管理局(National Oceanic and Atmospheric Administration, NOAA)扩展重建的月平均SST资料ERSST[49]; 风场资料来自欧洲中期天气预报中心的再分析资料ERA Interim[50]。上述3类资料均涵盖研究时段为1979— 2010年。各类资料均进行了距平化处理, 气候态设为1979— 2010年的平均。
本文使用的模式数据由ENSEMBLES计划提供, 包括了6个耦合气候系统模式的回报结果。6个模式分别是:欧洲中期天气预报中心(European Centre for Medium-range Weather Forecasts, ECMWF)的IFS/HOPE-E、 德国莱布尼茨海洋科学研究所(the Leibniz Institute of Marine Sciences at the University of Kiel, IFM-GEOMAR)的ECHAM5 T63L31/MPIOM GR15L40、法国气象局(Meteo-France)的ARPEGEClimate4.6/OPA8.2/GELATO、英国气象局(the United Kingdom Meteorological office, UK Met Office)的HadGEM2和DePreSys HadCM3以及欧洲地中海气候变化中心(CMCC-Bologna)的ECHAM5/OPA8.2。6个模式在1960— 2005年的每年2月、5月、8月和11月起报, 其中2月、5月和8月预报的积分长度为7个月, 11月预报的积分长度为14个月。所有模式的每个起报月份均包括9个集合成员。本研究关注夏季风, 因此只分析5月、2月和前一年11月预报的结果, 分别代表提前1个月、4个月和7个月的预报结果。所有模式的结果均插值到2.5° × 2.5° 的网格。本文主要关注多模式集合(Multi-Model Ensemble, MME)平均的结果。MME平均是6个模式的简单平均。
基于Wang等[40]提出的“ 可预测模态分析” (Predictable Mode Analysis, PMA)方法, 利用ENSEMBLES计划提供的多模式集合季节预测试验结果, 构建针对亚澳夏季风降水的统计— 动力(S-D)预测模型。具体步骤如下:①首先对亚澳季风区的夏季(6~8月)降水距平进行EOF(Empirical Orthogonal Function)分析, 得到降水变化的主导模态; ②利用ENSEMBLES计划提供的多模式多成员的回报结果, 对亚澳季风区的夏季降水距平进行EOF分析, 将得到的主成分(Principal Components, PC)时间序列与观测的EOF空间型组合, 重构出降水场。该模型结合了统计分析得到的降水主导模态的空间型和ENSEMBLES模式动力预测的主导模态的时间演变, 因此称为S-D模型。
为了与S-D模型进行比较, 根据Wang等[1]使用的方法, 构建了基于物理解释的经验方法的预测模型(纯统计预测模型, SP模型), 具体步骤如下:①首先对观测亚澳季风区夏季降水距平做EOF分析; ②把海温、850 hPa风场距平与降水主导模态对应的PC时间序列做回归分析, 从而对夏季降水的主要模态进行物理解释; ③为每个模态选择相应的预报因子, 建立时间序列, 再结合观测的空间型, 重构出预报场。在建立SP模型时, 为了做出独立的回报, 本文用到了Michaelsen[51]提出的交叉验证法。具体做法为:在1979— 2010年, 依次去掉预报目标年份前后的3年, 再根据剩余年份的数据来建立统计关系, 对目标年份进行独立预报。
本文采用PMA方法构建S-D和SP模型预测亚澳夏季风降水。该方法的基础是通过EOF分析得到预报对象的主导模态。因此首先对亚澳季风区夏季(6~8月)降水距平进行 EOF分析, 前3个模态分别解释总方差的24.3%, 10.6%和9.2%。North准则检验表明, 3个模态彼此之间能够显著地分离开来[52]。
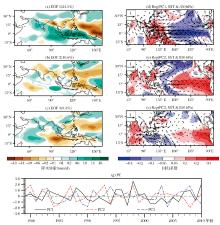
亚澳夏季风降水的第一模态空间型的主要特征是:海洋大陆、热带印度洋、东亚副热带锋区以及印度南北部的正降水异常, 菲律宾海、赤道西太平洋、印度中部和孟加拉湾北部的负降水异常(图1a)。该降水型对应处在发展位相的La Niñ a型SST异常, PC1时间序列与同期Niñ o3.4指数的相关系数为-0.73, 通过了显著性水平1%的检验。赤道中东太平洋海温偏冷, 而赤道西太平洋海温偏暖(图1d)。 赤道中东太平洋的冷SST异常抑制局地对流, 从而在其西侧激发出沿赤道对称的反气旋性大气Rossby波。由于平均环流的非对称性, 赤道以北的反气旋异常强度更大, 并向西延伸到西北太平洋[7, 8]。另一方面, 中太平洋变冷可以激发异常的Walker环流, 令海洋大陆降水增多, 该正的降水异常可以激发东传的大气Kelvin波, 与该Kelvin波相关的反气旋性涡度异常也对西北太平洋反气旋环流异常有贡献[1]。
亚澳夏季风降水的第二模态的主要特征包括:热带西北太平洋的负降水异常, 日本南部以及热带东印度洋的正降水异常(图1b)。该模态对应El Niñ o衰减位相的夏季, PC2时间序列与前冬Niñ o3.4指数的相关系数为0.58, 通过了显著性水平1%的检验。赤道中东太平洋仍然维持弱的SST暖异常, 热带西北太平洋存在冷SST异常, 热带印度洋呈现洋盆一致的SST暖异常, 处于印度洋洋盆模态的正位相(图1d)。对于环流型来说, 最显著的特征是对流层低层的西北太平洋异常反气旋(Western North Pacific Anomalous Anticyclone, WNPAC)。WNPAC是对局地负降水异常的Rossby波型响应。关于WNPAC及局地负降水异常的维持机制目前仍然存在争议。Wu 等[54]认为WNPAC是西北太平洋的冷海温异常和印度洋洋盆模态的正位相共同作用的结果。在初夏, 主要是西北太平洋的冷海温异常起作用, 但该冷海温异常在潜热通量和短波辐射通量异常的共同作用下逐渐衰减。在夏末, 主要是印度洋洋盆一致的暖海温异常通过激发大气Kelvin波令WNPAC维持[55, 56]。Wang等[1]则认为, WNPAC和印度— 太平洋偶极型海温之间存在正反馈过程, 令WNPAC能够维持。此局地正反馈指:当西北太平洋盛行东北信风时, WNPAC东南侧的东北风异常与气候平均风向同向, 因此局地风速增大, 潜热通量异常增大, SST变冷, 而此负的SST异常会进一步抑制局地对流, 从而激发出一个反气旋, 令WNPAC维持[7]。关于夏季WNPAC的维持机制值得进一步研究。
 | 图1 观测的亚澳夏季风(30° S~40° N, 40° ~160° E)降水距平年际变率的主导模态 (a)~(c)对观测的亚澳季风区夏季(6~8月)降水异常(mm/d)进行EOF分析, 得到的前3个主导模态的空间分布; 左上角括号里为各个模态的方差贡献; (d)~(f)3个主导模态分别对应的同期SST(K)和850 hPa风场异常(m/s)的回归, 打点区域表示通过了显著性水平为5%的检验; (g)前3个EOF模态对应的标准化的PC时间序列Fig.1 The leading modes of interannual variability of precipitation anomaly in the Asian-Australian Monsoon (AAM) domain (30° S~40° N, 40° ~160° E) during boreal summer (a)~(c) The first three leading EOF modes of precipitation anomaly (mm/d) in the AAM domain during boreal summer(JJA); Values in parentheses are the variance contribution rates of each mode; (d)~(f) The simultaneous regression maps of the SST (K) and 850 hPa wind anomalies (m/s) associated with the three modes; The dotted areas are the values with statistically significance at the 5% level; (g) The normalized principal component time series of the three modes |
第三模态最显著的特征是热带印度洋降水异常的偶极型分布, 即东南印度洋的负降水异常和西印度洋的正降水异常, 同时热带西北太平洋存在负的降水异常, 而中国东南部存在正的降水异常(图1c)。该模态对应的SST异常的空间分布呈现典型的印度洋偶极子型(Indian Ocean Dipole, IOD, 图1f)。东南印度洋负的SST异常抑制局地对流, 并在其西侧激发出沿赤道对称的反气旋性环流异常(图1f)。以往研究指出, IOD能够引起孟加拉湾及其邻近地区的非绝热加热异常, 从而通过激发北传Rossby波来影响东亚夏季风[1~19]。
上述3个模态的物理解释清楚, 本文将其定义为基于PMA方法揭示亚澳夏季风降水的可预报模态, 用于后文S-D预测模型的建立。
PMA方法的核心是:①使用历史观测数据, 通过EOF分析得到几个主导模态; ②通过某种方法对模态的PC时间序列进行预测; ③利用历史观测的EOF模态的空间型和预测的PC时间序列, 重构降水距平场。因此, 直接使用对历史观测数据进行EOF分析得到的PC时间序列参与重构, 代表了PMA方法可能达到的预测技巧的上限。
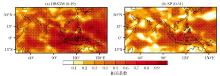
OBS3M是对亚澳夏季风降水距平进行EOF分析得到的前3个PC时间序列参与重构得到的降水场。亚澳季风区的夏季降水可能达到的预测技巧上限较高, 构造场与原始距平场的时间相关系数的区域平均为0.49。热带地区的预测技巧上限最高, 其中海洋大陆、热带西太平洋和热带印度洋预测技巧上限超过了0.7。副热带区域也有相当高的预测技巧上限, 大部分区域超过了0.3(图2a)。
基于前人研究, 亚澳夏季风降水的3个主导模态的预报因子为[1~57]:第一模态对应的预报因子为中太平洋5月减3月的海温距平和4~5月的平均北大西洋涛动指数; 第二模态的预报因子是印度洋和西北太平洋4~5月平均海温距平的纬向之差; 第三模态对应的预报因子是印度洋和海洋大陆5月减3月的纬向海温距平之差。
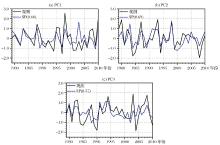
图3显示的是纯统计预测(Statistical Prediction, SP)用到的各个预报因子的时间序列, 括号内的值为预测的时间序列与对观测降水场进行EOF分析得到的PC时间序列的时间相关系数。前3个主导模态的时间序列的相关系数分别为0.60, 0.69和0.57。
SP模型的高预测技巧区主要分布在海洋大陆、西太平洋、菲律宾海、赤道东印度洋和西印度洋等热带地区, 预报场与原始距平场的时间相关系数超过了0.5(图2b)。另外, 印度北部、日本和中国西部的部分地区的预测技巧也较高, 时间相关系数超过了0.4。整个亚澳季风区的预测技巧的区域平均为0.31, 与可能达到的预测技巧的上限(图2a)相比, 亚澳季风区, 特别是副热带地区的预测技巧还有很大的提升空间。
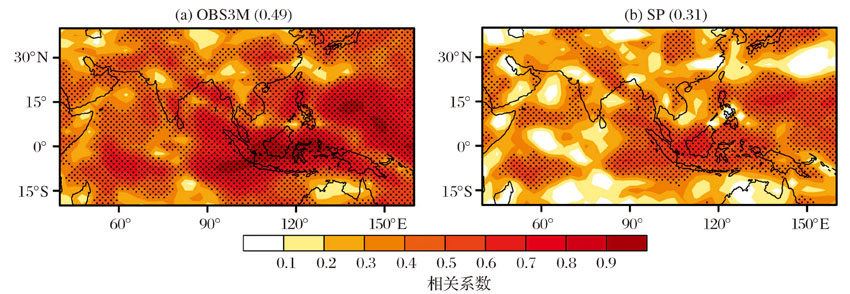 | 图2 PMA方法在亚澳季风区的预测技巧上限以及纯统计预测模型的预测技巧 (a)基于EOF分析得到的前3个模态重构的三维降水距平场与原始降水距平场的时间相关系数的空间分布, 它代表PMA方法可能达到的预报技巧的上限; (b)基于SP得到的前3个PC时间序列, 再结合观测数据中得到的EOF空间型重构的三维降水距平场, 与原始降水距平场的时间相关系数的空间分布; 括号内的值为相关系数在整个亚澳季风区的区域平均; 打点区域表示通过了显著性水平为5%的检验Fig.2 The upper level of the predictive skills based on the PMA method in the AAM region and the predictive skills of the statistical prediction model (a) Spatial distributions of the temporal correlations between the reconstructed precipitation anomaly field based on the first three leading EOF modesof the observational precipitation anomaly (OBS3M) and the raw observational anomaly field, which represents the upper level of the predictive skills based on the PMA method; (b) as in (a), but the predicted field is restructured based on the three PC time series obtained through the statistical prediction and the corresponding EOF patterns derived from the observation; Values in parentheses are the averages of the temporal correlations in the entire AAM region; The dotted areas are the values with statistically significance at the 5% level |
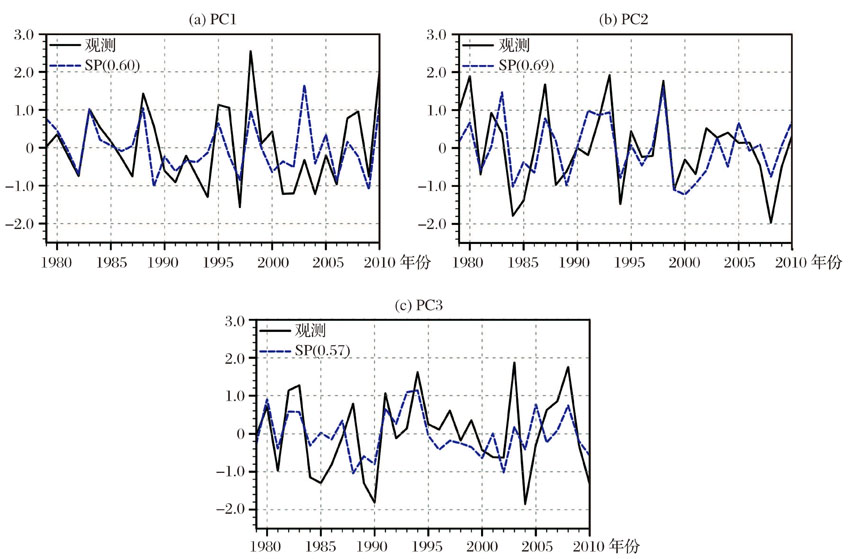 | 图3 主导模态对应的预测因子的标准化时间序列 (a)黑线为对观测降水距平场进行EOF分析得到的标准化的PC1时间序列, 蓝色虚线为SP得到的PC1时间序列; (b), (c)同(a), 但为PC2和PC3; 括号内的值为观测与预测的PC时间序列的相关系数Fig.3 The normalized PC time series of corresponding predictors of the leading modes (a) The black line is the normalized PC1 time series derived from the observational precipitation anomaly, The blue dashed line is the PC1 time series obtained through the statistical prediction; (b), (c) as in (a), but for the PC2 and PC3; Values in parentheses are the temporal correlations of PC time series from the observational and predicted fields |
纯动力预测(Dynamic Prediction, DP)直接使用动力模式MME平均的回报结果。我们通过集合回报的降水场与原始降水距平场的时间相关系数来评估DP的技巧。
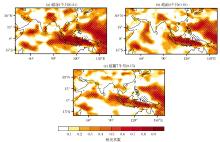
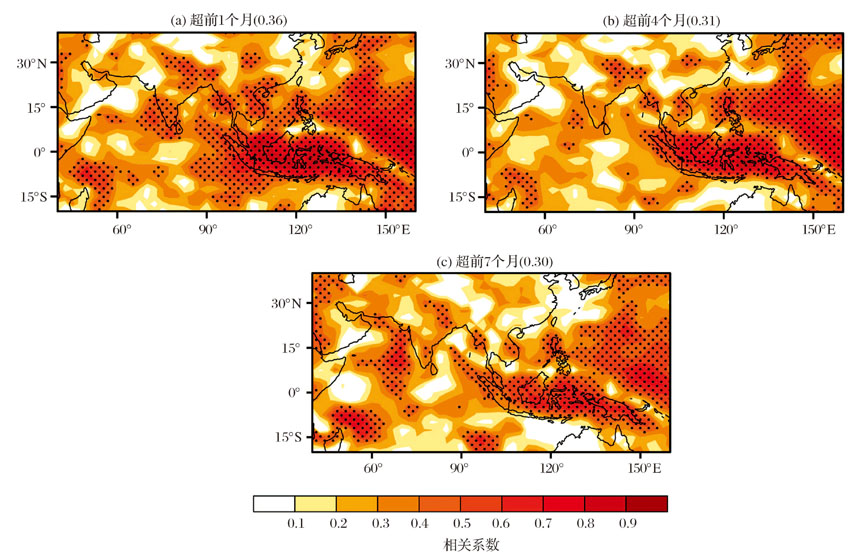
MME平均提前1个月、4个月以及7个月回报的亚澳夏季风降水场与原始降水距平场的时间相关系数的区域平均分别为0.24, 0.18和0.15(图4)。DP的技巧在赤道西太平洋、海洋大陆和赤道西印度洋的部分地区相对较高。此外, 回报时间提前1个月时, 中国华北和印度北部有一定的预测技巧; 回报时间提前4个月时, 这些区域的预测技巧降低, 通过显著性检验的区域范围缩小; 回报时间提前7个月时, 副热带区域几乎没有预测技巧。总体而言, DP的技巧随回报时间的提前而降低, 但即使只提前1个月回报, 整个亚澳夏季风区的预测技巧的区域平均也仅为0.24。DP对亚澳夏季风降水的预测技巧低于SP模型的技巧。
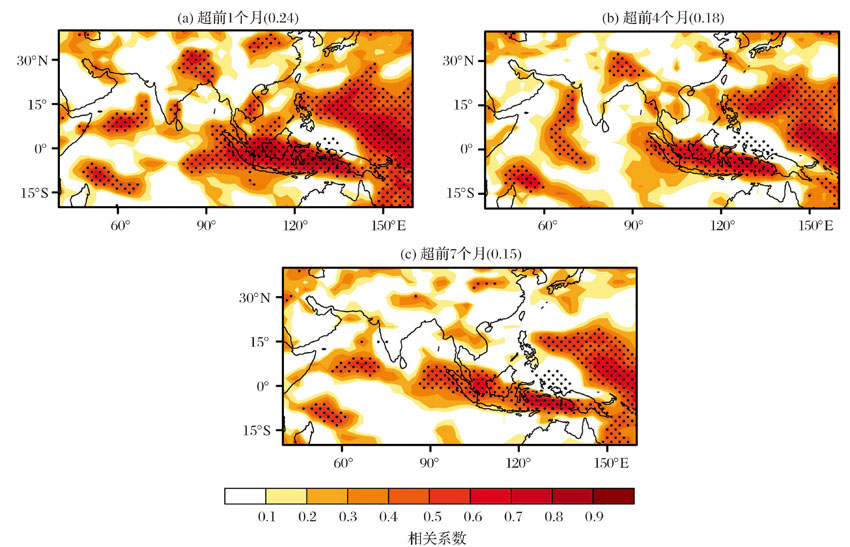 | 图4 MME平均对亚澳夏季风降水距平的预测技巧 (a)MME平均提前1个月回报的亚澳夏季风降水距平场与原始降水距平场的时间相关系数的空间分布; (b), (c)同(a), 但MME的起报时间分别提前4个月和7个月; 括号内的值为相关系数在整个亚澳季风区的区域平均; 打点区域表示通过了显著性水平为5%的检验Fig.4 The predictive skills of precipitation anomaly in the AAM during boreal summer by the MME mean (a) Spatial distributions of the temporal correlations between the precipitation anomaly field during summer (JJA) predicted by the MME mean at the 1-month lead and the raw precipitation anomaly references; (b), (c) as in (a), but for the MME predictions at the 4-and 7-month leads, respectively; Values in parentheses are the averages of the temporal correlations in the entire AAM region; The dotted areas are the values with statistically significance at the 5% level |
为了构建S-D预测模型, 需要利用MME平均的回报结果对亚澳季风区夏季降水进行EOF分析, 得到预报的PC时间序列。
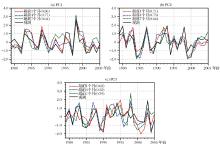
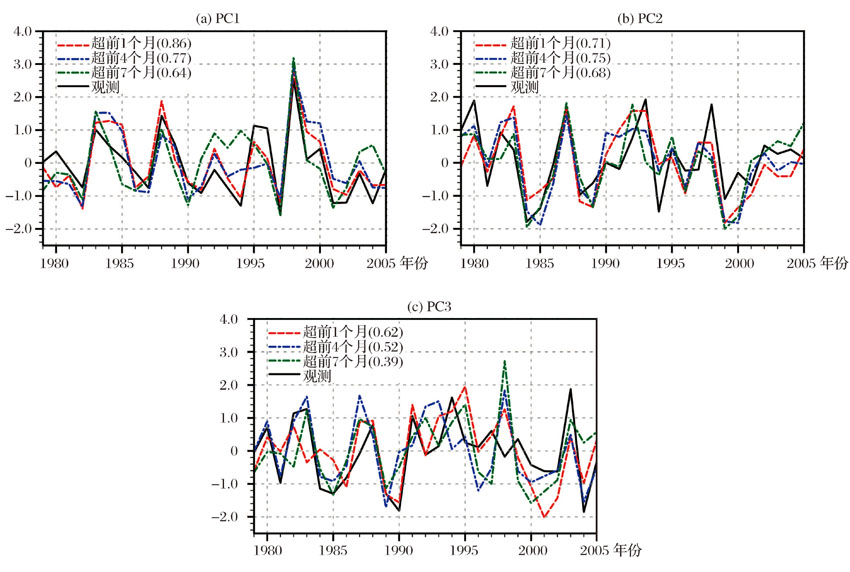
图5显示的是MME平均提前1个月、4个月和7个月回报的PC时间序列。将观测与预测的PC时间序列的相关系数定义为相关系数技巧。对于PC1, 随着起报时间的提前, 相关系数技巧从0.86降低到0.64, 但均高于SP的相关系数技巧(0.60)。对于PC2, 相关系数的变化范围为0.75~0.68, 提前1个月和4个月回报时, 相关系数技巧高于SP的相关系数技巧(0.69), 提前7个月回报时, 相关系数技巧略低于SP的技巧。对于PC3, 相关系数从0.62降低到0.39, 提前1个月回报时, 相关系数技巧高于SP的相关系数技巧(0.57)。总体而言, MME平均提前1个月回报时, 对3个可预报模态PC时间序列的相关系数技巧均优于SP; 提前4个月回报时, 对PC1和PC2时间序列的相关系数技巧优于SP; 提前7个月回报时, 仅对PC1时间序列的相关系数技巧优于SP。
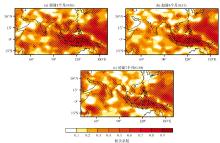
S-D预测模型是将动力模式MME回报的前3个时间序列与原始降水距平场的EOF空间型组合, 重构降水场。这里, 预测技巧定义为重构降水场与原始降水距平场的时间相关系数。S-D模型提前1个月、4个月以及7个月对亚澳夏季风降水的预测技巧的区域平均分别为0.36, 0.31和0.30, 随回报时间的提前而降低(图6)。预测技巧在海洋大陆、西太平洋和菲律宾海相对较高。与DP的技巧相比, S-D模型的预测技巧均有大幅度提高, 并且通过显著性检验的区域扩大, 预测技巧的提高特别体现在副热带区域。技巧提高的主要原因是S-D模型使用的是观测数据中得到的EOF空间型, 在一定程度上克服了模式对降水场的系统性模拟偏差。与SP模型的技巧相比, S-D模型提前1个月回报的预测技巧优于前者(图6a), 提前4~7个月回报的预测技巧与前者相当(图6b, c)。值得注意的是, 纯统计预报只能提前1~3个月, 因此, S-D模型具有显著的优势。但是, 与可能达到的亚澳夏季风降水的预报技巧的上限相比(图3a), S-D模型的预测技巧在副热带仍有很大的提升空间。
 | 图5 MME平均回报的3个主导模态对应的标准化时间序列 (a)黑线为对观测降水距平进行EOF分析得到的标准化的PC1时间序列, 红色、蓝色和绿色虚线分别为MME平均提前1个月、4个月和7个月回报的PC1时间序列; (b), (c)同(a), 但为PC2和PC3; 括号内的值为观测与预测的PC时间序列的相关系数Fig.5 The corresponding PC time series of the three leading modes predicted by the MME mean (a) The black line is the normalized PC1 time series of EOF1 derived from the observational precipitation anomaly; The red, blue and green dashed lines are the PC1 time series predicted by the MME mean at the 1-month, 4-and 7-month leads, respectively; (b), (c) as in (a), but for the PC2 and PC3; Values in parentheses are the temporal correlations between the predicted PC time series and corresponding observational references |
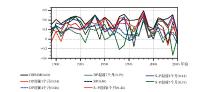
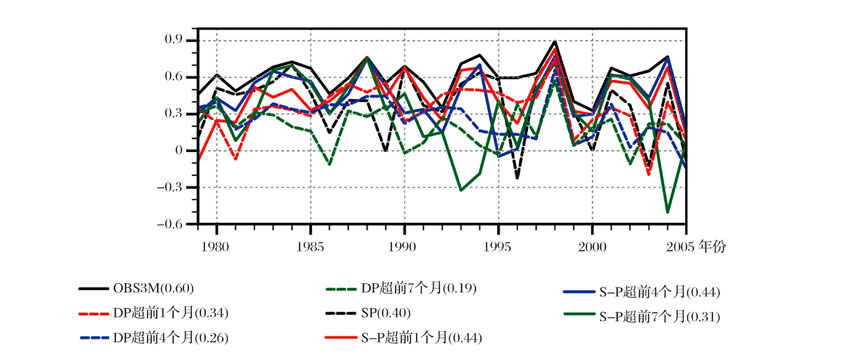
S-D模型对于亚澳季风区降水空间型的预测技巧存在显著的年际变化(图7)。以空间相关系数为评价指标, 提前1个月和4个月回报时, S-D模型在1988年、1994年、1998年和2004年的技巧较高(超过0.6), 而在1979年和1995年的技巧偏低。S-D模型提前1个月和4个月的空间相关系数的时间演变与OBS3M高度一致, 它们的相关系数达到了0.76和0.69, 表明, S-D模型预测技巧的年际变化是PMA方法固有的问题。与SP和DP模型相比, S-D模型的空间相关系数技巧均有显著优势。
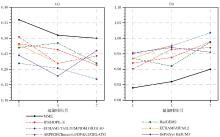
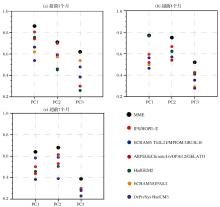
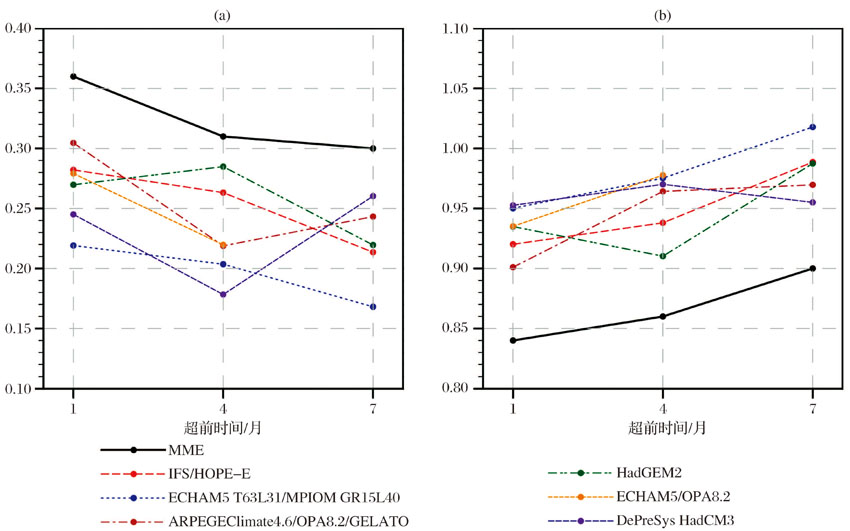
此外, 使用时间相关系数和均方根误差(RMSE)2个指标, 比较分别基于6个单个模式的S-D模型对亚澳夏季风降水区域平均的技巧。综合2个指标, 起报时间提前1个月、4个月和7个月时, 预测技巧最高的模式分别为ARPEGEClimate4.6/OPA8.2/GELATO, HadGEM2和DePreSys HadCM3(图8a, b)。但是, 所有基于单个模式的S-D模型, 对于3个不同起报时间的预测技巧均远低于基于MME平均的S-D模型的技巧, 说明多模式集合技术是提高预测技巧的有效途径。
 | 图6 统计— 动力预测模型对亚澳夏季风降水距平的预测技巧 (a)基于MME平均提前1个月回报的前3个PC时间序列, 再结合观测数据中得到的EOF空间型重构的三维降水距平场, 与原始降水距平场的时间相关系数的空间分布; (b), (c)同(a), 但分别为提前4个月和7个月回报结果; 括号内的值为相关系数在整个亚澳季风区的区域平均; 打点区域表示通过显著性水平为5%的检验Fig.6 The predictive skills of precipitation anomaly in the Asian-Australian monsoon during boreal summer by the statistical-dynamic prediction model (a) Spatial distributions of the temporal correlations between the predicted precipitation anomaly field, which is reconstructed based on the three PC time series predicted by the MME mean at the 1-month lead and the EOF patterns derived from the observation, and the raw anomaly references. (b), (c) as in (a), but for predictions at the 4-and 7-month leads, respectively; Values in parentheses are the averages of the temporal correlations in the entire AAM region. The dotted areas are the values with statistically significance at the 5% level |
起报时间不同时, 各个模式对各个PC时间序列的预报技巧是不同的(图9)。这里的预报技巧指回报与观测的PC时间序列的相关系数。
提前1个月起报时, ARPEGEClimate4.6/OPA8.2/GELATO对PC1和PC2的预报技巧最高, ECHAM5/OPA8.2对PC3的预报技巧最高; 提前4个月起报时, HadGEM2对PC1的预报技巧最高, IFS/HOPE-E对PC2和PC3的预报技巧最高; 提前7个月起报时, DePreSys HadCM3对PC1的预报技巧最高, ARPEGEClimate4.6/OPA8.2/GELATO对PC2的预报技巧最高, IFS/HOPE-E对PC3的预报技巧最高。对于所有3个PC时间序列, MME平均的预报技巧均高于单个模式。
 | 图7 SP模型、DP以及S-D模型对亚澳夏季风降水距平的空间相关系数技巧 黑线实线代表基于EOF分析得到的前3个模态重构的三维降水距平场与观测距平场的空间相关系数技巧, 黑色虚线为SP模型的空间相关系数技巧, 红色、蓝色和绿色虚线分别为DP提前1个月、4个月和7个月的空间相关系数技巧, 红色、蓝色和绿色实线分别为S-D模型提前1个月、4个月和7个月的空间相关系数技巧, 括号内的值为空间相关系数在27年内的平均Fig.7 The Pattern Correlation Coefficient (PCC) skill precipitation anomaly in the AAM during boreal summer by the statistical prediction model, dynamic prediction and statistical-dynamic prediction model The black line is the PCC skill between the reconstructed precipitation anomaly field based on the first three leading EOF modes of the observational precipitation anomaly (OBS3M) and the raw observational anomaly field, and the black dashed line is the PCC skill of the statistical prediction model, and the red, blue and green dashed lines are the PCC skills of the dynamic prediction model at the 1-month, 4-and 7-month leads respectively, and the red, blue and green lines are the PCC skill of the statistical-dynamic prediction model at the 1-month, 4-and 7-month leads, respectively. Values in parentheses are the averaged PCC skill over the 27 years |
 | 图8 基于单个模式及MME平均构建的S-D预测模型重构的降水距平场与原始距平场的时间相关系数和均方根误差在整个亚澳季风区的区域平均 (a)基于单个模式及MME平均分别提前1个月、4个月和7个月回报的前3个PC时间序列, 再结合观测数据中得到的EOF空间型重构的三维降水距平场, 与原始距平降水场的时间相关系数在整个亚澳季风区的区域平均; (b)同(a), 但为均方根误差的区域平均Fig.8 Averages of temporal correlations and Root Mean Square Error (RMSE) between the predicted precipitation anomaly fields constructed by statistical-dynamic prediction models based on individual models and the MME mean and the observational anomaly references in the entire AAM region (a) Averages of temporal correlations between the predicted precipitation anomaly fields and the observational anomaly references in the entire AAM region. The predicted fields are constructed based on the first three EOF patterns derived from the observation and the PC time series predicted by the individual models and the MME mean at the 1-, 4-and 7-month leads, respectively; (b) as in (a), but for the averages of RMSE |
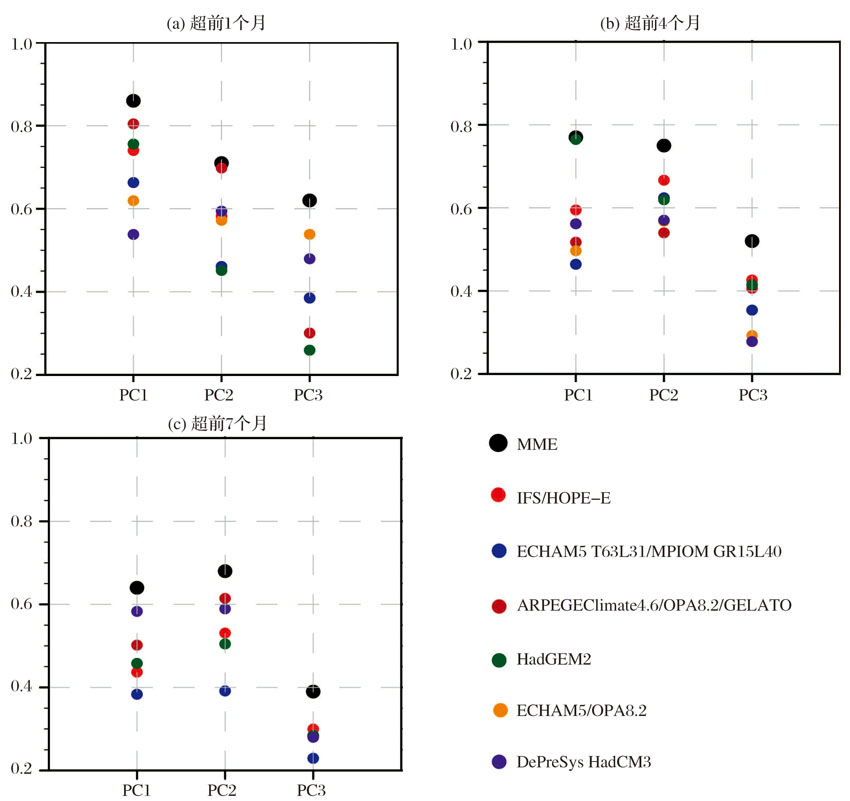 | 图9 单个模式及MME平均对3个主导模态对应的标准化PC时间序列的预测技巧 (a)单个模式及MME平均提前1个月回报的3个主导模态对应的PC时间序列与对应观测的相关系数; (b), (c)同(a), 但分别为提前4个月和7个月回报结果Fig.9 The predictive skills of the corresponding PC time series of the three leading modes predicted by individual models and the MME mean (a) Temporal correlations between the three PC time series predicted by the individual models and the MME mean at the 1-month lead, and the corresponding observational references; (b), (c) as in (a), but for the predictions at the 4-and 7-month leads, respectively |
PMA是结合了经验分析、物理解释和回报试验的气候预测方法[40]。经验分析的目的是找出年际变率的主导模态; 物理解释是建立预测这些主导模态的物理基础; 回报试验则是利用基于物理解释的经验预测方法或者基于动力模式的预测方法进行预测[1]。该方法能够通过经验正交分解的方法, 降低预测对象的维度, 从而提高预测技巧。本文采用此方法, 从观测数据中提取亚澳夏季风降水的可预报模态, 然后利用ENSEMBLES计划提供的多模式、多集合样本的耦合模式季节预测试验结果, 将耦合模式预报的可预报模态的PC时间序列与对应的观测的EOF空间型组合, 重构降水场, 建立了针对亚澳夏季风降水的统计— 动力结合的季节预测系统, 并分析该系统提前1个月、4个月和7个月的回报技巧。此外, 本文还对比了单纯的统计、动力预测对亚澳夏季风降水的预测技巧。主要结论如下:
(1) 观测中亚澳夏季风降水的年际变率的前3个主导模态分别对应于La Niñ a的发展位相、El Niñ o的衰减位相和印度洋偶极子型海温异常。
(2) 基于PMA方法, 分析了亚澳夏季风降水的可预测性。预测和观测场的时间相关系数在目标区域的平均为0.49, PMA方法可能达到的预测技巧的上限较高。其中, 热带地区降水的可预测性最高, 副热带区域的夏季风降水也存在某些可预测性。
(3) SP模型对整个亚澳季风区的预测技巧的区域平均为0.31; DP提前1个月、4个月以及7个月回报的预测技巧的区域平均分别为0.24, 0.18和0.15, 相对较低, 并且预测技巧随回报时间的提前而降低。DP对亚澳夏季风降水的预测技巧低于基于PMA方法的SP模型的预测结果。
(4) 基于PMA方法构建的S-D模型提前1个月、4个月以及7个月的回报技巧在亚澳季风区的区域平均分别为0.36, 0.31和0.30。与DP的技巧相比, S-D模型的预测技巧在整个亚澳夏季风区均有大幅度提高, 通过显著性检验的区域扩大, 预测技巧的提高特别体现在副热带地区。技巧提高的主要原因是S-D模型使用的是观测数据中得到的EOF空间型, 在一定程度上克服了模式对降水场的系统性模拟偏差。与SP模型的技巧相比, S-D模型提前1个月回报的预测技巧优于前者, 提前4~7个月的预测技巧与前者相当。但是, 与PMA方法可能达到的预报技巧的上限相比, S-D模型在副热带区域仍有很大的提升空间。
(5) 无论对于提前1个月、4个月还是7个月回报, MME平均的预测技巧均优于单个模式, 说明多模式能有效提高预报技巧。
本文借助ENSEMBLES计划多模式集合的结果建立了统计— 动力结合的预测模型, 对亚澳夏季风降水开展了回报试验。但是, 值得注意的是, EN-SEMBLES计划只提供回报结果, 并没有提供实时的预报结果。因此, 要开展真实的预报实践, 我们仍然需要建立自主的动力模式预测系统, 来为统计— 动力模型提供实时更新的PC时间序列。目前, 我们已经基于大气物理研究所发展的耦合气候系统模式FGOALS-s2, 初步建立了基于集合最优插值(Ensemble Optimal Interpolation, EnOI)和增量分析升级(Incremental Analysis Update, IAU)方案的海洋初始化系统, 为开展自主的耦合模式季节预测奠定了基础[58]。
The authors have declared that no competing interests exist.
| [1] |
|
| [2] |
|
| [3] |
|
| [4] |
|
| [5] |
|
| [6] |
|
| [7] |
|
| [8] |
|
| [9] |
|
| [10] |
|
| [11] |
|
| [12] |
|
| [13] |
|
| [14] |
|
| [15] |
|
| [16] |
|
| [17] |
|
| [18] |
|
| [19] |
|
| [20] |
|
| [21] |
|
| [22] |
|
| [23] |
|
| [24] |
|
| [25] |
|
| [26] |
|
| [27] |
|
| [28] |
|
| [29] |
|
| [30] |
|
| [31] |
|
| [32] |
|
| [33] |
|
| [34] |
|
| [35] |
|
| [36] |
|
| [37] |
|
| [38] |
|
| [39] |
|
| [40] |
|
| [41] |
|
| [42] |
|
| [43] |
|
| [44] |
|
| [45] |
|
| [46] |
|
| [47] |
|
| [48] |
|
| [49] |
|
| [50] |
|
| [51] |
|
| [52] |
|
| [53] |
|
| [54] |
|
| [55] |
|
| [56] |
|
| [57] |
|
| [58] |
|