

长三角城市群表面城市热岛日内逐时变化规律
[方迎波1  , 占文凤
, 占文凤1, 2, * , 黄帆1 , 高伦1 , 全金玲3 , 邹照旭1 ]
, 占文凤, 黄帆|
|


作者简介:方迎波(1991-),男,河南商丘人,硕士研究生,主要从事城市热岛遥感研究.E-mail:fang.yingbo@foxmail.com
表面城市热岛多时间尺度变化的遥感研究已取得了阶段性进展。然而,受限于热红外遥感模型与数据的不足,目前典型城市群表面城市热岛的日内逐时变化规律仍不清楚。以MODIS (Moderate-resolution Imaging Spectrometer)遥感影像为主要数据源,结合地表温度日内变化INA08模型,率先模拟并分析了长三角城市群在夏、冬两季的表面城市热岛空间格局与热岛强度的逐时变化特征。结果表明:在夏季,日内所有城市整体而言均呈现热岛效应,但由于城市植被或水体的降温作用,白天至上半夜(08:00~21:00)部分城市存在相对“冷点”,而这些“冷点”在21:00之后基本消失。此季节内城市热岛强度与地表温度日内逐时变化规律相似,两者均在上午迅速上升,并于12:00~14:00到达峰值,而后逐渐下降,并持续至次日日出前。在冬季,多数城市在白天出现了“城市冷岛”,但“冷岛”多在午后至傍晚(14:00~17:00)消失,此后所有城市均恢复为“热岛”。此季节内城市热岛强度与地表温度日内逐时变化规律区别较大,且以农田和森林为背景计算的城市热岛强度的逐时变化趋势存在明显差异,前者在日内到达峰值的时间(约18:00)显著晚于后者(约13:30)。
First author:Fang Yingbo (1991-), male, Shangqiu City, Henan Province, Master student. Research areas include remote sensing of urban climate.E-mail:fang.yingbo@foxmail.com
Great progress has been made on the remote investigation of Surface Urban Heat Island (SUHI) across multiple time scales. However, limited by the remote sensing models and resolution tradeoff of satellite-derived Land Surface Temperatures (LSTs), currently the hourly regimes of SUHI over typical urban agglomerations in typical seasons remain unclear. Using MODIS imageries as the main data source as well as by incorporating a diurnal temperature cycle model ( i.e., INA08), this study, to our knowledge, firstly examined the hourly variations of the spatial pattern and intensity of the SUHIs for the Yangtze River Delta urban agglomeration in both the summer and winter. The results demonstrated that, in the summer, a general trend of ‘heat island’ was observed for every city during a diurnal cycle. ‘Cold spots’ also occur within most of the cities from around 08:00 to 21:00, mostly as a result of the cooling effect of urban vegetation or water body under strong solar insolation. However, these ‘cold spots’ disappear after 21:00. For this season, the hourly variations of the SUHI intensity are similar to those of the LSTs: They both rise rapidly in the morning, reach the maxima at around 12:00 to 14:00, then gradually decrease and continue until the sunrise of the next day. In the winter, surface urban cool islands (SUCIs) were observed for most of the cities, but these SUCIs mostly disappear during the afternoon to the early evening (around 14:00~17: 00), and then all the cities bounce back to exhibit heat islands. Within this season, the hourly variations of the SUHI intensity differ from those of the LST. There also exist large differences of the hourly variations of SUHI intensity between using the rural area and forest as the non-urban background for estimation of the intensity, with the former reaching its maximum (around 18:00) significantly later than the latter reaching its maximum (around 13:30).
以城市街谷为代表的城市不透水层能够储存更多热量[1], 再加上建筑、工业与交通所产生的人为热[2]以及地理位置、天气等其他因素影响, 使得城市温度较与其相应的乡村背景温度明显更高的现象, 通常被称为“ 城市热岛效应” [3, 4]。城市热岛效应是城市环境的典型特征[5], 对自然与人居环境造成了深远的影响[6]。城市热岛通常可分为冠层城市热岛(Canopy Urban Heat Island, CUHI)和表面城市热岛(Surface Urban Heat Island, SUHI)[7]。前者主要基于站点观测与模式模拟开展研究, 而后者则有赖于热红外遥感技术(特别是卫星热红外遥感)的出现, 才得以进行充分探索。一般地, 城市热岛(本文后续若不特别指明, 将直接使用“ 城市热岛” 指代“ 表面城市热岛” )的遥感研究可分为以下2类:一是分析城市热岛的时空格局[8~16], 二是评估城市热岛的驱动机制及其影响[17~19]。
在城市热岛时空格局的遥感研究方面, 早期研究多关注城市在单个或者某几个卫星过境时刻(即单个或多个时空断面)的热岛格局。近年来, 随着卫星热红外遥感数据的积累, 城市热岛多时间尺度变化规律研究逐渐兴起。总的来说, 学术界围绕城市热岛的年际变化[20]、年内季节变化[21, 22]与日内变化[23]相关规律的探索已取得了长足进步。然而, 卫星遥感影像的时间与空间分辨率通常难以兼顾[24, 25]。“ 极轨卫星” 地表温度的空间分辨率较高, 但是其时间分辨率较低, 难以服务于城市热岛日内逐时变化研究。与此对应, “ 静止气象卫星” 资料能够较好地应用于日内逐时变化研究, 然而其过粗的空间分辨率难以适应于城市尺度(尤其是中小型城市)。因此, 现阶段多数研究仍主要将日内分成“ 白天” 与“ 夜晚” 2个截然不同的时段, 而针对逐时变化的研究相对较少, 该现状严重阻碍了对城市热岛日内逐时变化规律的深入认识。
尽管如此, 近年来仍有零星文献报道了典型城市热岛的日内逐时变化规律。例如, Zakš ek等[26]将静止气象卫星(Meteosat Second Generation/Spinning Enhanced Visible and Infrared Imager, MSG/SEVIRI, 卫星/传感器)反演的地表温度产品的空间分辨率从3 km降尺度至1 km, 并探索了单个日期(2009年8月12日)内巴黎城市热岛的逐时变化。周纪等[27]结合“ 极轨卫星” (Moderate-resolution Imaging Spectrometer, Terra/MODIS和Aqua/MODIS)与静止气象卫星(FengYun-2C/Stretched Visible and Infrared Spin Scan Radiometer, FY-2C/S-VISSR)热红外数据, 研究了年内4个日期北京城市热岛的逐时变化。Sismanidis等[28]亦通过类似的数据与方法, 分析了雅典夏季城市热岛的逐时变化特征。
尽管城市热岛的逐时变化特征研究取得了突破, 但受限于热红外遥感模型与数据的不足, 仍面临以下挑战:①已有研究多关注特定日期的城市热岛逐时变化规律, 季节性代表有所不足; ②已有研究仅针对某一个特定的城市, 缺乏对城市群热岛日内逐时变化规律的统一认识; ③多数研究需要静止气象卫星等资料, 采用空间降尺度等较为复杂的方法, 影响实际推广与应用。为解决以上问题, 本文以长三角城市群为研究对象, 基于“ 极轨卫星” 数据(MODIS影像), 采用能够描述地表温度日内逐时变化规律的INA08模型[29], 研究夏、冬两季城市群城市热岛的时空格局, 以期获得典型城市群热岛日内逐时变化规律的新认识。
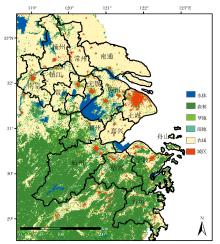
选择长江三角城市群作为研究区(图1), 共包括16个主要城市:上海, 江苏省的南京、苏州、无锡、常州、南通、镇江、扬州与泰州, 浙江省的杭州、绍兴、宁波、嘉兴、湖州、台州与舟山。长三角地区光照充足, 四季分明, 夏季多雨。其海拔较低, 地形以平原为主, 广大平原被开辟为农田、城市, 西南部地区的山地和丘陵上覆盖了大量次生林[20]。长三角城市群是世界第六大城市群, 也是改革开放以来我国城市化最迅速的地区之一。大规模的城市化极大地改变了长三角地区的下垫面, 导致了显著的城市热岛效应, 由此引起的高温热浪等灾害对人居环境与生命财产等造成了严重危害[30]。
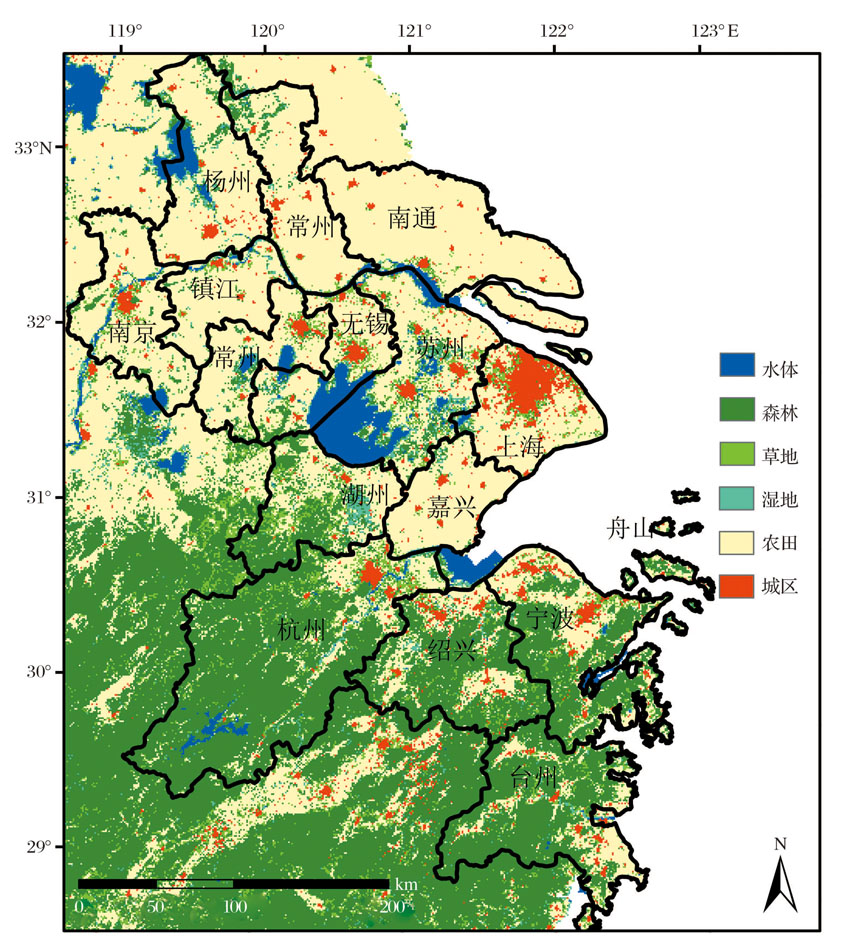 | 图1 长三角地区土地利用/覆盖图Fig.1 Land use/land cover maps over the Yangtze River Delta |
选择2013年夏、冬两季的MODIS地表温度产品(第5版)。其中夏季包含6~8月, 冬季包含12月、1月与2月。地表温度产品的空间分辨率为1 km, 编号为MOD11A1(Terra卫星获取, 过境时刻为当地时间10:30左右与22:30左右)和MYD11A1(Aqua卫星获取, 过境时刻为当地时间13:30左右与01:30左右)。选取的土地利用/覆盖产品为MCD12Q1(2013年第5版)。选用IGBP (International Geosphere-Biosphere Program)全球植被分类方案, 其中“ 常绿针叶林” 、“ 常绿阔叶林” 、“ 落叶针叶林” 、“ 落叶阔叶林” 与“ 混交林” 定义为“ 森林类” , “ 农用地” 、“ 农用地/自然拼接” 为“ 农田类” , “ 城市建成区” 定义为“ 城区类” 。土地利用/覆盖产品的原始空间分辨率为500 m, 经重采样至1 km, 以保证与温度产品的空间分辨率相一致。研究区的MODIS数据行列编号为H27V05, H28V05与H28V06。夏、冬两季共下载地表温度产品2 184景, 土地利用/覆盖产品3景。通过批处理, 对MODIS数据进行重投影、镶嵌、拼接与裁剪, 最后得到研究区图像。
2.3.1 地表温度日内逐时变化模拟
地表温度日变化(Diurnal Temperature Cycle, DTC)模型有望基于MODIS地表温度数据模拟城市热岛日内逐时变化规律[31]。常见的简单DTC模型主要包括GOT01模型(5个参数)[32]、VAN06模型(6个参数)[33]、JNG06模型(6个参数)[34]、INA08模型(5个参数)[29]、GOT09模型(6个参数)[35]以及其他基于地表能量平衡模拟的复杂模型(参数数量较多)[36], 这些模型都具有较高精度[37]。此类模型大多不少于5个参数, 而MODIS地表温度在单日内最多仅有4次观测, 因此上述模型难以直接应用于地表温度日内变化模拟。
本文旨在探讨城市热岛在典型季节(而非单个特定日期)的日内逐时变化规律, 因此就气候学平均的整个季相而言, DTC模型中相邻日间日出时分的地表温度差值(δ T)可近似为零[32]。此时, GOT01与INA08模型所包含的5个控制变量(包含δ T)均将减至4个, 均能满足季相意义下地表温度日内模拟的需求。考虑到“ 双曲线函数” 较之于“ 指数函数” 能够更加精确地描述从下午开始的降温过程[37], 拟定以INA08模型[29]为基础, 模拟地表温度日内逐时变化。该模型通过一个分段函数描述地表温度的日内变化。其中, 日出至下午的某一个时刻的地表温度变化主要由一个谐波函数来表征; 为了描述此后至第二天日出时的地表温度变化, 假定自然地表遵循牛顿冷却定律, 并通过双曲线函数来表征该段时间内地表温度逐渐衰减的过程。若令δ T=0, INA08模型共有4个控制参数T0, Ta, ts和tm, 其表达式如下[29]:
式中:t为时间; T0为日出时分地表温度; Ta为日温度振幅; ω 略大于日余弦周期一半, 由昼长决定; tm为日地表温度达到最大值时刻; ts为日地表温度自由衰减开始时刻; k为日衰减常数, 由日夜谐波函数的微分方程得到(即日夜谐波函数在ts时刻求偏导, 并让其微分方程相等); ϕ 为像元对应的纬度; δ 为太阳赤纬; DOY (Day of Year)为积日。本文基于INA08模型, 并利用某季节内所有的可用数据(即3个月内的所有晴空有效数据), 采用非线性最小二乘法拟合日变化曲线以求解控制参数。根据各参数的物理含义, 进一步设置其约束区间:T0为[250, 350](单位为K); Ta为[0, 50](单位为K); ts距离日落时间较近, 取值区间为[16, 19]; tm一般出现于午后, 取值区间为[11, 15]。另外本研究以整个季相为研究时段, 故DOY定为所对应季节中间的日期(夏季DOY为07月15日, 冬季为01月15日)。
城市热岛具有明显的季节变化特征。夏、冬两季的热岛日变化较春、秋两季更为鲜明[12], 故将注重分析夏、冬两季热岛日内逐时变化特征。但是仍有个别像元在整个季度都缺乏有效数据(被云覆盖), 此时采用5× 5的窗口对值缺失的像元以均值滤波的方式进行插值。
2.3.2 城市热岛强度计算
城市热岛强度通常定义为城市行政区内城区与周边非城市背景区的平均温差, 因此热岛强度值与所选择的背景区域直接相关。考虑到研究区的地表覆盖状况, 将展示以农田为背景时的城市热岛空间格局(2.1节), 同时亦将分别计算以农田和森林为背景的城市热岛强度日内变化(2.2节)。城市热岛强度(I)依照下式进行计算:
I=m-1∑ TU-n-1∑ TB(3)
式中:I为城市热岛强度, m与n分别为城区与背景区像元的个数, TU与TB分别为城市与背景区像元的地表温度值。
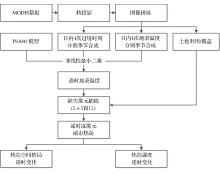
2.3.3 方法流程
综合以上步骤, 本文的技术流程图如图2所示。
 | 图2 技术流程图Fig.2 Flowchart of this study |
受限于论文篇幅, 无法展示日内整个循环周期内逐时(24次)的城市热岛空间格局, 故将主要展示日内6个时刻以农田为背景的城市群热岛空间格局。这6个时刻分别为08:00, 12:00, 16:00, 20:00, 24:00与04:00, 它们代表了白天、夜晚与日夜转换期等日内代表性时刻。
3.1.1 夏季
夏季长三角城市群热岛空间格局的日内变化如图3所示。在热岛强度的空间变化范围(热岛强度的最大、最小值)方面, 由于受到强烈的太阳辐射影响, 白天3个时刻(08:00, 12:00, 16:00)热岛强度在空间上的变化范围较晚上(20:00, 24:00, 04:00)更大(白天3个时刻, 热岛强度的变化范围为-4.0~10.0 K, 而晚上3个时刻的变化范围仅为-2.0~4.0 K)。在热岛整体与局部空间格局的日内逐时变化方面, 在日循环周期内的所有时刻, 城市整体而言均呈热岛效应。在白天与上半夜(08:00~21:00), 总体而言, 不同时刻热岛空间格局在不同城市之间存在较大区别; 从细节上来说, 由于部分城市城区内存在大量公园(以森林与草坪为主)与水体(径流或者小湖), 使得部分城市内部存在相对“ 冷点” (如12:00的南京市与上海市), 且这些“ 冷点” 直接对应于城市植被(森林与草坪)或水体(径流或者湖泊)所处的区域, 这主要因为这些区域的表面温度远低于其周围不透水层的表面温度[5]。入夜后(太阳日落后), 由于乡村背景地区的降温速率远大于城区[1], 城区内部的“ 冷点” 逐渐减弱, 并且于约21:00完全消失, 此后不同时刻的热岛空间格局十分相似。
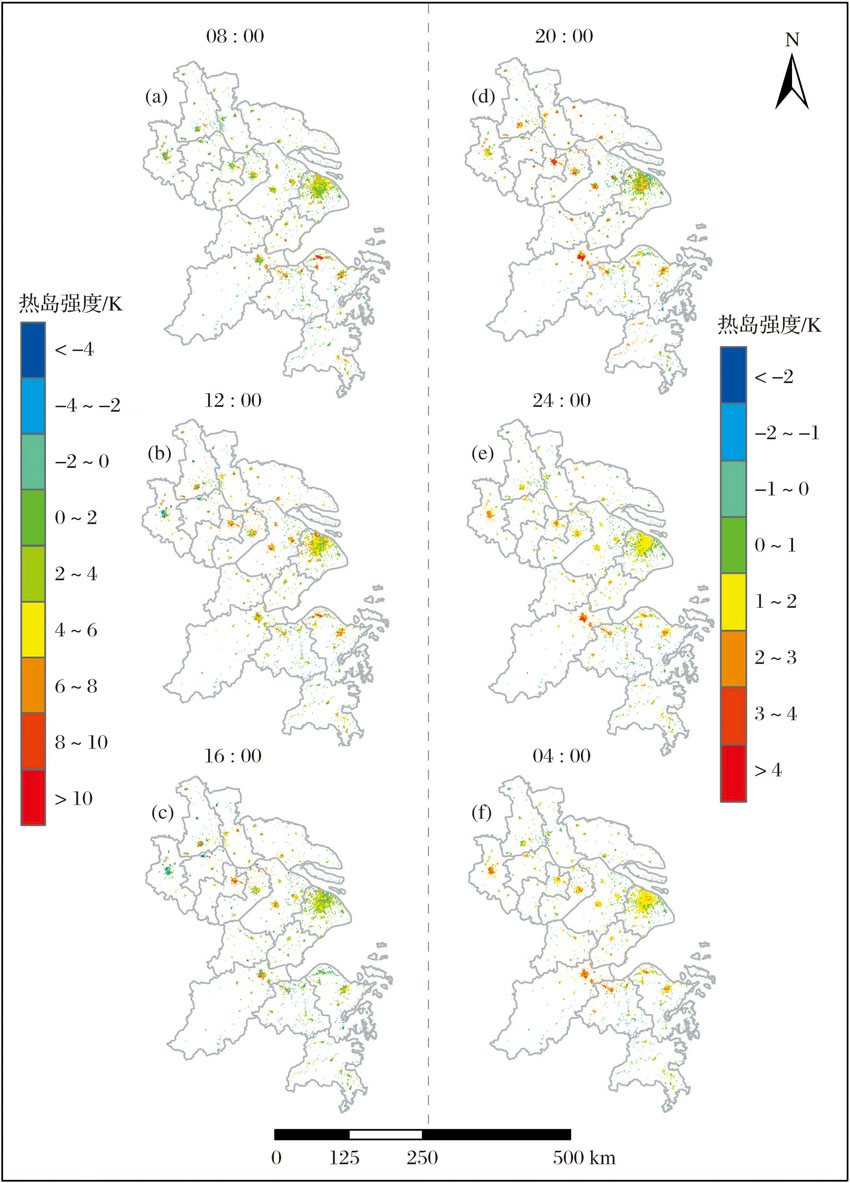 | 图3 夏季长三角城市群日内6个典型时刻热岛强度的空间格局Fig.3 Spatial patterns of the surface urban heat island intensity for the urban agglomeration over the Yangtze River Delta at six typical times of day during the summer |
3.1.2 冬季
冬季长三角城市群热岛空间格局的日内变化如图4所示。冬季, 城市热岛空间格局与夏季存在相似之处, 即白天3个时刻热岛强度在空间上的变化范围大于夜晚。冬季城市热岛格局的日内变化亦与夏季存在较大不同。在热岛强度的变化范围方面, 冬季热岛强度在空间上的变化范围较夏季更小(冬季白天为-2.0~6.0 K, 冬季晚上为0~4.0 K)。在热岛空间格局的逐时变化方面, 多数城市在白天整体性的出现了“ 城市冷岛” 现象(如12:00的南京、无锡、常州与苏州, 16:00的南京、杭州与绍兴等)。这可能是因为在冬季(1月)白天, 此地区的农田背景以裸土为主, 在强烈的太阳辐射的影响下, 裸土的表面温度高于其对应的城市区域(城区内仍存在大量常绿林)。然而, 在午后至傍晚(14:00~17:00), 由于乡村背景地区的降温速率远大于城区, “ 城市冷岛” 现象逐渐消失, 此后所有城市均恢复呈现为“ 城市热岛” 。
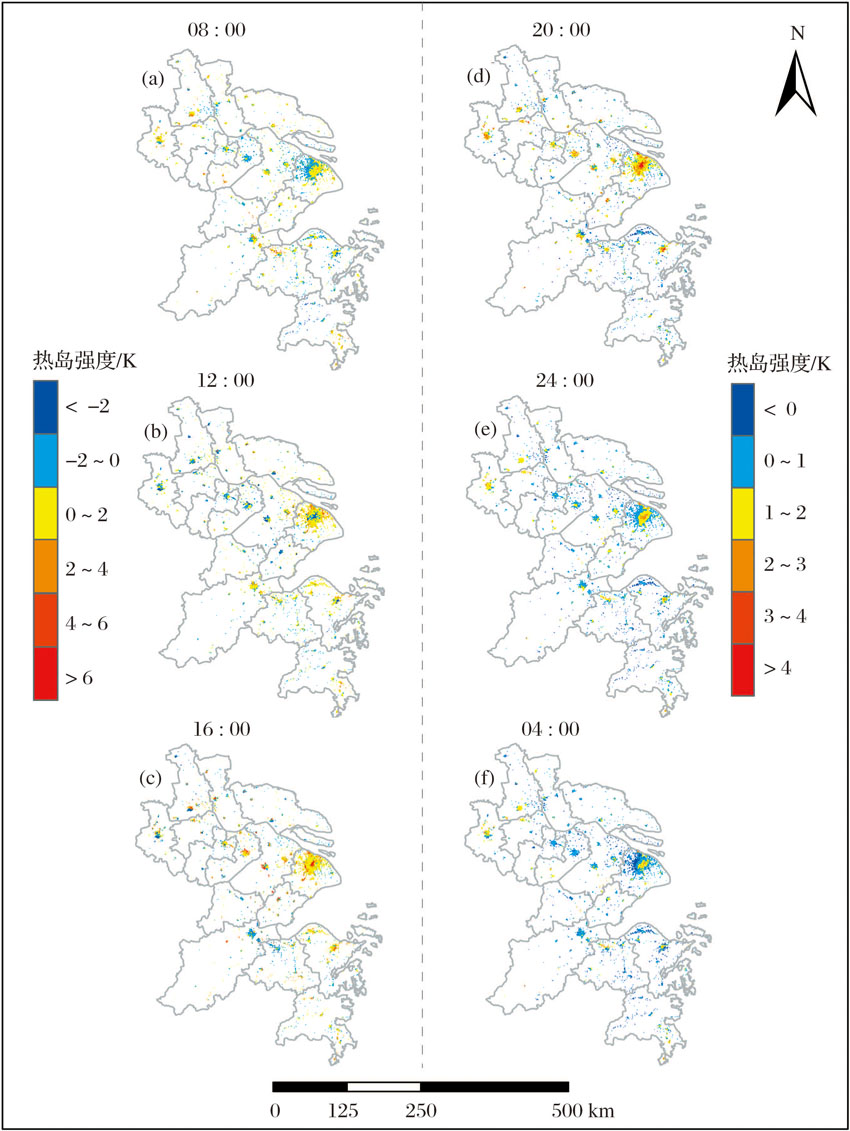 | 图4 冬季长三角城市群日内6个典型时刻热岛强度的空间格局Fig.4 Spatial patterns of the surface urban heat island intensity for the urban agglomeration over the Yangtze River Delta at six typical times of day during the winter |
热岛强度同时受到城市与乡村背景地表覆盖的影响。为了准确地衡量研究区内城市热岛日内逐时变化的总体特征, 将对该地区16个城市的热岛强度的逐时变化进行平均。由于INA08模型难以精确模拟日出前后地表温度的变化[36], 因此下面将主要展示08:00至次日05:00区间内的热岛强度逐时变化。
3.2.1 夏季
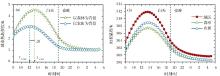
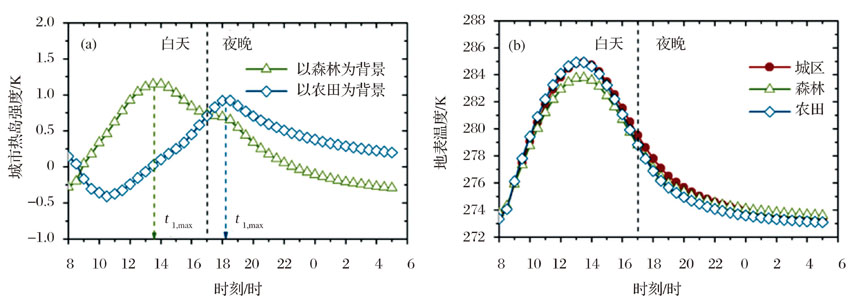
夏季长三角城市群热岛强度的逐时变化规律如图5a所示。热岛强度的逐时变化与城市及乡村背景地表温度的逐时变化直接相关, 因此一并展示了城区、森林与农田地表温度日内逐时变化情况(图5b)。总体而言, 在夏季, 热岛强度与地表温度两者的日内逐时变化规律非常相似。两者均在上午迅速上升, 并于12:00~14:00到达峰值, 此后逐渐下降, 并持续至次日太阳日出之前。就细节而言, 以森林作为背景时热岛强度日内峰值所对应的时间(约13:00)稍晚于以农田为背景时的峰值(约12:00), 且以森林作为背景的热岛强度的日内变幅较以农田为背景时的变幅更大。2种不同背景下的热岛强度在02:00至日出前差异极小, 而两者在日内其他时间则相差较大, 且两者的差异在13:00~14:00达到峰值(约为1.5 K)(图5a)。这表明2种背景下热岛强度的差异与太阳辐射强度的大小直接相关。在夏季白天, 森林的蒸散远大于农田的蒸散, 而更为强烈的地表蒸散通量将使得地表降温作用更为显著[5], 从而致使白天(尤其是正午时分)森林表面温度明显低于农田表面温度(图5b)。
在夏季, 长三角城市群热岛强度的日内变化规律与前人针对北京[27]以及巴黎[26]热岛强度的日内变化规律存在诸多异同点。就北京而言, 其热岛强度在日内的逐时变化特征与本研究所得到的逐时变化特征类似(北京地区白天热岛强度更大); 热岛强度达到峰值的时间亦与长三角地区接近(北京地区热岛强度到达峰值的时间为13:00左右)[27]。其不同点在于, 在21:00至第二天日出之前, 北京地区热岛强度有微弱抬升, 而长三角地区城市热岛强度在此时间段内保持下降的趋势, 此差异可能源自于北京与长三角地区乡村背景农作物类型(体现为土壤含水量)不同所导致的晚间降温速率的不同。就巴黎而言, 其白天热岛强度达到峰值的时间与本文亦基本一致(到达峰值时间为13:30左右)[26]。然而, 巴黎热岛强度在日出后短时间内有所下降, 而本文由于DTC模型在此时间段内精度欠佳[36], 并未提供该段时间范围内的热岛强度变化趋势。此外, 在18:00后巴黎热岛强度持续上升, 到24:00前后热岛强度甚至高于白天热岛强度的最大值; 而长三角地区自傍晚开始热岛强度持续下降。换言之, 在夏季, 长三角地区白天热岛强度总体大于晚上, 而巴黎的热岛强度晚上总体大于白天。这可能是由这2个地区城郊地表覆盖类型差异及其比例不同造成的, 该现象得到了Schwarz等[38]与Wang等[22]的证实。
3.2.2 冬季
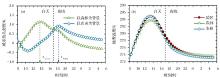
冬季长三角城市群热岛强度的逐时变化规律如图6所示。由于太阳辐射减弱以及植被覆盖度减小, 冬季与夏季热岛强度的日内变化规律存在显著区别。相比之下, 冬季城市热岛逐时变化特征更加不规则(图6a), 且冬季热岛强度更弱, 即城区、森林与农田表面温度逐时变化曲线更趋于吻合(图6b)。总体而言, 该季节内热岛强度与地表温度日内逐时变化规律有较大区别, 且以森林为背景与以农田为背景的热岛强度的逐时变化趋势存在显著差异。08:00~11:00, 以农田为背景的热岛强度迅速下降, 而以森林为背景的热岛强度则持续上升。这是因为, 在冬季农田主要体现为大量的干燥裸土, 日出后, 裸土表面温度短时间内上升较快, 其上升速度甚至超过了城区地表温度的上升速度。此时若以农田为背景, 热岛强度在该时间段内持续为负值, 即呈现了轻微的城市冷岛(热岛强度为-0.4~-0.3 K, 如图5a所示)。此外, 就热岛强度日内变化的相位而言, 由于森林冠层蒸散所导致的表面温度下降程度与太阳辐射强度直接正相关, 以森林为背景时城市热岛到达峰值的时间仍在正午时分(约为13:30)。相比之下, 以农田为背景时城市热岛到达峰值的时间约为18:00, 此时恰为农田(体现为裸土)与城区的降温速率相等(-1.44 K/时)的时刻。在18:00前, 裸土的降温速率大于城区, 此时热岛强度持续增大, 而18:00后裸土的降温速率小于城区, 此时热岛强度将逐渐减小, 故热岛强度对应的峰值恰为18:00前后, 与北京地区冬季相比, 本研究区热岛强度日内逐时变化特征与北京地区类似[27]。然而, 长三角地区热岛强度最小值(-0.41 K)出现在约10:30, 而北京热岛强度的最小值出现在约13:00(均呈现为城市冷岛)。此外, 长三角地区热岛强度的极大值(-0.92 K)出现在日落前后(约18:00), 而北京热岛强度到达极大值的时刻有2个, 一是日落前后(约18:00), 二是日出前后(06:00~07:00), 且后者的值大于前者。其中在日出前后出现极大值的原因主要是本文的结果反映了季节平均意义上热岛的逐时变化特征, 而周纪等[27]主要针对冬季典型日期(单日)的逐时变化规律, 其并未对季相上的数据进行平均。
 | 图5 夏季长三角城市群城市热岛和地表温度的逐时变化规律 (a)为夏季长三角城市群热岛强度的逐时变化规律(分别以农田和以森林为背景); (b)为模型模拟的城区、森林与农田地表温度日内逐时变化情况; t1, max与t2, max分别为以农田或者森林为背景时热岛强度达到峰值所对应的时间Fig.5 Hourly variations of the Surface Urban Heat Islands (SUHIs) and Land Surface Temperatures (LSTs) for the urban agglomeration over the Yangtze River Delta during the summer (a) Hourly SUHI variations using the cropland and forest as the rural background, respectively; (b) Hourly LST variations for the modelled urban, forest, and cropland surfaces; t1, max, t2, max are the times when the SUHI intensity reaches the maximum in a diurnal cycle using the cropland and forest as the rural background, respectively |
 | 图6 冬季长三角城市群城市热岛和地表温度的逐时变化规律 (a)为冬季长三角城市群热岛强度的逐时变化规律(分别以农田和森林为背景); (b)为模型模拟的城区、森林与农田地表温度日内逐时变化情况; t1, max与t2, max分别为以农田或者森林为背景时热岛强度达到峰值所对应的时间Fig.6 Hourly variations of the Surface Urban Heat Islands (SUHIs) and Land Surface Temperatures (LSTs) for the urban agglomeration over the Yangtze River Delta during the winter (a) Hourly SUHI variations using the cropland and forest as the rural background, respectively; (b) Hourly LST variations for the modelled urban, forest, and cropland surfaces; t1, max and t2, max are the times when the SUHI intensity reaches the maximum in a diurnal cycle using the cropland and forest as the rural background, respectively |
3.3.1 表面热岛与冠层热岛日内变化规律的对比
热红外遥感只能直接获得“ 表面” 热岛的时空格局[3], 本文亦主要分析了表面热岛在日内的逐时变化规律。表面热岛与冠层热岛(以城市冠层内气温作为表征)的日内变化规律存在相似性, 即两者的日内变化均可以近似地通过谐波函数来表征[1], 且两者均有显著的季相变化特征。然而, “ 表面温度” 与“ 地表气温” 的驱动机制并不完全相同[39], 2类热岛的日内逐时变化规律亦因此存在差别。在热岛强度日内变化幅度方面, 表面热岛强度在日内的变化幅度通常大于冠层热岛强度[40]。在热岛强度日内总体变化特征方面, 仍以上海市为例, 表面热岛强度日内峰值多出现在白天或者傍晚(夏季到达峰值时间约为12:00, 冬季到达峰值时间约为18:00), 而日内低谷多出现在夜晚(夏季到达低谷时间约为20:00, 冬季到达低谷时间为日出之前)。冠层热岛则与此相反, 由于夜晚大气层结较为稳定, 其强度通常夜晚较强(夏季到达峰值时间约为18:00, 冬季到达峰值时间约为22:00), 白天较弱(夏、冬两季到达低谷时间均约为09:00)[41]。
3.3.2 优势与不足
从理论上来说, 若基于若干城郊站点观测的逐时地表温度, 能够获得更为准确的表面城市热岛日内逐时变化规律。然而, 分布稀疏的若干少数站点通常难以从整体上代表城市复杂的下垫面特征, 故卫星热红外遥感已成为获得城市/城市群表面热岛整体日内逐时分布的有效甚至是唯一手段。
与前人针对表面城市热岛日内逐时变化的研究相比, 本研究还具有如下优势:
(1) 利用了单个季节内所有可用数据, 得到的热岛强度日内变化规律在气候意义上更具典型代表性。
(2) 只需具有较高空间分辨率的“ 极轨卫星” 数据, 能够用于中小型城市的表面城市热岛日内逐时变化规律研究, 同时避免了不同类型地表温度数据之间反演结果差异与空间配准难度较大等问题。
(3) 方法简单有效, 有望用于其他城市(群)热岛日内逐时变化规律探索。
本文亦存在不足:
(1) INA08模型难以精确模拟日出后1~2 h内地表温度变化[36], 因此无法反映该时段内城市热岛的状况。
(2) 卫星热红外遥感仅能在晴空条件下提供有效的地表温度观测值, 故所得到的日内逐时变化规律仅代表晴空条件下的情况。
(3) 长三角城市群不同城市的城市建成区与乡村背景的地表覆盖皆有差异, 本文获得了平均/气候意义下城市热岛的逐时变化规律, 并旨在分析长三角城市群热环境日内逐时变化的整体特征, 这些特征与各城市的热岛逐时变化规律并不完全等同。
典型城市群表面温度热岛日内逐时变化规律的认识尚存在局限, 且缺乏较为简单可靠的研究方法。针对以上不足, 以MODIS遥感影像为主要数据源, 模拟并分析了长三角城市群在夏、冬两季SUHI的空间格局与热岛强度的逐时变化特征。研究表明城市热岛在日内进行状态转换的关键时间节点并非恰好处于白天与夜晚的转换时刻(即日出日落时刻), 且有如下结论:
(1) 在热岛格局逐时变化方面:若以农田为背景, 在夏季, 在日内所有时刻每个城市整体而言均呈现热岛效应, 但由于城市植被或水体的降温作用, 在白天至上半夜(08:00~21:00)部分城市存在相对“ 冷点” , 然而这些“ 冷点” 在21:00之后则基本消失; 在冬季, 多数城市在白天出现了“ 城市冷岛” , 但“ 城市冷岛” 多在午后至傍晚(14:00~17:00)减弱甚至完全消失, 此后所有城市均恢复呈现为“ 城市热岛” 。
(2) 在热岛强度逐时变化方面:在夏季, 城市热岛强度与地表温度均在上午迅速上升, 并于12:00~14:00到达峰值, 随后逐渐下降, 并一直持续至次日日出之前。以农田为背景时城市热岛强度的日内变化范围较以森林为背景时更小, 且前者到达日内峰值所对应的时间稍晚于后者。在冬季, 城市热岛强度与地表温度日内逐时变化规律区别较大, 以农田为背景与以森林为背景的城市热岛强度的逐时变化特征存在显著差异。以农田为背景时, 热岛强度到达峰值的时间(约为18:00)显著晚于以森林为背景时到达峰值时间(约为13:30)。
The authors have declared that no competing interests exist.
| [1] |
|
| [2] |
|
| [3] |
|
| [4] |
|
| [5] |
|
| [6] |
|
| [7] |
|
| [8] |
|
| [9] |
|
| [10] |
|
| [11] |
|
| [12] |
|
| [13] |
|
| [14] |
|
| [15] |
|
| [16] |
|
| [17] |
|
| [18] |
|
| [19] |
|
| [20] |
|
| [21] |
|
| [22] |
|
| [23] |
|
| [24] |
|
| [25] |
|
| [26] |
|
| [27] |
|
| [28] |
|
| [29] |
|
| [30] |
|
| [31] |
|
| [32] |
|
| [33] |
|
| [34] |
|
| [35] |
|
| [36] |
|
| [37] |
|
| [38] |
|
| [39] |
|
| [40] |
|
| [41] |
|