


水泥粉尘对工业区土壤磁学性质影响及其环境意义
[李勇1  , 赵应权
, 赵应权2 , 姚洁1 ]
, 赵应权|
|


为监测水泥粉尘对工业区土壤的影响,在水泥工业区内采集了水泥粉尘、降尘、水泥、粉煤灰、厂内绿地表土及厂周围旱地表土等样品,采用环境磁学方法进行磁学参数测量与矿物成分分析。结果显示所有样品中主要磁性矿物都是磁铁矿,水泥粉尘、水泥厂降尘、水泥、粉煤灰等样品中磁性矿物粒径较粗,主要是准单畴和多畴。被水泥粉尘和降尘污染的厂内绿地表土和厂周围旱地表土的磁学性质发生了明显改变,磁性矿物含量升高,磁性矿物粒径变粗。X射线衍射结果显示,被污染后的厂内绿地表土和厂周围旱地表土中主要矿物成分与水泥粉尘相同,都是石英和方解石。研究发现,土壤的磁学参数( χfd, χARM/χ, χARM/SIRM)值能反映土壤被污染的程度,其值越低,表示土壤被污染越严重。因此,利用水泥工业区旱地表土磁学参数组合特征,可以监测水泥工业区土壤环境变化。
Li Yong(1975-), male, Qidong County, Hu’nan Province, Associate professor. Research areas include environmental magnetism and magnetism.E-mail:liyong197510@163.com
To monitor environmental implications of cement dust on soil in industrial area, magnetic parameters and mineral compositions were measured by the samples of the cement dust, cement factory dustfall, cement, coal ash, topsoil of green space in the factory and topsoil outside the factory. Results showed that the major magnetic minerals in the samples were magnetite, the magnetic mineral particle size of cement dust, dustfall, cement and coal ash was coarse Multi-Domian (MD) and Pseudo-Single-Domain (PSD). As topsoil of green space in the factory and topsoil outside the factory were polluted by cement dust, their magnetic properties had been obviously changed; the concentration of magnetic minerals elevated and particle size became coarser. The magnetic parameters ( χfd, χARM/χ, χARM/SIRM) value can reflect the pollution level of the soil, the lower its value was, the more serious soil was polluted. X-ray diffraction results showed that the mineral compositions of the topsoil of green space in the factory and topsoil outside the factory were quartz and calcite, which were the same as cement dust. Magnetic parameters combination characteristics of topsoil can monitor the soil environmental changes in cement industry area.
Cement dust is referring to dust, which is produced from cement and cement raw material in the process of crushing, drying, grinding, piling, storing, transporting and calcinating. Among these, the dust emissions from grinding and calcinating accounts for more than 70% of the total emissions[1]. The chemical components of cement dust are the same as cement raw material and fuel. For example, the major chemical components of ordinary portland cement dust are SiO2, CaO, Al2O3, Fe2O3, MgO and so on. China is the biggest cement producer in the world, which discharges the largest amount of dust.Annually, according to the statistics, the amount of dust discharging from cement industry in 2013 accounted for 39% of total industrial dust emissions. Cement dust emissions not only have serious impact on environment, but also have an adversely effect on human’ s health. If people inhale this dust for long-term, it will lead to various diseases[2~5]. From the beginning of 20th century, people had realized that cement dust fallen on the surface through atmosphere, came into the soil, and seriously polluted soil environment[6~8], especially, increased the calcium content of soil[9], and changed soil’ s fertility[10]. Studies have shown that industry dust of steel plant and power plant was rich in magnetic minerals. When the dust fallen into soil outside the industrial area, which had a significant effect on the magnetic properties of the soil through increasing the Magnetic Susceptibility (MS). At the same time, it also enhanced the heavy metal content in the soil. It is reported that the MS and heavy metal concentration were in the polluted soil show some positive relationships[11, 12]. In recent years, the domestic and foreign scholars used this relationship to investigate the soil pollution, and gained great achievement[11~13]. With the characteristics of sensitivity, rapidness and cheapness, environmental magnetism analysis become one of effective methods to study the soil pollution in industrial area[14]. However, the reports of using magnetic method to study the soil polluted by cement dust were very rare. Previous studies found that cement factory dustfall had magnetic effect on topsoil of soil profile in industrial area[15]. In this study, we conduct environmental magnetism research on the samples of cement dust, cement factory dustfall, cement, coal ash, topsoil of green space in the factory and topsoil outside the factory in cement industrial area in Fengyang County of Anhui Province, China. The main objectives are to study the magnetic characteristics and mineral compositions of soil possibly polluted by cement dust, which will provide the theoretical basis and technical support for environmental protection departments to fast monitor, evaluate and improve soil environment in cement industry area.
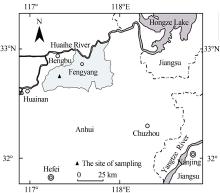
In this paper, taking the cement industry area as the study area, which is located in the west of Fengyang County (Fig.1). There are two big cement factories in this area, which were built in early 1990s and mainly produce ordinary portland cement with ~4 million tons annual outputs. The major raw materials were limestone, clay (mixed with quartz tail-sands), coal ash, and so on. In this study, the samples were collected from cement industrial area, including cement dust samples (n=13) from the raw materials grinding and calcinating workshops, 0~10 cm topsoil samples (n=15) from outside the cement factory in the range of 2 km distance from the factory walls, cement factory dustfall samples (n=12, once a month in 2013), topsoil samples (n=15) from green space in the cement factory, coal ash samples (n=12), and cement samples (n=12). To reduce the random of single sampling, 5 topsoil samples were collected in the range of 4~5 square meters, and then mixed uniformly into one sample. All samples were put into plastic sealed bags and were placed into 40 ℃ constant temperature box for drying, and then all dry samples were loaded into standard 8 cm3 nonmagnetic plastic cubic boxes. Soil samples were mashed and passed through a 0.25 mm sieve to remove refuse and large particles.
 | Fig.1 Distribution map of sampling locations |
A series of experiment measurements were conducted to samples, including: ①A MFK1-FAKappabridge was used to measure sample’ s low-field susceptibility at 0.47 and 4.7 kHz frequencies. The value was expressed as volume susceptibility (κ ), low frequency susceptibility (χ L) and high frequency susceptibility (χ H) respectively. Frequency- dependent susceptibility (χ fd) was calculated by the formula χ fd=(χ L-χ H)/χ L× 100%. ②Anhysteretic remanent magnetization (ARM) was acquired by applying a peak alternating field (AF) of 100 mT and the direct current (DC) field of 0.05 mT on the D-2000 alternating demagnetization instruments. The ARM was measured by the JR-6A spinner magnetometer. ③Isothermal remanent magnetization (IRM) was obtained by IM10-30 impulse magnetizing apparatus. The IRM acquired in a field of 300 mT was expressed as IRM300mT, and in a peak field of 1 T was regarded as saturation IRM (SIRM). The IRM was measured on the JR-6A spinner magnetometer. Coefficient of magnetization (S300) was calculated from the formula S300=IRM300mT/SIRM. In addition, the IRM acquisition curves and anti-field demagnetization curves were measured by representative samples.④Temperature-dependent susceptibility (κ -T) of low-magnetic field in an argon atmosphere was conducted using a KLY-4S Kappabridge with a high-temperature apparatus (CS-3). Sample’ s mass susceptibility (χ ), saturation isothermal remanent magnetization (SIRM) and anhysteretic remanent susceptibility (χ ARM) were calibrated by sample mass.
Magnetic mineral compositions of representative samples were investigated by a D8 ADVANCE X-ray Diffractometer (XRD) and a ZEISS EVO18 Scanning Electron Microscopy (SEM) and energy dispersive X-ray spectra(EDX). All magnetic measurements, the XRD experiment and the SEM experiment were performed in the Paleomagnetism and Environmental Magnetism Laboratory of China University of Geosciences (Beijing), Bengbu Design and Research Institute for Glass Industry, Testing and Analysis Center of Anhui Science and Technology University.
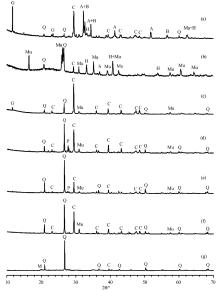
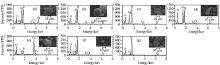
X-ray patterns and SEM/EDX photos of representative samples of cement dust, cement factory dustfall, cement, coal ash, topsoil of green space in the factory and topsoil outside the factory were shown in fig.2 and fig.3. According to the combination of minerals, all samples can be divided into 3 categories: The first category was the cement samples, and its main mineral compositions were tricalcium silicate, dicalcium silicate, calcite, quartz, gypsum, and a few magnetite and hematite; The second category was the coal ash sample, and its main mineral compositions were mullite, quartz, magnetite, hematite, and a few sillimanite and calcite; The third category was the samples of cement dust, cement factory dustfall, topsoil of green space in the factory and topsoil outside the factory, and their main mineral compositions were quartz, calcite, and a few mullite. In addition, topsoil of green space in the factory had a few gypsum, and cement dust and topsoil outside the factory had a few plagioclase. The XRD pattern of cement factory dustfall, topsoil of green space in the factory and topsoil outside the factory was same as cement dust (Fig.2c~f), which would suggest that these three kinds of samples had been polluted by cement dust. The XRD pattern of soil sample of 68 cm under the ground showed that the main mineral composition was quartz (Fig.2g) with very few calcite, but the calcite content was high in topsoil samples possibly polluted by cement dust. The SEM/EDX photos showed that coal ash particles were spherical with smooth surface, and the content of Si, Al and Fe elements was relatively high (Fig.3b). Other sample particles were massive with many small particles adsorbed on the surface of large particles. The content of Ca, Al in topsoil of green space in the factory and topsoil outside the factory was high; however, the soil sample of 68 cm under the ground was low.
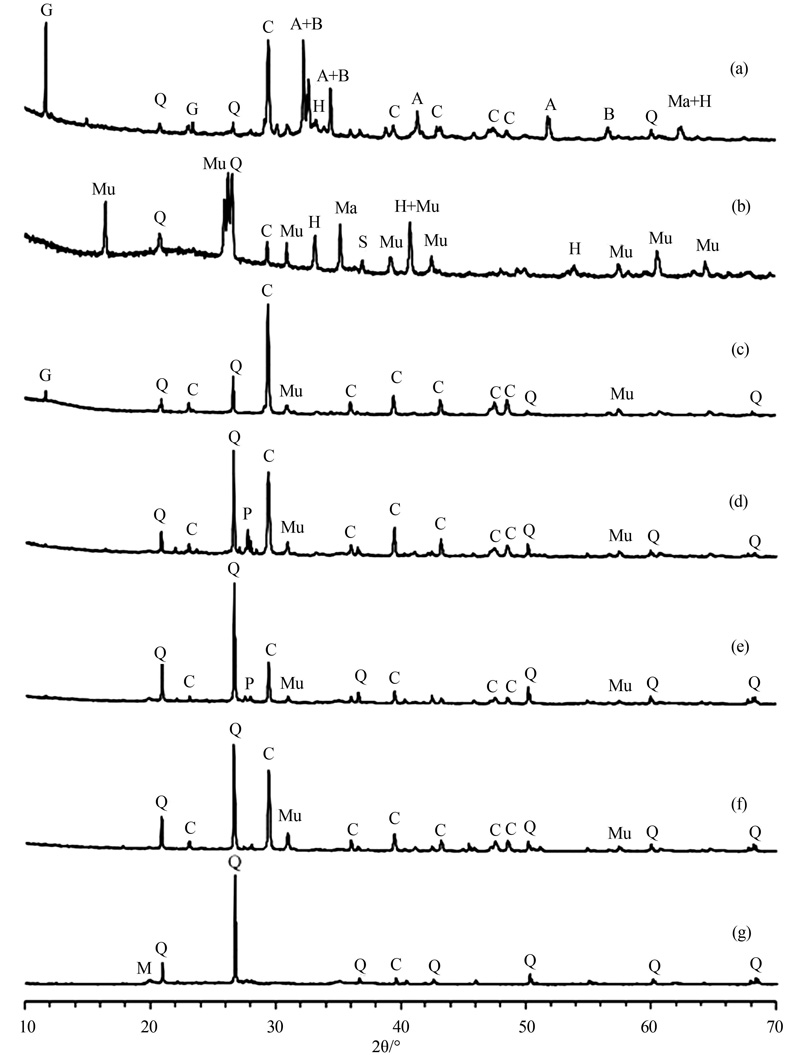 | Fig.2 X-ray diffraction (XRD) pattern of representative samples (a) cement, (b) coal ash, (c) topsoil of green space in the factory, (d) cement dust, (e) topsoil outside the factory, (f) cement factory dustfall, and (g) soil of 68 cm under the ground Identified peaks are labeled for mullite (Mu), quartz (Q), gypsum (G), calcite (C), sillimanite (S), plagioclase (P), hematite (H), magnetite (Ma), dicalcium silicate (A), tricalcium silicate (B), and Montmorillonit (M) |
 | Fig.3 SEM image and energy dispersive X-ray spectra (EDX) for representative samples (a) Cement, (b) Coal ash, (c) Cement factory dustfall, (d) Topsoil of green space in the factory, (e) Topsoil outside the factory, (f) Cement dust, (g) Soil sample of 68cm under the ground |
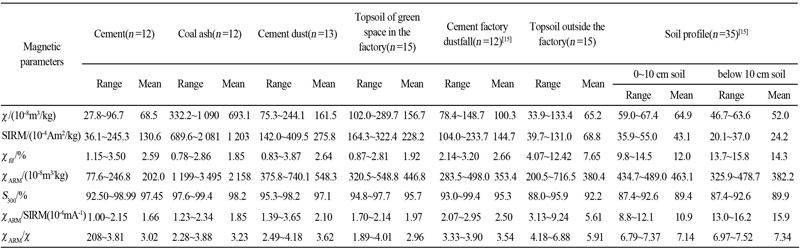
Magnetic parameters can reflect composition, concentration and grain size of magnetic minerals[16]. χ and SIRM were mainly correlated with composition and concentration of magnetic mineral in sample. χ fd can reveal magnetic mineral concentration of Super-Paramagnetic (SP) particles. χ ARM can reflect ferromagnetic mineral concentration of fine Single-Domain (SD) particles[17]. χ ARM/χ , χ ARM/SIRM can reflect the relative change of magnetic mineral grain size[18]. S300 and Bcr indicated the relative proportion of antiferromagnetic minerals and ferromagnetic minerals.
The magnetic parameters of cement dust, cement factory dust fall, cement, coal ash, topsoil of green space in the factory and topsoil outside the factory were summarized in Table 1 and Fig.4. The χ and SIRM average values of coal ash (693.1× 10⁻⁸m3/kg and 1 203× 10-4Am2/kg) were the highest (Fig.4a, b, Table 1), and the average values of the cement dust (161.5× 10⁻⁸m3/kg and 275.8× 10⁻⁴Am2/kg), topsoil of green space in the factory (156.7× 10⁻⁸m3/kg and 228.2× 10⁻⁴Am2/kg), cement factory dustfall (100.3× 10⁻⁸m3/kg and 144.7× 10⁻⁴Am2/kg), cement (68.5× 10⁻⁸m3/kg and 130.6× 10⁻⁴Am2/kg) and topsoil outside the factory (65.2× 10⁻⁸m3/kg and 68.6× 10⁻⁴Am2/kg) decreased orderly, which indicated that the content of magnetic minerals in coal ash was the highest, and the lowest in the topsoil outside the factory. The χ ARM value of coal ash was also higher than other samples (Fig.4c, Table 1), which showed that the concentration of ferromagnetic minerals in coal ash was higher than other samples. The data displayed that χ fd, χ ARM/χ and χ ARM/SIRM values of topsoil outside the factory with average values of 7.65%, 5.61× 10⁻⁴ mA-1 and 5.91, were significantly higher than other samples (Fig.4e, f, g, Table 1).It suggested that there were a number of SP and SD particles in topsoil outside the factory[18]. The χ fd, χ ARM/SIRM and χ ARM/χ average values of cement dust, cement, coal ash, topsoil of green space in the factory and cement factory dustfall were similar and less than 3.00%, 3.00× 10⁻⁴ mA-1 and 4.00× 10⁻⁴ mA-1, respectively, which indicated that magnetic mineral grain size of these 5 kinds of samples was Pseudo-Single-Domain (PSD) and Multi-Domain (MD)[18].
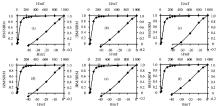
The S300 average value of all samples was larger than 90% (Fig.4d, Table 1). IRM acquisition curves and anti-field demagnetization curves showed that the IRM increases rapidly and reach 95% SIRM below the magnetic field of 300 mT (Fig.5), and the maximum Bcr value of all samples was 37.5 mT (cement factory dustfall). These results indicated that the magnetic properties of 6 kinds of samples were dominated by low coercivity ferromagnetic minerals.
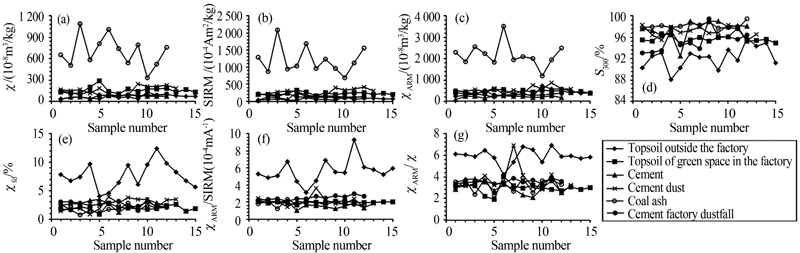 | Fig.4 Comparison of magnetic parameters for all types samples |
The κ -T curve was used to detect magnetic mineral compositions in samples[19, 20]. The κ -T curves were measured by 6 kinds of representative samples (Fig.6), and the results showed that all κ -T curves can be divided into 3 types. The first type was topsoil outside the factory (Fig.6a): The magnetic susceptibility value of cooling curve was far higher than that of the heat-ing curve, which suggested a large number of strong magnetic minerals were produced during the heating process[21]. The second type was coal ash (Fig.6d): The cooling curve was very close to the heating curve, which indicated that the magnetic minerals in sample had not changed in the heating process, because the mineral compositions of coal ash had good thermal stability after high temperature combusting. The third type was cement, topsoil of green space in the factory, cement dust and cement factory dustfall (Fig.6b, c, e, f): The cooling curves were higher than the heating curves, and the κ -T curves shape were basically same, which indicated that a few new strong magnetic minerals were produced during the heating process. The magnetic susceptibility of all samples dropped sharply and reached zero when they were heated to 585 ℃ of the curie temperature of magnetite. The cooling curves of all samples were similar with that of the magnetite. The κ -T curve experiments indicated that the major magnetic mineral in samples was magnetite, and the magnetic susceptibility was dominated by the concentration of the magnetite.
| Table 1 Statistical result of magnetic parameters for all samples |
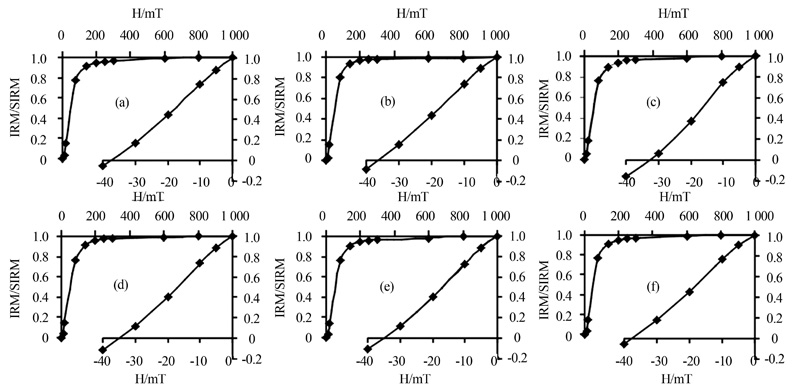 | Fig.5 7IRM acquisition curves and DC demagnetization curves for representative samples (a)cement, (b)coal ash, (c)topsoil outside the factory, (d)cement dust, (e)topsoil of green space in the factory and (f)cement factory dustfall |
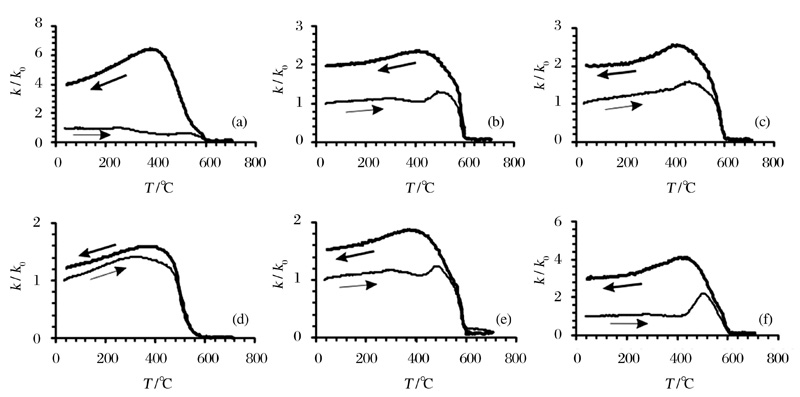 | Fig.6 κ -T curves for representative samples (a)Topsoil outside the factory, (b)Topsoil of green space in the factory, (c)cement, (d)coal ash, (e)cement dust and (f)cement factory dustfall |
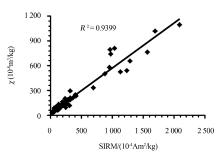
 | Fig.7 SIRM-χ scatter plot for samples |
Cementdust was mainly produced in the process of raw material’ s grinding and calcinating, and its major mineral compositions were quartz and calcite (Fig.2d). The XRD (Fig.2) and EDX (Fig.3) measurement results of representative samples showed that the diffraction peaks of cement factory dustfall and cement dust were the same (Fig.2d, f). Due to the implications of cement dust, the major mineral compositions of topsoil of green space in the factory and topsoil outside the factory were quartz and calcite (Fig.2c, e).
The χ -SIRM scatter plot is helpful to investigate the magnetic mineral compositions in the samples[22]. The analysis results showed that χ and SIRM of cement dust, cement factory dustfall, cement, coal ash, topsoil of green space in the factory and topsoil outside the factory had significant positive correlation (R2=0.9399) (Fig.7), which indicated that the magnetic properties of all samples were dominated by a type of magnetic mineral. Combined with the XRD patterns of representative samples (Fig.2) and measuring results of S300, Bcr and κ -T curves, we can confirm that the major magnetic mineral in samples was low coercivity magnetite that dominated the magnetic properties of samples.
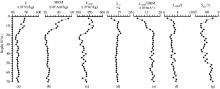
In order to further study the magnetic change of soil possibly polluted by cement dust, this paper compared magnetic parameters of soil profile and cement dust, cement factory dustfall, cement, coal ash, topsoil of green space in the factory, topsoil outside the factory with those of a soil profile which located in cement industrial area and polluted by cement factory dustfall[15]. The magnetic parameters of the soil profile were shown in Fig.8. The magnetic properties of soil profile below 20 cm showed relative low concentration of magnetic minerals with fine grain size, which may be controlled by soil parent material. The results also showed that magnetic mineral concentration of 0~10 cm soil samples was higher and grain size was coarser than those of the lower soil samples, which may indicate the magnetic properties of topsoil had been changed (Fig.8, Table 1) and 0~10 cm soil was possibly polluted by cement factory dustfall.
In the dearing diagram[23] (Fig.9), the distribution position of different types of samples had great difference. The samples of cement dust, cement factory dustfall, cement, coal ash and topsoil of green space in the factory were mostly distributed in the boundary of MD+PSD region and coarse SSD region, which indicated that the particle size was relative coarse. The samples of topsoil outside the factory were distributed in coarser SSD region and the content of SP particles was high. Most samples of 0~10 cm soil on the profile were distributed in fine SSD region, and the content of SP particles was high. The samples of soil profile below 10 cm were concentrated in the transition region of SSD to SP, the content of SP particles was the highest, particle size was the finest, its χ fd average value was 14.3%, which indicated that the magnetic minerals were created in the soil forming process[24], and these samples were not affected by industrial pollution. Due to the influences of cement dust, the particle size in topsoil outside the factory and 0~10 cm soil on the profile became coarser, the distribution range in the Dearing diagram was wide. Because topsoil of green space in the factory was seriously polluted by cement dust, its particle size characteristics was same as the cement dust, its distribution position was basic overlapped with cement dust, cement factory dustfall, cement and coal ash in the Dearing diagram.
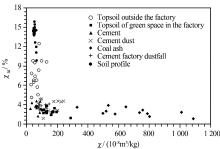
Previous studies results indicate that the magnetic properties of samples werecontrolled by magnetite, therefore the χ -χ fd scatter plots can be used to analyze relationship between the magnetic mineral concentration and grain size. The distribution of all kinds of samples had significant differences in the χ -χ fd scatter plots (Fig.10). The samples of cement dust, cement factory dustfall, cement, coal ash and topsoil of green space in the factory were mostly distributed near the horizontal axis (χ axis) position with high χ values and less than 3% χ fd average values (Fig.10, Table 1). It showed that the grain size of magnetite was coarser. Dearing analysis plots (Fig.9) showed that the magnetic minerals in these 5 kinds of samples were mainly MD and PSD particles, which was the typical magnetic characteristics of industrial dust and soil polluted by industrial dust[6, 25~29]. The samples of soil profile below 10 cm were mostly distributed near the longitudinal axis (χ fd axis) position. Compared with above 5 kinds of samples, their χ values were low for higher χ fd average values of 14.3%, which showed the typical magnetic characteristic of natural soil. However, topsoil outside the factory and 0~10 cm soil on the profile may be polluted by cement dust, because the magnetic properties of these samples were mainly distributed between those of soil profile below 10 cm and cement dust, cement factory dustfall, cement, coal ash and topsoil of green space in the factory in the χ -χ fd scatter plots (Fig.10). The magnetic parameters (χ and SIRM) which express the concentration of magnetic mineral in soil show fewer changes than magnetic parameters (χ fd, χ ARM/χ and χ ARM/SIRM) which express the grain size (Fig.10, Table 1). Therefore, the magnetic parameters (χ fd, χ ARM/χ , χ ARM/SIRM) values can reflect the soil pollution level, i.e., the lower χ fd, χ ARM/χ and χ ARM/SIRM value was, the more serious soil was polluted. The measurement results showed that the magnetic parameters (χ fd, χ ARM/χ and χ ARM/SIRM) average values of the 0~10 cm soil on the profile, topsoil outside the factory and topsoil of green space in the factory decreased in turn (Table 1), which may indicate that the pollution levels of the 3 kinds of soil increased orderly.
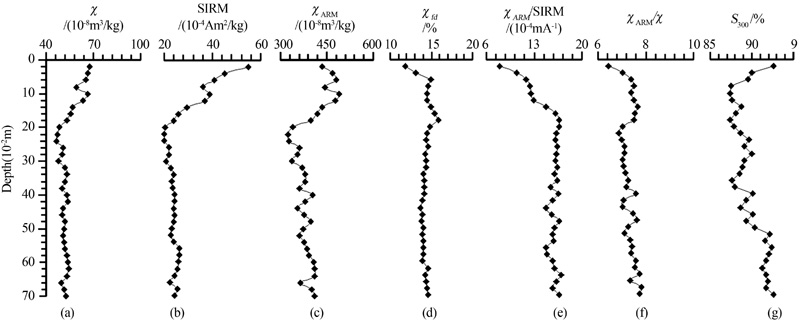 | Fig.8 The variation of magnetic parameters of soil profile with sampling depth[15] |
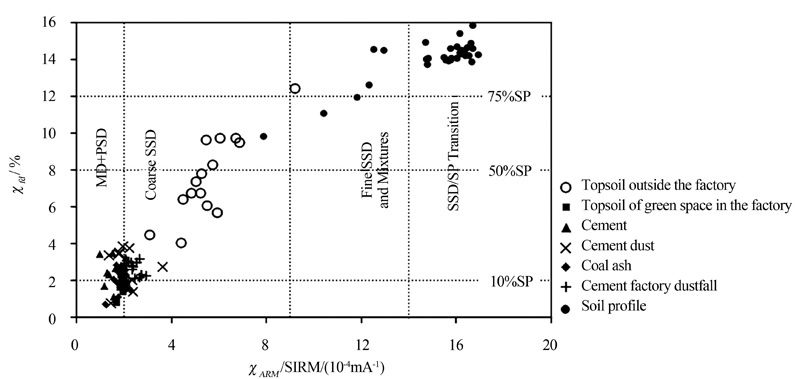 | Fig.9 Dearing analysis plots |
 | Fig.10 χ -χ fd scatter plots for samples |
Sources of magnetic minerals in soil had two aspects: Natural source and human activities[30, 31]. Natural source of magnetic minerals in soil refers to primary or secondary ferromagnetic minerals and anti-ferromagnetic minerals, and its content was related with soil parent material. Studies had showed that there was a significant positive correlation on magnetic susceptibility between soil and parent rocks[32, 33]. Soil-forming, eroding, weathering, carrying and other geological processes were important factors to influence the magnetic mineral type and content of soil. Human activities such as industrial production, fossil fuels burning and motor vehicle exhausting and so on, which can produce dust and fly ash that contained a large number of magnetic particles[34, 35]. When the dust and fly ash fall into the soil, they would change the original magnetic characteristics of soil. Previous studies showed when topsoil outside the power plant and steel plant was polluted by factory dust and dustfall, their magnetic mineral concentration was elevated and its particle size became coarser (coarse PSD and MD particles)[6, 25, 29, 36, 37]. The ferromagnetic mineral concentration of natural soil was generally lower than the dust, and its grain sizes were fine and the content of SP and SD particles was high. Cement production consume a large amount of coal and produce a great deal of soot. Moreover, the cement factory discharged much more dust into atmosphere, these soot and dust that contain magnetic particles drop into the industry area soil and will change the magnetic characteristics of topsoil outside the factory and topsoil of green space in the factory through elevating magnetic mineral concentration and coarsing grain size (Fig.4, Table 1).
There are two possible reasons that may increase the magnetic mineral concentration in topsoil of cement industry area. One is possibly polluted by the cement dust, and another is related to the pedogenesis. However, the topsoils will show different the magnetic properties. Pedogenesis can increase the magnetic mineral concentration in soil and decrease the grain size[38, 39].If the magnetism enhancement of soil is polluted by the industrial dust, its magnetic characteristics will show that the magnetic mineral concentration is increasing, and the extent of increment was significantly larger than that of pedogenesis.Compared with soil profile below 10 cm, the magnetic mineral concentration in topsoil outside the factory and topsoil of green space in the factory was higher, and the grain size became coarser (Fig.9 and Fig.10).In addition, the major mineral compositions in 2 kinds of topsoil were quartz and calcite, the same as cement dust (Fig.2c, e), but that was different with soil of 68cm under the ground (Fig.2g), which showed that the main cause of increased magnetic mineral concentration of topsoil was the pollution of cement dust. Using the magnetic parameters combination characteristics of topsoil can fast assess the contamination degree of soil, and monitor the change of soil environment in cement industrial area.
After the topsoil of green space in the factory and topsoil outside the factory were polluted by the cement dust, their magnetic properties had been obviously changed, i.e., the elevated concentration and the coarser grain size of magnetic minerals. In this study, we found that the topsoil of green space in the factory had been seriously polluted by the cement dust. Magnetic parameters (χ fd, χ ARM/χ and χ ARM/SIRM) value of soil in cement industry area can reflect the pollution degree of the soil: The lower its value was, the more serious soil was polluted. The mineral compositions of topsoil of green space in the factory and topsoil outside the factory were quartz and calcite, which was the same as cement dust. The magnetic parameters combination characteristics of topsoil in cement industrial area can monitor the change of soil environment.
The authors have declared that no competing interests exist.
| [1] |
|
| [2] |
|
| [3] |
|
| [4] |
|
| [5] |
|
| [6] |
|
| [7] |
|
| [8] |
|
| [9] |
|
| [10] |
|
| [11] |
|
| [12] |
|
| [13] |
|
| [14] |
|
| [15] |
|
| [16] |
|
| [17] |
|
| [18] |
|
| [19] |
|
| [20] |
|
| [21] |
|
| [22] |
|
| [23] |
|
| [24] |
|
| [25] |
|
| [26] |
|
| [27] |
|
| [28] |
|
| [29] |
|
| [30] |
|
| [31] |
|
| [32] |
|
| [33] |
|
| [34] |
|
| [35] |
|
| [36] |
|
| [37] |
|
| [38] |
|
| [39] |
|