中国Argo海洋观测十五年
刘增宏1, 吴晓芬1, 许建平1*,*, 李宏2, 卢少磊1, 孙朝辉1, 曹敏杰1
1.卫星海洋环境动力学国家重点实验室,国家海洋局第二海洋研究所,浙江 杭州 310012
2.浙江省水利河口研究院,浙江 杭州 310020
*通信作者:许建平(1956-),男,江苏常熟人,研究员,主要从事物理海洋学调查研究.E-mail:sioxjp@139.com

作者简介:刘增宏(1977-),男,江苏无锡人,副研究员,主要从事物理海洋学调查研究.E-mail:liuzenghong@139.com

摘要

中国Argo计划组织实施15年以来,在太平洋和印度洋等海域布放了350多个剖面浮标,建成了我国Argo大洋观测网,并建立了针对Argo剖面浮标的资料接收、处理和分发系统,利用Argo资料开发了多个数据产品,在一定程度上推动了国内海洋数据的共享进程。海量的Argo资料已成为我国海洋和大气科学领域基础研究及业务化应用的主要数据源,特别是在热带气旋(台风)、海洋环流、中尺度涡、湍流、海水热盐储量与输送、大洋水团以及海洋、天气/气候业务化预测预报等方面取得了一批重要的研究和应用成果。随着国际Argo计划由“核心Argo”向“全球Argo”拓展,我国Argo大洋观测网的长期维护和持续发展面临巨大挑战,应紧紧抓住这一难得的机遇,利用国产北斗剖面浮标在南海及邻近我国的西北太平洋和印度洋海域建成Argo区域海洋观测网,为应对全球气候变化及防御自然灾害,更多地承担一个海洋大国的责任和义务。

关键词: Argo计划; Argo大洋观测网; Argo资料; 基础研究; 业务化应用
中图分类号:P71 文献标志码:A 文章编号:1001-8166(2016)05-0445-16
Fifteen Years of Ocean Observations with China Argo
Liu Zenghong1, Wu Xiaofen1, Xu Jianping1,*, Li Hong2, Lu Shaolei1, Sun Chaohui1, Cao Minjie1
1.State Key Laboratory of Satellite Ocean Environment Dynamics, Second Institute of Oceanography, State Oceanic Administration, Hangzhou 310012, China
2.Zhejiang Institute of Hydraulics and Estuary, Hangzhou 310020, China

First author:Liu Zenghong(1977-), male, Wuxi City, Jiangsu Province, Associate Professor. Research areas include physical oceanographic investigation and research.E-mail:liuzenghong@139.com

Corresponding author:Xu Jianping(1956-), male, Changshu City, Jiangsu Province, Professor. Research areas include physical oceanographic investigation and research.E-mail:sioxjp@139.com

Abstract

For 15 years since the beginning of China Argo project, China has deployed over 350 profiling floats in Pacific and Indian ocean, and constructed China Argo ocean observing network. Moreover, we have setup the Argo data receiving, processing and distributing system, and developed various Argo data products using Argo observations, which has promoted the progress of ocean data sharing in China. The abundant Argo data have become a main data source in oceanic and atmospheric basic researches and operational applications. A batch of important achievements in basic research and operational application have been brought, e.g. in aspects of tropical cyclone (typhoon), ocean circulation, meso-scale eddy, turbulence, heat/salt storage and transport and water mass, as well as in ocean, atmosphere/climate operational forecasting and predicting. With the extension of the international Argo program from “Core Argo” to “Global Argo”, we are faced with great challenges in the long-term maintaining and sustained developing of our Argo ocean observing network. It is suggested that we should take the opportunity to construct China regional Argo ocean observing network as soon as possible in adjacent northwestern Pacific and Indian ocean using Chinese BeiDou profiling floats, which will make us to take responsibility and obligation of a big country for addressing global climate changes and preventing natural disasters.

Keyword: Argo program; Argo ocean observing network; Argo data; Basic research; Operational application.
1 引 言

2000年启动的国际Argo计划, 在美国、日本、法国、英国、德国、澳大利亚和中国等30多个国家和团体的共同努力下, 已经于2007年10月在全球无冰覆盖的开阔大洋中建成一个由3 000多个Argo剖面浮标组成的实时海洋观测网(“ 核心Argo” ), 用来监测上层海洋内的海水温度、盐度和海流, 以帮助人类应对全球气候变化, 提高防灾抗灾能力, 以及准确预测诸如发生在太平洋的台风和厄尔尼诺等极端天气/海洋事件等[1, 2]。这是人类历史上建成的首个全球海洋立体观测系统。15年来, 各国在全球海洋布放的Argo浮标数量超过12 000个, 已累计获得了约150万条温度和盐度剖面, 比过去100年收集的总量还要多, 且观测资料免费共享, 被誉为“ 海洋观测技术的一场革命” 。目前, 国际Argo计划正从“ 核心Argo” 向“ 全球Argo” (即向季节性冰覆盖区、赤道、边缘海、西边界流域和2 000 m以下的深海域以及生物地球化学等领域)拓展, 最终会建成一个至少由4 000个Argo剖面浮标组成的覆盖水域更深、涉及领域更宽广、观测时域更长远的真正意义上的全球Argo实时海洋观测网[3]。海量观测资料已经应用到世界众多国家的业务化预测预报和基础研究中, 并在应对全球气候变化及防御自然灾害中得到广泛应用, 取得了大批调查研究成果[4~8](http://www-argo.ucsd.edu/Bibliography.html)。

2 中国Argo大洋观测网

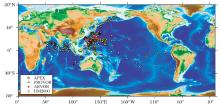
我国于2002年1月正式宣布加入国际Argo计划, 成为继美国、法国、日本、英国、韩国、德国、澳大利亚和加拿大之后第9个加入该计划的国家。中国Argo计划的总体目标是在邻近的西北太平洋和印度洋海域建成一个由100~150个Argo浮标组成的大洋观测网, 使我国成为Argo计划的重要成员国; 同时能共享到全球海洋中的全部Argo剖面浮标观测资料, 为我国的海洋研究、海洋开发、海洋管理和其他海上活动提供丰富的实时海洋观测资料及其衍生数据产品。同年, 在国家科技部的资助下启动实施了“ 我国新一代海洋实时观测系统— — Argo大洋观测网试验” 项目, 正式拉开了实施中国Argo计划的序幕。在国家科技部、国家教育部、国家自然科学基金委员会、中国科学院和国家海洋局等部门的支持下, 至2015年12月, 中国Argo计划已在太平洋、印度洋和地中海等海域布放了353个剖面浮标(图1), 其中准Argo浮标(由国家科研项目出资购置布放, 且其负责人同意观测资料与国际Argo成员国共享的浮标)183个, 已获取累计38 000余条温度、盐度剖面和6 000多条溶解氧剖面, 约占全球Argo剖面数量的2.5%。

这些浮标由来自7个科研院所的9名项目负责人承担的国家科研项目资助布放, 其中APEX型剖面浮标(美国Teledyne Webb研究公司)178个、PROVOR型剖面浮标(法国NKE和Martec公司、加拿大Metocean公司)159个、ARVOR型剖面浮标(法国NKE公司)10个, 以及6个HM2000型剖面浮标(中船重工第710研究所), 使用的通讯方式有ARGOS, IRIDIUM和北斗(BDS)等卫星系统, 分别占由我国布放全部浮标数量的84%, 14%和2%, 其中还包含21个加装溶解氧传感器的剖面浮标。

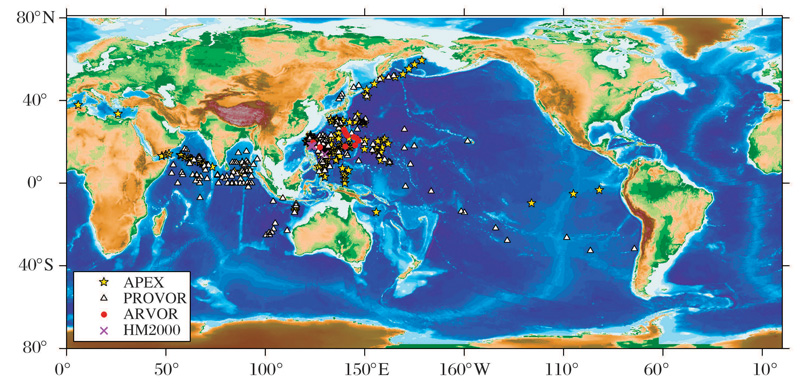
图1 2002— 2015年由中国Argo计划布放的剖面浮标位置Fig.1 The launch positions of Chinese Argo profiling floats in period of 2002-2015

中国Argo实时海洋观测网是我国海洋观测史上唯一以深海大洋观测为主, 覆盖范围最大、持续时间最长, 且建设资金投入最少的海洋立体观测系统。15年中, 中国Argo大洋观测网建设从西北太平洋起步, 逐渐拓展到北印度洋和南太平洋海域, 在全球Argo实时海洋观测网中布放剖面浮标的数量曾从排名第十上升到第四位。到目前为止(2015年12月), 仍有164个浮标在海上正常工作, 排在美国(2 151个)、澳大利亚(382个)、法国(337个)和日本(197个)之后, 退居第五。

3 Argo资料处理、质量控制及其数据产品
3.1 Argo资料处理流程

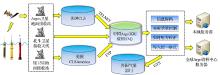
国际Argo计划的顺利实施主要依赖于各国Argo资料中心在浮标资料接收、处理和分发等方面的能力。早在中国Argo计划启动实施之初, 我国在杭州建立了中国Argo实时资料中心(China Argo Real-time Data Center, C-ARDC, http://www.argo.org.cn/), 着手建设针对不同类型剖面浮标的数据接收、处理和分发系统。经过15年的建设和完善, 所有由我国布放的剖面浮标观测资料均能在解码和质量控制后, 实时(24小时)提交到位于法国和美国的2个全球Argo资料中心, 供用户下载使用。图2显示了C-ARDC的Argo数据处理流程, 使用ARGOS卫星进行通讯的浮标通过该系统将观测数据以十六进制编码格式, 发送至法国图卢兹的ARGOS卫星地面接收中心(Collect Localisation Satellites, CLS), 随后由C-ARDC通过互联网准实时下载这些编码信息, 并进行正确解码, 再按照国际Argo资料管理组(Argo Data Management Team, ADMT)规定的实时质量控制过程[9], 对每条剖面进行质量控制, 并为每个观测值给出质量控制标记, 最后按ADMT规定的格式[10]提交给全球Argo资料中心(Global Data Assembly Centers, GDACs)。对于铱(IRIDIUM)卫星Argo剖面浮标, 其资料处理过程与上述使用ARGOS卫星进行通讯的浮标基本相同, 只是观测资料须通过美国马里兰州的CLS America转发, 且资料的格式与前者略有不同。至于国产北斗剖面浮标的资料处理过程, 则需要通过设在中国杭州的“ 北斗剖面浮标数据服务中心(BDS Profiling float Data Service Center, BDS-PDSC)” , 直接使用专门设备接收、解码, 并进行质量控制。

图2 中国Argo实时资料中心数据处理流程Fig.2 Data flow of processing at China Argo Real-time Data Center

需要指出的是, 世界气象组织(World Meteorological Organization, WMO)给每个Argo剖面浮标分配一个唯一的编号, 作为浮标数据在全球通讯系统(Global Telecommunication System, GTS)和GDACs上共享的识别码。自2015年10月起, 由我国布放的Argo浮标观测数据均已通过WMO设在中国气象局(China Meteorological Administration, CMA)的GTS接口上传, 与WMO成员国共享; 之前, 则通过法国CLS上传至GTS。

3.2 Argo资料质量控制及交换共享

国际Argo计划的观测目标是能获取世界大洋中精确度分别为0.005 ℃和0.01的海水温度和盐度资料。为了确保浮标观测资料的质量, 该计划在实施之初就提出了利用历史船载CTD仪观测数据对浮标观测的温度、盐度资料, 特别是盐度进行延时模式质量控制的方法[11~13]。基于OW方法[13], C-ARDC已建立了一套Argo浮标盐度资料延时模式质量控制系统, 并在实践中对早期提出的浮标观测资料质量控制方法进行了改进和完善[14~17] , 进一步提高了资料的质量。我国也是9个有能力向全球Argo资料中心实时提交经质量控制的Argo观测资料的国家(包括美国、法国、英国、澳大利亚、日本、韩国、印度、加拿大和中国)之一。

为了在国内科研院所推广使用全球Argo海洋观测数据集, C-ARDC不定期地从全球Argo资料中心下载其他Argo成员国布放的浮标资料, 进行质量再控制后, 以统一、更易读取的文本格式向国内外用户免费提供。截至2015年12月, 已收集和处理了140万条温度、盐度剖面(部分含溶解氧和叶绿素剖面), 并通过互联网(ftp.argo.org.cn)供用户下载使用。同时, 还采用分布式数据库、Web Services和OpenGIS等计算机技术, 建立了Argo资料共享服务平台(http:∥101.71.255.4:8090/flexArgo/out/argo.html), 以满足不同用户对Argo数据及其衍生数据产品快速查询、显示、绘图和有选择下载存储的需求。

3.3 Argo数据产品

针对Argo资料时空分布不规则, 以及早期Argo剖面还不够多, 观测时间序列还不够长等问题, 国内一些科研和业务单位结合历史观测资料(如XBT, CTD, ARGOS表层漂流浮标, 部分锚碇浮标和潜标, 以及卫星反演等)研制开发了多个网格化数据产品(表1)[18~27], 供广大用户免费下载共享, 极大地方便了人们的应用[28~37]。C-ARDC利用一种简单有效且易于操作的逐步订正法[23, 38], 并结合一个混合层模型[39](用来反推对应剖面上的表层温度和盐度, 以弥补早期布放的Argo浮标无法观测离海面约10 m以浅深度内温度、盐度资料的不足), 仅利用Argo剖面浮标观测资料, 构建了一套自2004年1月以来的全球海洋三维网格数据集(时间分辨率为1月、空间1° × 1° 、垂向49层), 且每年更新, 受到了国内用户的青睐, 已被广泛应用于相关领域的科学研究[32~35] 中。

表1 国内开发的Argo网格资料集及其应用情况 Table 1 Argo gridded datasets developed by China and their applications

中国Argo计划是我国海洋观测史上与国际社会合作密切、持续时间较长, 且观测数据能得到无条件、及时免费共享的一个国际海洋合作调查项目, 在一定程度上推动了国内海洋观测资料的共享进程。

4 Argo资料基础研究与业务化应用

中国Argo通过与Argo各成员国之间交换资料, 使得我国科学家能与各国科学家同步获得广阔海洋上丰富的海洋环境资料, 并开展相关前沿科学研究。过去15年里, Argo资料业已成为获取海洋气候态信息的主要来源, 被广泛应用于海洋、天气/气候等多个学科领域中, 研究内容涉及海气相互作用、大洋环流、中尺度涡和湍流, 以及海水热盐储量、输送, 以及大洋海水的特性与水团等; 同时, 在这些领域的业务化预测预报中也得到了广泛应用。

4.1 热带气旋(台风)研究

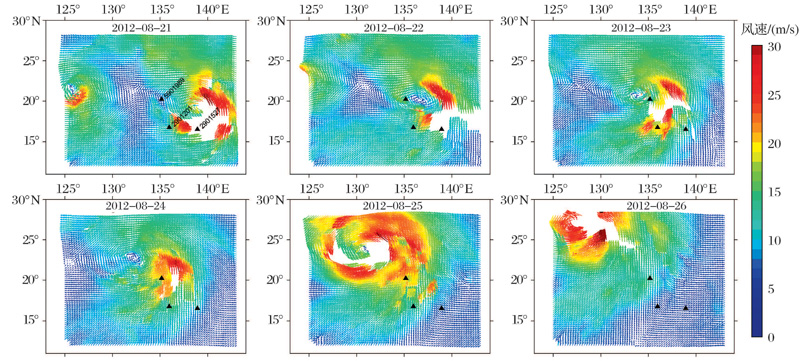
我国是较早使用铱卫星Argo剖面浮标的国家之一, 早在2010年11月就开始在西北太平洋海域布放该类型浮标。使用铱卫星高传输速率和双向通讯的优势, 开展了台风季节西北太平洋海域Argo剖面浮标加密观测试验, 获取了大量台风路径附近海域0~500 m、间隔2~3天的加密剖面资料, 为研究上层海洋对台风的响应提供了丰富的现场观测数据。

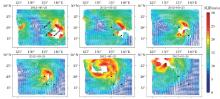
利用投放在西北太平洋海域的Argo剖面浮标观测资料, 结合卫星资料和模式模拟, 海峡两岸学者对台风过境海洋上层的响应过程都做了大量研究工作[40~49]。卫星观测资料主要用于描述海表面对热带气旋的响应, Argo资料的优势则在于揭示上层海洋对热带气旋的响应过程。许东峰等[43]分析了西北太平洋暖池区夏季Argo浮标得到的次表层温盐剖面, 发现大多数台风经过暖池区时, 会引起海面盐度下降, 认为热带气旋带来的淡水输入有利于盐度的下降。刘增宏等[44]对西北太平洋Argo浮标观测资料的统计分析结果显示, 台风造成的混合层盐度变化在台风路径两侧基本呈对称分布; Liu等[45]利用铱卫星Argo浮标加密观测资料对2012年Bolaven台风的分析结果显示(图3), 台风路径左右两侧海洋表层和次表层呈不同的温度、盐度变化过程; Pei等[46]利用模式结合卫星和Argo观测资料的研究指出, 台风作用下海洋上混合层深度会增加, 并向大气释放潜热, 以及台风中心出现强的冷水涌升等。Lin等[47~49]在研究海洋热含量对于热带气旋强度及其对风暴潮影响的预测、建立新的“ 海洋耦合潜在强度指数(OC_PI)” 的热带气旋预报因子、次表层全球海洋增暖暂缓与超强台风“ 海燕” 之间的联系等方面, 也都使用到了台风过境海域的Argo现场观测资料。

图3 2012年8月21~26日台风Bolaven期间的逐日风矢量分布[45]
(a)彩色阴影为风矢量; (b)黑色三角形为3个采用铱卫星双向通讯的Argo剖面浮标
Fig.3 Daily wind vector distributions for Typhoon Bolaven during August 21~26, 2012[45]
(a)Wind speeds are shaded by colors; (b)The three selected Iridium profiling floats are marked with black triangles

4.2 大洋环流、中尺度涡和湍流研究

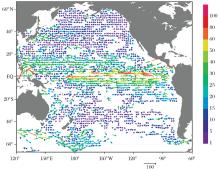
Yuan等[50]使用Argo资料计算了太平洋海域的绝对地转流场, 并以此揭示了北赤道流以下存在一支西传的地转流, 命名为北赤道次表层流。Wu等[51]同样使用Argo资料推算了西太平洋的地转流, 并分析了进出暖池区域的暖水情况。陈亦德等[52]利用Argo浮标的定位信息估算并分析了赤道太平洋中层流场(棉兰老涡、赤道流、赤道逆流等)的季节、年际变化等。Xie等[53]估算了全球海洋中层的绝对流场, 并依此对NCEP(National Centers for Environmental Prediction)的中层流再分析产品进行了检验, 发现除近赤道海域, NCEP中层流要比Argo估算的结果小, 二者之差为-2.3~-1.8 cm/s, 且NCEP资料中纬向流占主导地位, 所以一些涡旋不能被成功分辨出。Xie等[54, 55]还利用Argo浮标漂移轨迹开发了一套全球海洋表层流数据集, 并与热带大气与海洋观测阵(Tropical Atmosphere Ocean, TAO)等资料进行了比较, 结果表明通过Argo资料获取的表层流数据可以很好地补充大洋表层流资料库(图4)。张韧等[56]则利用Argo资料推算了太平洋海域的三维流场, 为获取大尺度海洋三维流场提供了有效途径。

北赤道流在菲律宾以东13° N附近分叉, 形成南、北两支西边界流(即南向的棉兰老流和北向的黑潮)。棉兰老流区是连接热带和副热带环流的一个纽带, 该区域的环流及涡旋形态对研究南北半球水团交换有着重要意义, 然而该区域涡旋结构及环流形态变化复杂, 无法通过一次或几次水文调查得到完整描述。自2003年以来, 中国Argo计划将该海域作为重点, 陆续布放了一批Argo浮标, 其中一个浮标在棉兰老岛以东海域捕捉到了中层反气旋涡的迹象, 这是除了棉兰老岛以南的气旋式冷涡(棉兰老涡)和反气旋式暖涡(哈马黑拉涡)之外观测到的另一个涡旋。该涡旋位于温跃层以下, 具有中层海洋特征[57]。周慧等[58]进一步分析棉兰老岛以东中层深度(1 000~2 000 m)上的中尺度环流特征发现, 该区域的气旋式涡旋和反气旋式涡旋在1 000 m深度上平均切向速度约为20 cm/s, 随着深度增加速度有所减小, 到2 000 m深度上速度约为10 cm/s。Xu等[59]通过对高、低分辨率海洋模式结果与Argo观测资料的对比研究, 指出涡旋导致的潜沉发生在冬季黑潮延伸体海域深混合层池区南侧几百公里范围内, 并提出了跨混合层深度锋面的涡旋平流可能是导致副热带西部模态水潜沉的新猜想。随后又利用Argo浮标对涡旋进行跟踪观测获得的长期资料, 证实了跨混合层深度锋面的涡旋外围的位势涡度分布确实具有不对称性, 并发现混合层中低位涡水潜沉发生在反气旋涡东侧的南向流处。

Wu等[60]使用Argo浮标的观测结果研究了南大洋2 000 m上层的湍流混合(图5), 发现南大洋的混合存在明显的空间分布不均匀性, 在地形平坦处, 湍流混合相对较弱, 而在地形粗糙的地方, 混合明显加强; 在地形平坦的地方, 湍流混合还存在明显的季节变化, 其变化信号可以一直向下延伸到1 500 m处。通过计算风生近惯性能量发现, 该处混合主要是由风生近惯性能量维持, 而相应的混合季节变化则是由风生近惯性能量的季节变化引起的; 在地形粗糙的地方, 湍流混合不存在明显的季节变化, 原因是由提供混合能量的南极绕极流(Antarctic Circumpolar Current, ACC)无明显季节变化所致。

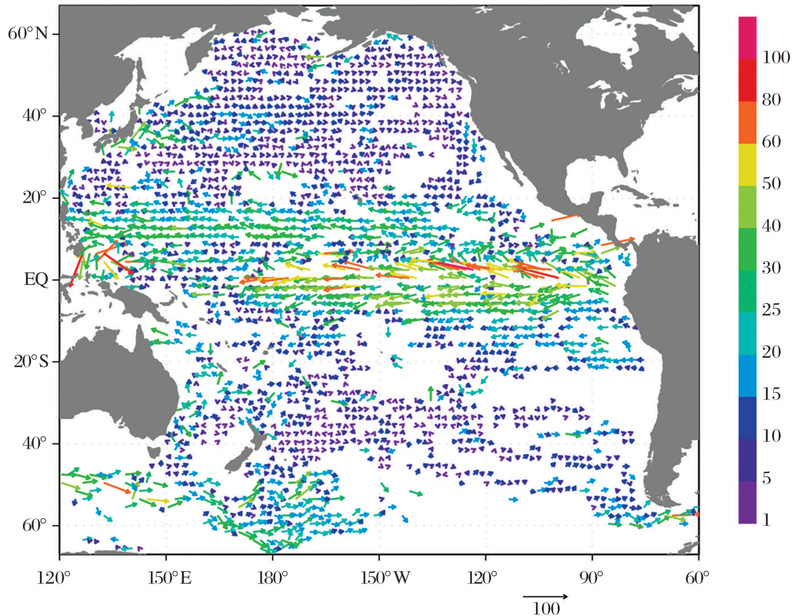
图4 2001— 2004年由Argo浮标轨迹资料获取的太平洋海域表层平均流速分布[54](单位:cm/s)Fig.4 Mean surface velocity vectors derived from Argo trajectories in Pacific ocean in period of 2001-2004[54] (unit: cm/s)

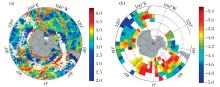
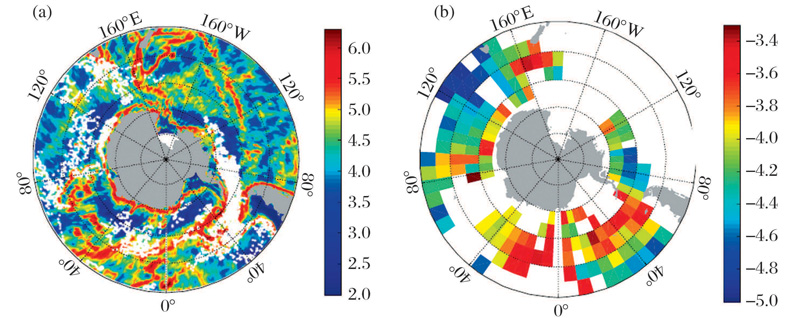
图5 南大洋地形粗糙程度及湍流混合的水平分布[60]
(a)地形粗糙度及南大洋布放的高分辨率铱卫星Argo观测剖面位置分布(白点所示), 颜色标尺的单位为log10(粗糙度)(单位:m2); (b)300~1 800 m垂向积分所得的湍流跨等密度面混合扩散系数水平分布, 颜色标尺的单位为log10(K)(单位:m2/s)
Fig.5 Horizontal distribution of topographic roughness and diapycnal diffusivity in the Southern Ocean[60]
(a) Topographic roughness and geographic distribution of high-resolution profiles (white dots) obtained from the Argo Iridium floats used in the Southern Ocean and described in this paper, The colour scale represents Log10(roughness) in m2 ; (b) Horizontal distribution of diapycnal diffusivity, vertically averaged over the depth range 300~1 800 m; The colour scale represents Log10(K)(roughness) in m2/s

4.3 海水热盐储量/输送研究

Argo观测网建立的目标之一是估算全球大洋热量和淡水储量的时间序列。其中, 上层海洋热含量(Ocean Heat Content, OHC)是气候变化的一个重要指标, 且对全球海平面上升有重要影响。Cheng等[61]研究指出, 2001— 2003年OHC出现大的跳跃并不是事实, 而是海洋观测网从船舶观测向Argo观测的巨大转变所带来的影响, 属于样本误差。因此, 气候态的选取以及数据的垂向分辨率对于OHC的准确估算有很大影响[62, 63]。吴晓芬等[64]分析了热带西太平洋海域OHC的时空变化, 发现除了众所周知的东— 西反位相年际振荡外, OHC距平场还存在一个负— 正— 负的三极子经向年际振荡模态。Zhang等[65]基于高度计与Argo资料研究中尺度涡水体输送的文章, 提出了中尺度涡通过在等密度面上形成闭合等位涡线携带水体一起运动的物理机制, 并估计出中尺度涡在全球范围造成的西向水体输运量可以达到30~40 Sv, 其在量级上与大尺度的风生及热盐环流是可比的(图6)。

Yang等[66]分析了太平洋海域15° N断面的净经向热输送(Meridional Heat Transport, MHT), 指出MHT的变化集中在0~800 m。Yang等[67]分析了热带东南印度洋中尺度涡的热盐输送, 认为气旋式涡旋(反气旋式涡旋)的经向热输送是向南(向北)的, 而盐量是向北(向南)输送, 且主要的经向热盐输送都发生在0~300 m深度范围内。

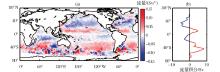
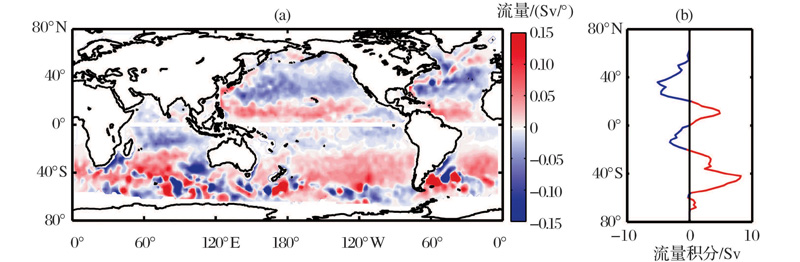
图6 中尺度涡带来的经向输送的全球分布[65]
(a)流经纬向断面的涡致经向输送; (b)涡致经向输送的纬向积分
Fig.6 Global distribution of the meridional transport of fluid trapped by mesoscale eddies[65]
(a) Eddy-induced meridional transport through a zonal cross-section per degree of longitude; (b) Distribution of the total zonal-integrated meridional transport induced by eddies as a function of latitude

4.4 大洋海水特性和水团研究

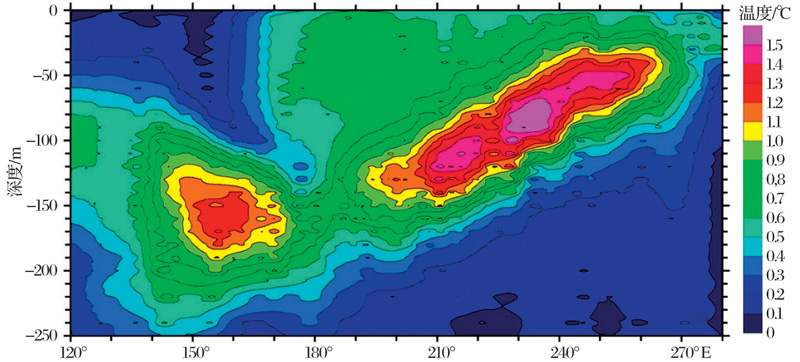
Chen等[34]使用Argo网格化温度资料分析了上层海洋年际变化的幅度、位相和周期等, 提出在太平洋海域10° S~10° N存在一个“ 尼诺管道(Niñ o Pipe)” , 其路径与太平洋赤道潜流(Equatorial Under Current, EUC)的路径非常一致(图7)。Zheng等[68, 69]使用Argo资料分析了太平洋海域障碍层厚度(Barrier Layer Thickness, BLT)的年际变化以及盐度年际变化对厄尔尼诺— 南方涛动 (El Niñ o-Southern Oscillation, ENSO)事件的影响, 认为赤道太平洋海域BLT的年际变化在ENSO循环过程中呈纬向的“ 跷跷板” 变化模态, 而在赤道中太平洋海域, 盐度通过调节混合层深度进而影响到BLT的年际变化。盐度还在调节热带西太平洋海域海面动力高度(Sea Surface Dynamic Height, SSDH)上扮演着非常重要的角色, 且盐度对SSDH的影响程度和温度对SSDH的影响程度相当[70]。2015年, Du等[71]使用Argo和历史观测数据分析了热带印度洋— 太平洋海域盐度的年代际(2004— 2013年)变化, 指出热带西太平洋上层海洋盐度增加而热带东南印度洋盐度降低的变化趋势与沃克环流(Walker Circulation)的增强有关。盐度数据还被广泛应用于评估Aquarius和SMOS等卫星在各海域对应的海表盐度产品精度[72, 73]

高时空分辨率的Argo 剖面浮标资料还为准确估算全球各海区的混合层、温跃层、障碍层、海面高度及海洋声场等参数提供了非常便利的途径。安玉柱等[29]分别采用温度判据和密度判据计算了全球大洋混合层深度, 并讨论了障碍层和补偿层对混合层深度计算的影响, 认为赤道西太平洋、孟加拉湾、热带西大西洋是障碍层高发区域, 冬季的北太平洋副热带海区以及东北大西洋是补偿层发生的海区。Yi等[74]采用Argo、高度计等资料计算了2010年之后全球海洋平均海面高度(Global Mean Sea Level, GMSL)的增速, 指出GMSL的升高与ENSO波动一致, 其升高速度自2010年后加大。Argo资料还被应用于菲律宾海[75]、中国台湾以东海域[76]和热带印度洋[32]等海区的声场分析中。

许建平等[4]和Sun等[77]较早利用Argo资料分析了太平洋水的温度、盐度分布特征及其水团特性, 并给出了北太平洋热带水(North Pacific Tropical Water, NPTW)、北太平洋中层水(North Pacific Intermediate Water, NPIW)和北太平洋深层水(North Pacific Deep Water, NPDW)等主要水团的特征指标。刘增宏等[78]通过分析吕宋海峡附近海域的Argo资料发现, NPTW入侵南海的程度冬季最强, 而在2003— 2009年却没有发现明显的NPIW进入南海, 而南海中层水则可通过海峡流入太平洋, 且强度在秋、冬季节达到最大。宋翔洲等[79]依据Argo资料所揭示的西北太平洋模态水核心区温度、盐度季节变化, 提出了一种判别模态水范围的盐度判别法, 结合海平面高度异常变化, 发现涡旋只能暂时性改变核心区模态水的温盐结构, 之后模态水将基本恢复到正常状态。Yan等[80]在模式模拟中发现菲律宾吕宋岛以西的南海海域夏季出现双核低盐水, 开始于7月, 9月盐度达到最低值, 10月消失, 与夏季风引起的降水有很大关系, 而混合层深度的变化则是双核形成的主要因素。该结论得到了位于低盐水海域、时间分辨率为4天的Argo浮标实测资料的证实。

图7 太平洋海域沿1° S断面海温变化谐振幅[34]Fig.7 Averaged longitude-depth cross section of recovered harmonic amplitude of sea temperature variability along 1° S of the Pacific sector (120° ~285° E)[34]

4.5 业务化预测预报应用

数据同化技术已经能将众多常规的海洋观测资料(如船舶, XBT, CTD, TAO和Argo等)及非常规的资料(如各种卫星遥感、雷达站等)融合进入海洋数值模型, 构建资料同化系统, 以期获取能真实反映海洋状态的各种物理变量(如温度、盐度、海面高度和流场等), 这些海洋环境要素为大洋环流、海气耦合模式提供了更加准确的初始场和开边界条件, 从而提高对气候变化预测预报的水平。

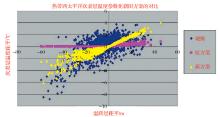
早在2004年, Argo资料就被应用于改进海洋资料同化和模式中的物理过程[81], 同时也用来提高ENSO和我国夏季降水的气候预测水平[82, 83](图8); Argo在国家气候中心全球海洋资料四维同化系统(NCC-GODAS)中为短期气候预测系统提供了重要海洋异常状况的初始信号[84], 为全球气候预测业务模式系统及ENSO预报能力的提高发挥了重要作用。目前该同化系统已经发展到第二代[85, 86], 其对热带太平洋海面高度的年际和10年际变化及2种类型的厄尔尼诺信号的捕捉能力明显优于第一代。

中国科学院大气物理研究所朱江[87]带领的团队在国内率先开发了一个基于三维变分的海洋资料同化系统(Ocean Variational Analysis System, OVALS), 能有效同化Argo, TAO, XBT及船舶报和高度计海面高度异常资料, 同化后的温度、盐度较非同化试验产生了显著的改善。OVALS被成功应用于国家海洋环境预报中心的热带太平洋温度、盐度同化业务化系统中, 能实时发布热带太平洋海域温度、盐度再分析产品, 使中国成为继欧美发达国家之后具有发布热带太平洋温度、盐度再分析产品能力的国家之一, 为防灾减灾、大洋航线预报及突发性事件处理等提供有力保障。国家海洋信息中心利用多尺度三维变分并结合POM模型开发的中国海及其邻近海域资料同化系统(China Ocean Reanalysis, CORA)[88], 目前已经扩展到全球海洋[89], 明显提高了对热含量、大西洋经向翻转流和赤道太平洋次表层海流等的估算精度。

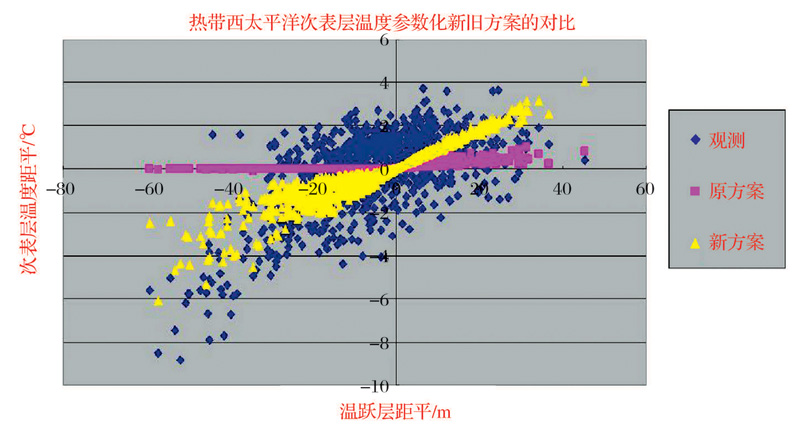
图8 Zebiak-Cane海洋模式计算得到的热带西太平洋次表层温度距平与混合层深度的关系及与实况的对比[84]
黄色代表利用Argo资料改进后方案的计算结果
Fig.8 Comparison of observed relationship between subsurface temperature anomaly and mixed-layer depth in the tropical western Pacific with that calculated by the parameterization scheme in Zebiak-Cane oceanic model[84]
Yellow colors represent improved parameterization scheme by Argo data

Argo为海洋数据同化系统的建立提供了源源不断的、更是前所未有的数据源, 同时, Argo资料在同化系统以及业务化预测预报应用中也取得了一系列理论和实际应用成果。随着全球Argo海洋观测网的进一步拓展和长期维持, Argo资料在改进同化方法、改善数值模型参数化方案、提高海洋和气候业务化预测预报水平方面将会发挥更重要的作用。此外, Argo资料在海洋渔业领域也得到了较好的应用[90, 91]。据国际Argo计划办公室的统计(http:∥www-argo.ucsd.edu/Bibliography.html), 自1998年以来世界上42个国家的科学家在全球18种主要学术刊物(包括JGR, GRL, JPO和JC等)上累计发表了近2 300篇与Argo相关的学术论文, 其中由中国学者发表的论文就达310篇, 仅次于美国(约670篇), 排名第二。

5 挑战与展望

Argo已经成为从海盆尺度到全球尺度物理海洋学研究的主要数据源, 而且也已在海洋和大气等科学领域的基础研究及其业务化预测预报中得到广泛应用[92]。未来Argo计划的发展, 也正如2016年初由18个沿海国家的27位作者在《Nature》上联名发表的综述性文章“ Fifteen years of ocean observations with the global Argo array(全球Argo海洋观测十五年)” [93]中指出的那样, 从现在开始的10年或者20年后, 可能才会有科学团体逐渐意识到当时所制订的布放浮标策略、投放浮标或者执行Argo计划是何等的成功。为此, 国际Argo指导组(Argo Steering Team, AST)建议, 在未来数年持续实施该计划, 并逐渐成为一个长期计划至关重要; 同时, 应通过改进并在新的特殊海区投放浮标和增加新传感器, 以及设计和测试深海浮标工作能力, 使之朝着新的方向发展。其目标应是既能维持当前这个观测全球海洋的系统, 又能进一步提高人们认知海洋在气候变化中的重要角色。同时, 该文还进一步强调, 实施深海Argo是该计划发展的关键一步。当前的观测网在提供对全球海洋2 000 m上层热含量的估算中起到了至关重要的作用, 但对基于全球热收支模式的预测还不够。一些研究还指出, 全球海洋的更深层(> 2 000 m)可能是一个储存增加热量的水域, 故将全球热平衡边界封闭起来非常必要。开展深海Argo观测, 有望利用浮标观测海洋碳循环, 帮助提高对ENSO和印度洋偶极子(Indian Ocean Dipole, IOD)的预报能力, 进一步提高人们对海洋环流的了解及其在气候方面的作用[93]

展望未来, 国际Argo计划仍将持续实施, Argo实时海洋观测网建设也会从“ 核心Argo” 向“ 全球Argo” 的远大目标继续迈进, Argo资料的应用虽然取得了一些成果, 但与相关国际前沿领域的发展相比, 我国还有不小的差距。如利用Argo浮标漂移轨迹估算全球海洋流场数据集[94], 并应用到海洋内部流场验证的系统研究[95, 96]; 利用Argo资料改进对海洋复杂空间变化(尺度小于气候尺度)的研究[97], 以及结合Argo浮标的现场观测资料与卫星高度计反演的海表高度异常数据, 构建北大西洋的经向翻转流[98]和高分辨率的三维温度场[99]等时间序列的海洋环流动力学状态方面, 我国学者还很少涉足。在国际上, 近些年开发的许多气候模式都同化了Argo次表层温度资料, 使得模式对大气季节内波动、季风活动以及海气相互作用(如ENSO)等问题的预报能力[100] 都有了明显提高。邻近我国的强西边界流— — 黑潮, 可以通过携带热带和亚热带温暖的海水到高纬度地区, 实现热量向极输送; 在其流路上还会有相当一部分热量与大气进行交换, 尤其是一些海流会从边界分离进入海洋内部或近岸海域, 从而改变风暴的路径或改善大陆性气候[101]等。当前, 配备诸如溶解氧、硝酸盐、叶绿素和pH等生物地球化学要素传感器的浮标, 可以从物理角度监测海洋环流对气候态关键生物地球化学过程(如碳循环[102]、海洋缺氧和海水酸化等)[103]的影响, 而这些新颖浮标的观测结果还将有助于提高生物地球化学模式的模拟能力[104]。此外, 近些年的一些研究成果[105~108]还涉及到2 000 m以下的深海大洋, 尤其是在南半球的高纬度海域, 在整个海洋热含量和热比容导致的海平面上升方面都具有举足轻重的地位。可见, 我国在Argo资料的基础研究和业务化应用方面还面临着许多挑战。

在过去的15年中, 我国虽已累计布放了350多个浮标, 但在全球观测网中却仅占3%左右, 远远落后于美国、澳大利亚、法国和日本等国家, 其中美国占了总数的50%以上; 国产剖面浮标虽已被国际Argo计划组织接纳, 开始用于全球Argo海洋观测网建设与维护[109], 不过在当前运行的观测网中所占比例还不到0.03%。再环顾邻近的东南亚和印度洋沿海国家, 虽然全球Argo实时海洋观测网已有30多个国家参与建设与维护, 且观测资料免费共享, 但对许多东南亚和印度洋沿海国家而言, 尽管长期饱受台风(飓风)、风暴潮、海浪, 甚至海啸等海洋灾害的侵袭和威胁, 却由于种种原因至今尚未享受到该观测网所带来的“ 红利” 。中国和印度虽较早加入了国际Argo计划并参与观测网建设, 但两国在海上布放浮标的数量(在全球Argo观测网中仅占5.8%)至今还十分有限, 印度洋Argo观测网中的浮标数量与太平洋和大西洋相比要落后一截, 至今仍未达到国际Argo计划提出的最低标准, 尤其是南海的Argo区域观测网目前还是域外国家在建设和维护。可见, 增加在印度洋海域的浮标数量, 并由域内国家主持建设南海区域海洋观测网, 促进观测资料在东南亚和印度洋沿海国家的推广应用已迫在眉睫。

为此, 我国应以成功研制北斗剖面浮标, 以及国际Argo计划由“ 核心Argo” 向“ 全球Argo” 拓展为契机, 通过建立的BDS-PDSC, 积极主动地建设北太平洋西边界流(台风源地)海域、西太平洋典型边缘海— 南海的Argo区域海洋观测网, 并逐步向印度洋孟加拉湾和阿拉伯海扩展, 最终建成至少由400个剖面浮标(以国产北斗剖面浮标为主)组成的覆盖“ 海上丝绸之路” 的区域Argo海洋观测网, 使之成为“ 全球Argo” 的重要组成部分, 增进与“ 海上丝绸之路” 沿线国家交流与合作的纽带, 进一步促进Argo资料在我国乃至沿线国家业务化预测预报和基础研究中的推广应用, 让沿线国家和民众能够真切体验和更多享受到海上丝路建设带来的福祉, 并为应对全球气候变化及防御自然灾害, 更多地承担一个海洋大国的责任和义务。

The authors have declared that no competing interests exist.

参考文献
[1] Argo Science Team. On the Design and Implementation of Argo: An Initial Plan for A Global Array of Profiling Floats[R]. ICPO Report No. 21. GODAE International Project office, Bureau of Meteorology, 1998. [本文引用:1]
[2] Xu Jianping. A Exploration of Global Ocean Argo Observing[M]. Beijing: Ocean Press, 2002.
[许建平. 阿尔戈全球海洋观测大探秘[M]. 北京: 海洋出版社, 2002. ] [本文引用:1]
[3] Freeland H J, Roemmich D, Garzoli S L, et al. Argo—A Decade of Progress[R]. Venice, Italy: OceanObs’09 Meeting, 2009. [本文引用:1]
[4] Xu Jianping. A Collection of Research Articles on Argo Application[C]. Beijing: Ocean Press, 2006.
[许建平. Argo应用研究论文集[C]. 北京: 海洋出版社, 2006. ] [本文引用:2]
[5] Xu Jianping. A Collection of Research Articles on Argo Profiling Float Observations and Applications[C]. Beijing: Ocean Press, 2010.
[许建平. 西太平洋Argo剖面浮标观测及其应用研究论文集[C]. 北京: 海洋出版社, 2010. ] [本文引用:1]
[6] Xu Jianping. A Collection of Research Articles of Argo Science workshop[C]. Beijing: Ocean Press, 2014.
[许建平. Argo科学研讨会论文集[C]. 北京: 海洋出版社, 2014. ] [本文引用:1]
[7] Chen Dake. A Collection of Research Articles on Argo[C]. Beijing: Ocean Press, 2011.
[陈大可. Argo研究论文集[C]. 北京: 海洋出版社, 2011. ] [本文引用:1]
[8] Chen D. Argo-China[J]. Atmosphere-Ocean, 2012, 50(Suppl. ): 1-3. [本文引用:1]
[9] Wong A, Keeley R, Carval T, et al. Argo Quality Control Manual[R/OL]. [2016-04-10]. http://dx.doi.org/10.13155/33951. [本文引用:1]
[10] Carval T, Keeley R, Takatsuki Y, et al. Argo user’s manual V3. 2[R/OL]. [2016-04-10]. http://dx.doi.org/10.13155/29825. [本文引用:1]
[11] Wong A P S, Johnson G C, Owens W B. Delayed-mode Calibration of Profiling Float Salinity Data by Historical Hydrographic Data[R]. Albuquerque, NM: Fifth Symposium on Integrated Observing System, 2001. [本文引用:1]
[12] Böhme L. Quality Control of Profiling Float Data in the Subpolar North Atlantic[D]. Germany: Christian-Albrechts-Universität Kiel, 2003. [本文引用:1]
[13] Owens W, Wong A. An improved calibration method for the drift of the conductivity sensor on autonomous CTD profiling floats by θ-S climatology[J]. Deep-Sea Research Part I: Oceanographic Research Papers, 2009, 56(3): 450-457. [本文引用:2]
[14] Xu Jianping, Liu Zenghong. Experiment of Chinese Argo Ocean Observing Array[M]. Beijing: China Meteorological Press, 2007.
[许建平, 刘增宏. 中国Argo大洋观测网试验[M]. 北京: 气象出版社, 2007. ] [本文引用:1]
[15] Tong Mingrong, Xu Jianping, Ma Jirui, et al. Probing into the conductivity sensor drift problem of the ARGO profiling float[J]. Ocean Technology, 2004, 23(3): 105-116.
[童明荣, 许建平, 马继瑞, . Argo剖面浮标电导传感器漂移问题探讨[J]. 海洋技术, 2004, 23(3): 105-116. ] [本文引用:1]
[16] Liu Zenghong, Xu Jianping, Sun Chaohui. Discussing on detecting and calibration method of Argo conductivity sensor drift errors[J]. Ocean Technology, 2007, 26(4): 72-76.
[刘增宏, 许建平, 孙朝辉. Argo浮标电导率漂移误差检测及其校正方法探讨[J]. 海洋技术, 2007, 26(4): 72-76. ] [本文引用:1]
[17] Lu Shaolei, Li Hong, Liu Zenghong. Improvement of Argo salinity data delayed-mode quality control method[J]. Journal of PLA University of Science and Technology (Natural Science Edition), 2014, 15(6): 598-606.
[卢少磊, 李宏, 刘增宏. Argo盐度资料延时质量控制的改进方法[J]. 解放军理工大学学报: 自然科学版, 2014, 15(6): 598-606. ] [本文引用:1]
[18] Wang Guihua, Liu Zenghong, Xu Jianping. Three dimensional Pacific temperature, salinity and circulation reconstructions with Argo data[C]∥Xu Jianping, ed. A Collection of Research Articles on Argo Application. Beijing: Ocean Press, 2006: 16-26.
[王桂华, 刘增宏, 许建平. 利用Argo 资料重构太平洋三维温盐场和流场[C]∥许建平. Argo应用研究论文集. 北京: 海洋出版社, 2006: 16-26. ] [本文引用:1]
[19] Yang Shenglong, Ma Junjie, Wu Yumei, et al. Study on the reconstruction of Pacific temperature arena with Argo data based on the Kriging methods[J]. Marine Fisheries, 2008, 30(1): 13-18.
[杨胜龙, 马军杰, 伍玉梅, . 基于Kriging方法Argo数据重构太平洋温度场研究[J]. 海洋渔业, 2008, 30(1): 13-18. ] [本文引用:1]
[20] Wang Huizan, Wang Guihua, Zhang Ren, et al. Argo Gridded Salinity Product (G-Argo) User Manual[Z]. Hangzhou: China Argo Real-time Data Center, 2010.
[王辉赞, 王桂华, 张韧, . Argo 网格化盐度产品(G-Argo)用户手册[Z]. 杭州: 中国Argo实时资料中心, 2010. ] [本文引用:1]
[21] National Marine Data and Information Service. Argo Gridded Product User Manual[Z]. Tianjin: National Marine Data and Information Service, 2011.
[国家海洋信息中心. Argo 网格化产品用户手册[Z]. 天津: 国家海洋局信息中心, 2011. ] [本文引用:1]
[22] Li Hong, Xu Jianping, Liu Zenghong, et al. Global Ocean Argo Gridded Dataset (BOA_Argo) User Manual[Z]. Hangzhou: China Argo Real-time Data Center, 2012.
[李宏, 许建平, 刘增宏, . 全球海洋Argo 网格数据集(BOA_Argo)用户手册[Z]. 杭州: 中国Argo实时资料中心, 2012. ] [本文引用:1]
[23] Li Hong, Xu Jianping, Liu Zenghong, et al. Study on the global ocean Argo gridded dataset and its validation[J]. Marine Science Bulletin, 2013, 32(6): 108-118.
[李宏, 许建平, 刘增宏, . 全球海洋Argo网格资料集及其验证[J]. 海洋通报, 2013, 32(6): 108-118. ] [本文引用:1]
[24] Li Hong, Xu Jianping, Liu Zenghong, et al. Global Ocean Argo Gridded Dataset (BOA_Argo) User Manual[Z]. Hangzhou: China Argo Real-time Data Center, 2014.
[李宏, 许建平, 刘增宏, . 全球海洋Argo 网格数据集(BOA_Argo)用户手册[Z]. 杭州: 中国Argo实时资料中心, 2014. ] [本文引用:1]
[25] Li Hong, Liu Zenghong, Xu Jianping, et al. Introduction of Global Ocean Argo Gridded Dataset (BOA_Argo)[Z]. Hangzhou: China Argo Real-time Data Center, 2015.
[李宏, 刘增宏, 许建平, . 全球海洋Argo 网格数据集(BOA_Argo)介绍[Z]. 杭州: 中国Argo实时资料中心, 2015. ] [本文引用:1]
[26] Mao Qingwen, Chu Xiaoqing, Yan Youfang, et al. A three-dimensional temperature and salinity reconstruction system in the South China Sea[J]. Journal of Tropical Oceanography, 2013, 32(6): 1-8.
[毛庆文, 储小青, 严幼芳, . 南海三维动态温盐场重构系统的设计与实现[J]. 热带海洋学报, 2013, 32(6): 1-8. ] [本文引用:1]
[27] Zhang Chunling, Xu Jianping, Liu Zenghong, et al. User Manual of Argo Three-dimensional Grid Data(GDCSM_Argo)[Z]. Hangzhou: China Argo Real-time Data Center, 2013.
[张春玲, 许建平, 刘增宏, . Argo三维网格化资料(GDCSM _Argo)用户手册[Z]. 杭州: 中国Argo实时资料中心, 2013. ] [本文引用:1]
[28] Jiang Lianghong, Chen Dake. Spatiotemporal analysis of tropical Pacific barrier layer thickness[J]. Journal of Marine Sciences, 2012, 30(2): 14-20.
[姜良红, 陈大可. 热带太平洋障碍层厚度的时空特征分析[J]. 海洋学研究, 2012, 30(2): 14-20. ] [本文引用:1]
[29] An Yuzhu, Zhang Ren, Wang Huizan, et al. Study on calculation and spario-remporal variations of global ocean mixed layer depth[J]. Chinese Journal of Geophysics, 5012, 55(7): 2 249-2 258.
[安玉柱, 张韧, 王辉赞, . 全球大洋混合层深度的计算及其时空变化特征分析[J]. 地球物理学报, 2012, 55(7): 2 249-2 258. ] [本文引用:1]
[30] Zhang Weitao, Zhang Ren, An Yuzhu, et al. Diagnostic calculation of three dimensions sea flow in the Pacific by P vector method on isophycnal surface[J]. Chinese Journal of Hydnodynanics, 2013, 28(1): 72-80.
[张伟涛, 张韧, 安玉柱, . 基于等密度面P矢量方法的太平洋三维流场估计[J]. 水动力学研究与进展, 2013, 28(1): 72-80. ] [本文引用:1]
[31] Gao Fei, Zhang Ren, Li Can, et al. Analysis of the characteristics of temperature and thermocline in the ocean east of Taiwan based on gridded Argo data[J]. Journal of Tropical Oceanography, 2014, 33(1): 17-25.
[高飞, 张韧, 李璨, . 基于Argo 网格产品资料的台湾以东海域海温场结构与温跃层特征分析[J]. 热带海洋学报, 2014, 33(1): 17-25. ] [本文引用:1]
[32] Han Yukang, Zhou Lin. Analysis of acoustic field in the tropical Indian Ocean upper based on Argo data[J]. Journal of PLA University of Science and Technology(Natural Science Edition), 2015, 16(2): 180-187.
[韩玉康, 周林. 基于Argo资料的热带印度洋上层声场分析[J]. 解放军理工大学学报: 自然科学版, 2015, 16(2): 180-187. ] [本文引用:2]
[33] Chen G, Yu F. An objective algorithm for estimating maximum oceanic mixed layer depth using seasonality indices derived from Argo temperature/salinity profiles[J]. Journal of Geophysical Research, 2015, 120(1): 582-595. [本文引用:1]
[34] Chen G, Chen H N. Interannual modality of upper-ocean temperature: 4D Structure Revealed by Argo Data[J]. Journal of Climate, 2015, 28(9): 3 441-3 452. [本文引用:1]
[35] Chen G, Wang X. Vertical structure of upper-ocean seasonality: Annual and semiannual cycles with oceanographic implications[J]. Journal of Climate, 2016, 29(1): 37-59. [本文引用:1]
[36] Zhang Chunling, Xu Jianping. T/S distribution and variation in the Pacific based on Argo observations Part Ⅰ: Temperature[J]. Marine Science Bulletin, 2014, 33(6): 647-658.
[张春玲, 许建平. 基于Argo观测的太平洋温、盐度分布与变化(Ⅰ): 温度[J]. 海洋通报, 2014, 33(6): 647-658. ] [本文引用:1]
[37] Zhang Chunling, Xu Jianping. T/S distribution and variation in the Pacific based on Argo observations PartⅡ: Salinity[J]. Marine Science Bulletin, 2015, 34(1): 21-31.
[张春玲, 许建平. 基于Argo观测的太平洋温、盐度分布与变化(Ⅱ): 盐度[J]. 海洋通报, 2015, 34(1): 21-31. ] [本文引用:1]
[38] Li Hong, Xu Jianping, Liu Zenghong, et al. Study on establishment of gridded Argo data by successive correction[J]. Marine Science Bulletin, 2012, 31(5): 502-514.
[李宏, 许建平, 刘增宏, . 利用逐步订正法构建Argo网格资料集的研究[J]. 海洋通报, 2012, 31(5): 502-514. ] [本文引用:1]
[39] Zhao Xin, Li Hong, Liu Zenghong, et al. The deduction of Argo surface temperature and salinity based on mixed layer model[J]. Marine Science Bulletin, 2016, in press.
[赵鑫, 李宏, 刘增宏, . 基于混合层模型反推Argo表层温度和盐度[J]. 海洋通报, 2016, 待刊. ] [本文引用:1]
[40] Sun L, Li Y X, Yang Y J, et al. Effects of super typhoons on cyclonic ocean eddies in the Western Pacific: A satellite data-based evaluation between 2000 and 2008[J]. Journal of Geophysical Research: Oceans, 2014, 119: 5 585-5 598. [本文引用:1]
[41] Wang X D, Wang C Z, Han G J, et al. Effects of tropical cyclones on large-scale circulation and ocean heat transport in the South China Sea[J]. Climate Dynamic, 2014, 43(12): 3 351-3 366. [本文引用:1]
[42] Cheng L J, Zhu J, Sriver R L. Global representation of tropical cyclone-induced short-term ocean thermal changes using Argo data[J]. Ocean Science, 2015, 11: 719-741. [本文引用:1]
[43] Xu Dongfeng, Liu Zenghong, Xu Xiaohua, et al. The influence of typhoon on the sea surface salinity in the Warm Pool of the western Pacific[J]. Acta Oceanologica Sinica, 2005, 27(6): 9-15.
[许东峰, 刘增宏, 徐晓华, . 西北太平洋暖池区台风对海表盐度的影响[J]. 海洋学报, 2005, 27(6): 9-15. ] [本文引用:1]
[44] Liu Zenghong, Xu Jianping, Zhu Bokang, et al. Upper ocean response to tropical cyclones in northwestern Pacific during 2001-2004 by Argo data[J]. Journal of Tropical Oceanography, 2006, 25(1): 1-8.
[刘增宏, 许建平, 朱伯康, . 利用Argo资料研究2001—2004年期间西北太平洋海洋上层对热带气旋的响应[J]. 热带海洋学报, 2006, 25(1): 1-8. ] [本文引用:1]
[45] Liu Z H, Xu J P, Sun C H, et al. An upper ocean response to Typhoon Bolaven analyzed with Argo profiling floats[J]. Acta Oceanologica Sinica, 2014, 33(11): 90-101. [本文引用:1]
[46] Pei Y H, Zhang R H, Chen D K. Upper ocean response to tropical cyclone wind forcing: A case study of typhoon Rammasun(2008)[J]. Science in China (Series D), 2015, 58(9): 1 623-1 632. [本文引用:1]
[47] Lin I I, Goni G J, Knaff A, et al. Ocean heat content for tropical cyclone intensity forecasting and its impact on storm surge[J]. Natural Hazards, 2013, 66(3): 1 481-1 500. [本文引用:1]
[48] Lin I I, Black P, Price J F, et al. An ocean coupling potential intensity index for tropical cyclones[J]. Geophysical Research Letters, 2013, 40(9): 1 878-1 882. [本文引用:1]
[49] Lin I I, Pun L F, Lien C C. “Categoty-6” supertyphoon Haiyan in global warming hiatus: Contribution from subsurface ocean warming[J]. Geophysical Research Letters, 2014, 41(23): 8 547-8 553. [本文引用:2]
[50] Yuan D L, Zhang Z C, Chu C P, et al. Geostrophic circulation in the tropical North Pacific Ocean based on Argo profiles[J]. Journal of Physical Oceanography, 2014, 44(2): 558-575. [本文引用:1]
[51] Wu X F, Zhang Q L, Liu Z H. Annual and interannual variations of the Western Pacific Warm Pool volume and sources of warm water revealed by Argo data[J]. Science in China (Series D), 2014, 57(9): 2 269-2 280. [本文引用:1]
[52] Chen Yide, Zhang Ren, Jiang Guorong. Evaluation and analysis of mid-depth currents of the equatorial Pacific using Argo float position information[J]. Marine Forecasts, 2006, 23(4): 37-46.
[陈亦德, 张韧, 蒋国荣. 利用Argo浮标定位信息估算分析赤道太平洋中层流场状况[J]. 海洋预报, 2006, 23(4): 37-46. ] [本文引用:1]
[53] Xie J P, Zhu J, Xu L, et al. Evaluation of mid-depth currents of NCEP reanalysis data in the tropical Pacific using Argo floats position information[J]. Advances in Atmospheric Sciences, 2005, 22(5): 677-684. [本文引用:1]
[54] Xie J P, Zhu J. Estimation of the surface and mid-depth currents from Argo floats in the Pacific and error analysis[J]. Journal of Marine Systems, 2008, 73(1): 61-75. [本文引用:1]
[55] Xie J P, Zhu J. A dataset of global ocean surface currents for 1999-2007 derived from Argo float trajectories: A comparison with surface drifter and TAO measurements[J]. Atmospheric and Oceanic Science Letters, 2009, 2(2): 97-102. [本文引用:1]
[56] Zhang Ren, Huang Zhisong, Liu Wei, et al. Diagnostic calculation of three dimensions sea currents in the Pacific based on Argo buoyage observational data[J]. Chinese Journal of Hydnodynanics, 2012, 27(3): 256-263.
[张韧, 黄志松, 刘巍, . 基于Argo浮标资料的太平洋三维流场估算[J]. 水动力学研究与进展, 2012, 27(3): 256-263. ] [本文引用:1]
[57] Zhou Hui, Xu Jianping, Guo Peifang, et al. A study on ananticyclonic eddy east of Mindonao observed by an Argo profiling float[J]. Journal of Tropical Oceanography, 2006, 25(6): 8-14.
[周慧, 许建平, 郭佩芳, . 棉兰老岛以东反气旋涡的Argo观测研究[J]. 热带海洋学报, 2006, 25(6): 8-14. ] [本文引用:1]
[58] Zhou Hui, Yuan Dongliang, Guo Peifang, et al. The characteristics of mesoscale signal in the east of Mindanao by Argo profiling float[J]. Science in China(Series D), 2010, 40(1): 105-114.
[周慧, 袁东亮, 郭佩芳, . Argo剖面浮标显示的棉兰老岛以东的中层环流中尺度信号特征[J]. 中国科学: D辑, 2010, 40(1): 105-114. ] [本文引用:1]
[59] Xu L, Li P, Xie S-P, et al. Observing mesoscale eddy effects on mode-water subduction and transport in the North Pacific[J]. Nature Communications, 2016, 7, doi: DOI:10.1038/ncomms10505. [本文引用:1]
[60] Wu L X, Jing Z, Riser S, et al. Seasonal and spatial variations of Southern Ocean diapycnal mixing from Argo profiling floats[J]. Nature Geoscience, 2012, 4(6): 363-366. [本文引用:1]
[61] Cheng L J, Zhu J. Artifacts in variations of ocean heat content induced by the observation system changes[J]. Geophysical Research Letters, 2014, 41(20): 7 276-7 283. [本文引用:1]
[62] Cheng L J, Zhu J. Uncertainties of the ocean heat content estimation induced by insufficient vertical resolution of historical ocean subsurface observations[J]. Journal of Atmospheric and Oceanic Technology, 2014, 31(6): 1 383-1 396. [本文引用:1]
[63] Cheng L J, Zhu J. Influence of the choice of climatology on ocean heat content estimation[J]. Journal of Atmospheric and Oceanic Technology, 2015, 32(2): 388-394. [本文引用:1]
[64] Wu Xiaofen, Xu Jianping, Zhang Qilong, et al. CSEOF analysis of the upper ocean heat content over tropical western Pacific[J]. Journal of Tropical Oceanography, 2011, 30(6): 37-46.
[吴晓芬, 许建平, 张启龙, . 热带西太平洋海域上层海洋热含量的CSEOF分析[J]. 热带海洋学报, 2011, 30(6): 37-46. ] [本文引用:1]
[65] Zhang Z G, Wang W, Qiu B. Oceanic mass transport by mesoscale eddies[J]. Science, 2014, 345(6 194): 322-324. [本文引用:1]
[66] Yang T T, Xu Y S. Estimation of the time series of the meridional heat transport across 15°N in the Pacific ocean from Argo and satellite data[J]. Journal of Geophysical Research: Oceans, 2015, 120(4): 3 043-3 060. [本文引用:1]
[67] Yang G, Yu W D, Yuan Y L, et al. Characteristics, vertical structure, and heat/salt transport of mesoscale eddied in the southeastern tropical Indian ocean[J]. Journal of Geophysical Research: Oceans, 2015, 120(10), doi: DOI:10.1002/2015JC011130. [本文引用:1]
[68] Zheng F, Zhang R H, Zhu J. Effects of interannual salinity variability on the barrier layer in the western central equatorial Pacific: A diagnostic analysis from Argo[J]. Advance in Atmospheric Sciences, 2014, 31(3): 532-542. [本文引用:1]
[69] Zheng F, Zhang R H. Interannually varying salinity effects on ENSO in the tropical Pacific: A diagnostic analysis from Argo[J]. Ocean Dynamic, 2015, 65(5): 691-705. [本文引用:1]
[70] Zheng F, Zhang R H, Zhu J. Effects of interannual salinity variability on the dynamic height in the western equatorial Pacific as diagnosed by Argo[J]. Acta Oceanologica Sinica, 2015, 34(5): 22-28. [本文引用:1]
[71] Du Y, Zhang Y H, Feng M, et al. Decadal trends of the upper ocean salinity in the tropical Indo-Pacific since mid-1990s[J]. Scientific Reports, 2015, 5(16 050), doi: DOI:10.1038/srep16050. [本文引用:1]
[72] Wang Jin, Zhang Jie, Wang Jing. Quality assessment of spaceborne microwave radiometer Aquarius data product based on Argo buoy data[J]. Acta Oceanologica Sinica , 2015, 37(3): 46-53.
[王进, 张杰, 王晶. 基于Argo浮标数据的星载微波辐射计Aquarius数据产品质量评估[J]. 海洋学报, 2015, 37(3): 46-53. ] [本文引用:1]
[73] Yang T T, Chen Z B, He Y J. A new method to retrieve salinity profiles from sea surface salinity by SMOS satellite[J]. Acta Oceanologica Sinica, 2015, 34(9): 85-93. [本文引用:1]
[74] Yi S, Sun W K, Heki K, et al. An increase in the rate of global mean sea level rise since 2010[J]. Geophysical Research Letters, 2015, 42(11): 3 998-4 006. [本文引用:1]
[75] Zhang Xu, Zhang Yonggang, Zhang Shengjun, et al. Distribution and season variability of sound speed profile in Philippine Sea[J]. Journal of Tropical Oceanography, 2009, 28(6): 22-34.
[张旭, 张永刚, 张胜军, . 菲律宾海的声速剖面结构特征及季节性变化[J]. 热带海洋学报, 2009, 28(6): 22-34. ] [本文引用:1]
[76] Zhang Xu, Zhang Yonggang, Zhang Jianxue, et al. EOF analysis of sound speed profiles in sea area east of Taiwan[J]. Advance in Marine Science, 2010, 28(4): 498-506.
[张旭, 张永刚, 张健雪, . 台湾以东海域声速剖面序列的EOF分析[J]. 海洋科学进展, 2010, 28(4): 498-506. ] [本文引用:1]
[77] Sun Chaohui, Xu Jianping, Liu Zenghong, et al. The application of Argo data to water masses analysis in the northwest Pacific ocean[J]. Marine Science Bulletin, 2008, 10(2): 1-13. [本文引用:1]
[78] Liu Zenghong, Xu Jianping, Sun Chaohui, et al. The characteristics of water mass distribution and its seasonal variation near the Luzon Strait[J]. Journal of Tropical Oceanography, 2011, 30(1): 11-19.
[刘增宏, 许建平, 孙朝辉, . 吕宋海峡附近海域水团分布及季节变化特征[J]. 热带海洋学报, 2011, 30(1): 11-19. ] [本文引用:1]
[79] Song Xiangzhou, Lin Xiaopei, Myrtle R P, et al. Spacial structure and annual variation estimated from Argo float data for Subtropical mode water in the Northwest Pacific Ocean[J]. Advance in Marine Science, 2009, 27(1): 1-10.
[宋翔洲, 林霄沛, Myrtle-R P, . 基于Argo浮标资料的西北太平洋模态水的空间结构及年际变化[J]. 海洋科学进展, 2009, 27(1): 1-10. ] [本文引用:1]
[80] Yan Y W, Wang G H, Wang C Z, et al. Low salinity water off west Luzon island in summer[J]. Journal of Geophysical Research: Oceans, 2015, 120, doi: DOI:10.1002/2014JC010465. [本文引用:1]
[81] Zhang Renhe, Liu Yimin, Yin Yonghong, et al. Utilizing Argo data to improve the ocean data assimilation and the relative physical processes in ZC ocean model[J]. Acta Meteorologica Sinca, 2004, 62(5): 613-622.
[张人禾, 刘益民, 殷永红, . 利用Argo资料改进海洋资料同化和海洋模式中的物理过程[J]. 气象学报, 2004, 62(5): 613-622. ] [本文引用:1]
[82] Zhang Renhe, Yin Yonghong, Li Qingquan, et al. Utilizing Argo data to improve the prediction of ENSO and short-term climate prediction of summer rainfall in China[J]. Journal of Applied Meteorological Science, 2006, 17(5): 538-547.
[张人禾, 殷永红, 李清泉, . 利用Argo资料改进ENSO 和我国夏季降水气候预测[J]. 应用气象学报, 2006, 17(5): 538-547. ] [本文引用:1]
[83] Zhang Renhe, Zhu Jiang, Xu Jianping, et al. Argo global ocean data assimilation and its applications in short-term climate prediction and oceanic analysis[J]. Chinese Journal of Atmospheric Sciences, 2013, 37(2): 411-424.
[张人禾, 朱江, 许建平, . Argo 大洋观测资料的同化及其在短期气候预测和海洋分析中的应用[J]. 大气科学, 2013, 37(2): 411-424. ] [本文引用:1]
[84] Liu Yimin, Li Weijing, Zhang Peiqun. A global 4-dimensional ocean data assimilation system and the studies on its results in the tropical Pacific[J]. Acta Oceanologica Sinica, 2005, 27(1): 27-35.
[刘益民, 李维京, 张培群. 国家气候中心全球海洋资料四维同化系统在热带太平洋的结果初步分析[J]. 海洋学报, 2005, 27(1): 27-35. ] [本文引用:1]
[85] Wu Tongwen, Song Lianchun, Liu Xiangwen, et al. Progress in developing the short-range operational climate prediction system of china national climate center[J]. Journal of Applied Meteorological Science, 2013, 24(5): 533-543.
[吴统文, 宋连春, 刘向文, . 国家气候中心短期气候预测模式系统业务化进展[J]. 应用气象学报, 2013, 24(5): 533-543. ] [本文引用:1]
[86] Zhou W, Chen M Y, Zhuang W, et al. Evaluation of the tropical variability from the Beijing Climate Center’s real-time operational Global Ocean Data Assimilation System[J]. Advance in Atmospheric Sciences, 2016, 33(2): 208-220. [本文引用:1]
[87] Zhu Jiang, Zhou Guangqing, Yan Changxiang, et al. The design and preliminary application of a three-dimensional variational ocean data assimilation system[J]. Science in China(Series D), 2007, 37(2): 261-271.
[朱江, 周广庆, 闫长香, . 一个三维变分海洋资料同化系统的设计和初步应用[J]. 中国科学: D辑, 2007, 37(2): 261-271. ] [本文引用:1]
[88] Han Guijun, Li Wei, Zhang Xuefeng, et al. A regional ocean reanalysis system for coastal waters of china and adjacent seas[J]. Advance in Atmospheric Sciences, 2011, 28(3): 682-690. [本文引用:1]
[89] Han G J, Fu H L, Zhang X F, et al. A global ocean reanalysis product in the China Ocean Reanalysis (CORA) project[J]. Advance in Atmospheric Sciences, 2013, 30(6): 1 621-1 631. [本文引用:1]
[90] Zhang Shengmao, Yang Shenglong. The Application of Argo Data in the Tuna Fisheries[M]. Beijing: China Ocean Press, 2014.
[张胜茂, 杨胜龙. Argo剖面数据在远洋金枪鱼渔业中的应用[M]. 北京: 海洋出版社, 2014. ] [本文引用:1]
[91] Yang Shenglong, Jin Shaofei, Hua Chengjun, et al. Spatial-temporal distribution of bigeye tuna Thunnus obseus in the tropical Atlantic Ocean based on Argo data[J]. Chinese Journal of Applied Ecology, 2015, 26(2): 601-608.
[杨胜龙, 靳少非, 化成君, . 基于Argo数据的热带大西洋大眼金枪鱼时空分布[J]. 应用生态学报, 2015, 26(2): 601-608. ] [本文引用:1]
[92] Chen Dake, Xu Jianping, Ma Jirui, et al. Argo global observation network and studies of upper ocean structure, variability, and predictability[J]. Advances in Earth Science, 2008, 23(1): 1-7.
[陈大可, 许建平, 马继瑞, . 全球实时海洋观测网(Argo)与上层海洋结构、变异及预测研究[J]. 地球科学进展, 2008, 23(1): 1-7. ] [本文引用:1]
[93] Stephen C R, Howard J F, Dean R, et al. Fifteen years of ocean observations with the global Argo array[J]. Nature Climate Change, 2016, 6(1): 145-153. [本文引用:2]
[94] Ollitrault M, Rannou J P. ANDRO: An Argo-based deep displacement dataset[J]. Journal of Atmospheric and Oceanic Technology, 2013, 30(4): 759-788. [本文引用:1]
[95] Ollitrault M, De Verdiere C. The ocean general circulation near 1000 m depth[J]. Journal of Physical Oceanography, 2014, 44(1): 384-409. [本文引用:1]
[96] Gray A, Riser S. A global analysis of Sverdrup balance using absolute geostrophic velocities from Argo[J]. Journal of Physical Oceanography, 2014, 44(4): 1 213-1 229. [本文引用:1]
[97] Castelao R. Mesoscale eddies in the South Atlantic Bight and the Gulf Stream recirculation region: Vertical structure[J]. Journal of Geophysical Research, 2014, 119(3): 2 048-2 065. [本文引用:1]
[98] Mercier H, Lherminier P, Sarafanov A, et al. Variability of the meridional overturning circulation at the Greenland -Portugal OVIDE section from 1993 to 2010[J]. Progress in Oceanography, 2015, 132(49): 250-261. [本文引用:1]
[99] Guinehut S, Dhomps A, Larnicol G, et al. High resolution 3-D temperature and salinity fields derived from in situ and satellite observations[J]. Ocean Science Discussion, 2012, 9(2): 845-857. [本文引用:1]
[100] Chang Y, Zhang S, Rosati A, et al. An assessment of oceanic variability for 1960-2010 from the GFDL ensemble coupled data assimilation[J]. Climate Dynamics, 2013, 40(3/4): 775-803. [本文引用:1]
[101] Kwon Y O, Alexand er A M, Bond A N, et al. Role of Gulf Stream, Kuroshio-Oyashio, and their extensions in large-scale atmosphere-ocean interaction: A review[J]. Journal of Climate, 2010, 23(12): 3 249-3 281. [本文引用:1]
[102] Huang Peng, Chen Liqi, Cai Minggang. Progress in anthropogenic carbon estimation, spatial and temporal distribution in the ocean[J]. Advances in Earth Science, 2015, 30(8): 952-959.
[黄鹏, 陈立奇, 蔡明刚. 全球海洋人为碳储量估算及时空分布研究进展[J]. 地球科学进展, 2015, 30(8): 952-959. ] [本文引用:1]
[103] Johnson K S, Berelson M W, Boss E, et al. Observing biogeochemical cycles at global scales with profiling floats and gliders: Prospects for a global array[J]. Oceanography, 2009, 22(3): 216-225. [本文引用:1]
[104] Brasseur P, Gruber R, Barciela R, et al. Integrating biogeochemistry and ecology into ocean data assimilation systems[J]. Oceanography, 2009, 22(3): 206-215. [本文引用:1]
[105] Fukasawa M, Freeland H, Perkin R, et al. Bottom water warming in the North Pacific Ocean[J]. Nature, 2004, 427(6 977): 825-827. [本文引用:1]
[106] Johnson G, Purkey S, Bullister J. Warming and freshening in the abyssal southeastern Indian Ocean[J]. Journal of Climate, 2008, 21(20): 5 351-5 363. [本文引用:1]
[107] Purkey S, Johnson G. Warming of global abyssal and deep Southern Ocean waters between the 1990s and 2000s: Contributions to global heat and sea level rise budgets[J]. Journal of Climate, 2010, 23(23): 6 336-6 353. [本文引用:1]
[108] Purkey S, Johnson G. Antarctic Bottom Water warming and freshening: Contributions to sea level rise, ocean freshwater budgets, and global heat gain[J]. Journal of Climate, 2013, 26(23): 6 105-6 122. [本文引用:1]
[109] Lu Shaolei, Sun Chaohui, Liu Zenghong, et al. Comparative testing and data quality evaluation for COPEX, HM2000 and APEX profiling buoys[J]. Journal of Ocean Technology, 2016, 35(1): 84-92.
[卢少磊, 孙朝辉, 刘增宏, . COPEX和HM200与APEX型剖面浮标比测试验及资料质量评价[J]. 海洋技术学报, 2016, 35(1): 84-92. ] [本文引用:1]