全球典型地区MIS 5e阶段气候特征研究进展
裴巧敏1, 马玉贞1*,*, 胡彩莉1, 李丹丹2, 郭超1, 刘杰瑞1
1.北京师范大学地表过程与资源生态国家重点实验室/环境演变与自然灾害教育部重点实验室,北京 100875
2.北京师范大学 资源学院, 北京 100875
*通信作者:马玉贞(1957-),女,河南太康人,教授,主要从事环境变化研究.E-mail:mayzh@bnu.edu.cn

作者简介:裴巧敏(1991-),女,河北唐山人,硕士研究生,主要从事第四纪环境演变研究.E-mail:pqm@mail.bnu.edu.cn

摘要

深海氧同位素(MIS)5e阶段的环境要素可与现代暖期对比,研究其气候特征和持续时间,有助于更好地理解现代暖期过程和未来气候发展趋势,是第四纪研究的一个重要问题。很多学者开展了相关研究,但对MIS 5e时期气候特征存在不同见解。通过对全球典型地区的35个具有可靠年代和可信代用指标古气候记录综合分析,初步认为:①MIS 5e起止时间为(128±2)~(116±2)ka,该时期全球范围内的气候存在小幅度波动,但对于是否存在冷事件及其变化幅度和起止时间,区域间的差异明显,如北大西洋区海洋气候记录指示MIS 5e阶段气候比较稳定,而挪威海区的气候记录显示MIS 5e早期气候有2个明显的变化,在中期存在一个冷事件;南极洲和格陵兰的δ18O,δD和CH4记录说明两区MIS 5e时期的气候都呈相对稳定状态;欧洲地区Eemian间冰期从南到北持续时间变短,气候波动幅度变大;中国地区MIS 5e气候特征研究分歧较大。②在亚轨道尺度上,MIS 5e时期全球气候具较好的一致性,太阳辐射可能是统一的驱动因子;在千年/百年尺度上,各个地区气候变化存在一定的差异性,可能受区域局地因子的控制。③在全球MIS 5e气候变化的研究中,还有很多方面有待提高,如关于全球性和区域性气候事件的联系、差异和机制问题、代用指标的指代意义及机理和MIS 5e阶段高分辨率的气候变化及古气候模拟研究等。

关键词: MIS 5e; 代用指标; 气候变化; 冷事件
中图分类号:P467 文献标志码:A 文章编号:1001-8166(2016)11-1182-15
Climatic Character of Marine Isotope Stage (MIS) 5e in the Representative Regions of the World: A Review
Pei Qiaomin1, Ma Yuzhen1,*, Hu Caili1, Li Dandan2, Guo Chao1, Liu Jierui1
1.State Key Laboratory of Earth Surface Process and Resource Ecology/Key Laboratory of Environmental Change and Natural Disaster,Ministry of Education,Beijing Normal University,Beijing 100875,China
2.College of Resource Science and Technology, Beijing Normal University, Beijing 100875, China
Corresponding author: Ma Yuzhen(1957-), female, Taikang City, He’nan Province, Professor. Research areas include environmental change.E-mail:mayzh@bnu.edu.cn

First author: Pei Qiaomin(1991-), female, Tangshan City, Hebei Province, Master student. Research areas include environmental Change.E-mail:pqm@mail.bnu.edu.cn

Abstract

The Last Interglacial or Marine Isotope Stage (MIS) 5e, is of great interest because it serves as an analog for the Holocene. The climate change and duration during Marine isotope stage (MIS) 5e are considerably well understood for recent and future climate. Despite great interest in this subject over many years, a number of issues concerning the climate circumstances of MIS 5e are by no means resolved. We analyzed 35 published palaeoclimate records with reliable chronologies and robust proxies in typical region of the world to evaluate climate change during MIS 5e. These data indicate that: ① The duration of this warm phase is thought to range from (128±2) ka to (116±2) ka. The climate of MIS 5e was likely relatively stable with a number of abrupt, weak amplitude, cool and/or arid events. And the difference between regions is noticeable for the occurrence, amplitude, onset and duration of these events. For example, marine records from the North Atlantic indicate that the climate of MIS 5e was relatively stable, however the records from Norwegian sea show that the climate of MIS 5e had a significant changes at the beginning and cold event in the Mid-Eemian; The δ18O, δD and CH4 in the ice cores from Greenland and Antarctica imply that climate was relatively stable during the last interglacial period, while in Europe from the north to the south the duration of this phase became shorter and the intensity of climatic events became stronger. In addition, the climatic conditions of MIS 5e reconstructed by climate proxy from China are various and have the subject of some controversy. ②The global climate response to the insolation forcing would have been uniform on suborbital timescale. Nevertheless, as a result of regional sundry climatic forcing factors, global millennial-scale/century-scale climate oscillations were marked by significant local features during stage 5e. ③ Based on the better chronological controls, the estimation of climate parameters, the high-resolution climate records, and precise knowledge of the phase relationship between climate changes in global, the earlier depiction for climate circumstances and environment change during Marine Isotope Stage 5e should be refined and our understanding of the climate dynamics and mechanism and climate modelling should be improved.

Keyword: Marine oxygen Isotope Stage 5e (MIS 5e); Proxy; Climate change; Cold event.
1 引言

深海氧同位素(Marine Isotope Stage, MIS)5e是深海钻孔氧同位素记录划分出的第5阶段中的第一部分, 狭义上被认为可以代表末次间冰期[1], 相当于欧洲西北部孢粉记录中的Eemian间冰期, 其环境要素可与现代暖期(即全新世)对比[2]。通过对没有人类影响的MIS 5e时期气候变化进行研究[3, 4], 可探讨人类活动对气候变化的影响, 有助于更好地理解现代暖期过程和未来气候发展趋势[5], 因此, 这一时期的气候变化过程及其特征的研究一直是古气候研究中的热点。

众多学者已对冰芯、深海沉积物和陆地的湖泊、黄土等沉积记录开展了大量研究(表1图1), 并取得了显著的成果, 但对于MIS 5e的时间跨度和气候特征仍存在较多分歧。根据SPECMAP时间序列, MIS 5e开始于(128± 3)ka BP, 结束于115 ka BP, 持续时间约为10 ka[47]; 巴哈马群岛有孔虫[48]、欧洲西部年纹层[49]和中国董哥洞石笋[39]记录也一致表明MIS 5e持续了大约10 ka; 来自北大西洋有孔虫、硅藻等生物记录[4, 11, 17, 50]和地中海浮游生物记录[51]也得到了较为一致的年代结果。但是, 一些其他气候记录表明MIS 5e持续的时间可能更长, 例如, 格陵兰GRIP冰芯记录表明MIS 5e的时间为19 ka(133~114 ka BP)[8], 南极洲Vostok[42]和美国Devils Hole[52]的氧同位素(δ 18O, 下同)结果显示MIS 5e持续时间为22 ka, 中国萨拉乌苏河湖相沉积记录了MIS 5e的时间为134.90~114.44 ka BP[34], 长达20 ka。然而, 红海珊瑚礁记录则显示MIS 5e持续时间短于10 ka[53]。综上, 对于MIS 5e的起止和持续时间尚无较为统一的认识, 且中国地区对于MIS 5e的年代研究较少, 有待深入探讨。

表1 选取出的MIS 5e气候研究点 Table 1 Palaeoclimatic records of MIS 5e selected from global

北大西洋MIS 5e气候变化研究中, 有些学者认为MIS 5e的气候是相对稳定的[48, 54, 55], 还有些学者通过对挪威海有孔虫和冰筏碎屑物等记录[19, 21]及布莱克外海岭的孢粉记录[15]研究发现, MIS 5e阶段存在百年尺度的冷事件。欧洲一些孢粉记录显示出该时期气候不稳定, 如欧洲Velay高原低平火山口湖泊[56]和Bispingen湖泊[49]的孢粉记录了Eemian期间的2次冷事件, 并分为5个亚阶段; 欧洲东北部孢粉记录表明Eemian间冰期可分为松属(Pinus)— 栎属(Quercetum)— 混交榛属(Corylus)组合、鹅耳枥属(Carpinus)— 云杉属(Picea)组合及松属— 云杉属— 冷杉属(Abies)组合3个亚阶段[57]; 安纳托利亚北部的植被气候序列也存在由代表干旱大陆性气候的栎属— 刺柏属(Juniperus)组合、温暖湿润的榆属(Ulmus)— 榛— 栎— 鹅耳枥属组合及冷湿的山毛榉(Fagus)— 鹅耳枥属组合组成的3个亚阶段[58]; 但也有一些孢粉记录显示该时期气候呈稳定状态[25, 59]。格陵兰[9, 60]、南极洲[40, 61]的冰芯和中国地区的黄土[31, 32]、石笋[39, 62]等较高分辨率记录的MIS 5e气候变化特征存在较大分歧(图1)。此外, 加拿大布雷顿角岛[63]和育空地区[64], 美国弗罗里达西北部[65]、墨西哥湾北部[66]、杰克逊荷尔南部[67]及科罗拉多地区[68, 69]的年代和孢粉等研究结果虽较为一致表明MIS 5e时期气温明显高于全新世, 但分辨率较低。

基于此, 本文拟通过对全球典型地区MIS 5e气候变化的研究现状进行梳理总结, 了解目前的研究进展, 对比分析不同地区MIS 5e的气候特征及差异, 以期为以后的研究提供参考。

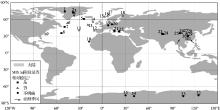
图1 MIS 5e研究点分布图Fig.1 Overview map showing the palaeoclimatic sites selected from global

2 研究方法
2.1 数据筛选

参考前人研究成果, 本文对已发表的MIS 5e气候序列文章进行了筛选。首先研究点的选取原则如下:①具有明确的年代序列, 且沉积年限需达到12万年以上; ②代用指标具代表性、连续性且具有较高分辨率。

其次, 研究剖面的年代测定方法因沉积物不同而异, 其中冰芯主要采用冰川流动模型、年积层厚度模型及逆解法, 深海岩心主要依据年代模型和SPECMAP曲线, 湖泊岩心依靠14C、纹层、铀系等多种测年手段, 而黄土剖面以热释光测年(TL)为主(表1), 考虑到不同沉积介质和测年方法的差异, 本文主要选取目前已被广泛接受的年代数据进行分析和讨论。判别基于以下3点:①沉积序列在MIS 5e时期沉积连续无间断; ②具有明确的年代学方法, 并且沉积序列已校正为日历年龄(ka BP); ③具有较高的年代分辨率(约1 000年)。

最后是代用指标的选择。①大洋岩心和冰芯δ 18O反映了冰蓄积量的改变[70], 记录全球古冰川的变化[1], 且浮游生物δ 18O能反映海面温度变化[14, 71], 底栖δ 18O则反映海底温度变化[14, 19]; 冰芯的氢同位素(δ D, 下同)变化和δ 18O变化几乎一致[1, 43, 61], 都指示温度变化[6, 46, 72], 且δ D可能好于δ 18O[42]; CH4变化也与温度有很强的相关度[61], 可能与其他纬度地区湿地和植被变化相关[73]; 中国石笋δ 18O主要记录了气温变化, 反映亚洲季风强度的起伏波动[38, 39, 62]。这些前人的研究工作表明, δ 18O, δ D和CH4作为古气候重建的代用指标环境指示意义明确, 因此, 本文首选这3个代用指标序列。②孢粉作为古植被直接代用指标和古气候间接代用指标一直被重视[74], 且以往研究表明孢粉组合及木本/非木本花粉(AP/NAP)比值的变化都能较好地反映了气候波动趋势[23, 27], 运用孢粉进行气候重建可以得出最冷月温度和5 ℃温度总值变化[25]以及夏季温度变化[22], 直观体现气候变化特征, 故本文还选择了孢粉代用指标序列。③中国黄土— 古土壤等沉积记录中粒度和磁化率也能较好地反映气候的变化。粗石英颗粒的分布曲线反映风尘通量和冬季风挟沙能力大小[75, 76], > 40 μ m粗颗粒含量变化能较好地指示沙尘运输强度[67]和冬季风的强弱[77], 平均粒径可较好地反映一般大气环流变化情况[31]。磁化率参数与降水量相关[78], 记录成土作用强度, 直接指示夏季风强度变化[32, 79]。另外, 沙漠黄土过渡带中Rb/Sr值反应化学风化的强弱, 也能指示冬季风和夏季风强度变化[80]。故本文也选择了粒度、磁化率和Rb/Sr值代用指标序列。

根据上述原则, 选取了35个研究样点(图1表1)。

2.2 分析方法

由于研究地区和代用指标存在一定的差异, 为了便于分析对比, 首先依据原文作者的论述, 对每个研究点关于MIS 5e气候设定了3种状态:①原文作者认为气候是相对稳定的, 设定为是; ②原文作者认为气候是相对不稳定的, 设定为否; ③原文作者在论文中没有明确指出, 设定为不明确(图1表1), 再根据研究点地域分布特点和气候主要影响因素的不同, 将研究区分为北大西洋区、格陵兰区、南极洲区、欧洲区和中国地区5个典型区。使用区域对比方法进行分析:首先在各个研究点选择具有代表性的指标变化曲线, 从网站下载原始数据, 用Grapher软件绘制曲线, 少数不能下载的, 使用其文献中的曲线清绘。然后使用CorelDRAW绘图软件, 以年代为标尺对各个地区的曲线进行统计汇总, 最后通过分析每个区的曲线波动幅度和变化趋势来判断该时期该区气候的变化规律和区域特点。

3 MIS 5e阶段气候变化特征
3.1 北大西洋区

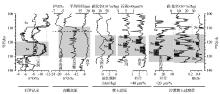
北大西洋地区作为气候变化研究的典型区域受到很多学者的重视, 并已取得丰硕成果[4, 19~22]。根据已有研究结果(图2)和气候影响因素, 将其分为北大西洋区和挪威海区。

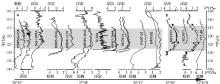
北大西洋众多钻孔的δ 18O曲线显示(图2a), MIS 5e起止时间为127.5~115.2 ka BP, 持续时间12 ka左右。除U1304钻孔的δ 18O曲线指示早期和晚期温度较中期略高外, 其他钻孔的δ 18O曲线表明MIS 5e期间气候虽有一定的起伏波动, 但总体相对稳定。但是, 其他指标的记录却表现出差异性, 例如, MD08-3179钻孔鳞鞭虫分析得出MIS 5e极不稳定, 可划分为P1~P4 4个阶段[17]; MD95-2042钻孔的孢粉分析也划分出4个气候阶段[18]; MD03-2664底栖有孔虫的碳同位素结果则清楚地显示出MIS 5e期间存在多个显著的与冰期千年尺度事件量级相似的百年尺度降温事件[11]。究其原因, 可能是MD95-2042和MD03-2664等钻孔距离陆地较近, 鳞鞭虫和孢粉等指标记录的气候变化情况可能更具区域性特征, 且对环境变化存在一定的放大作用。另外, 各个指标间的关系尚需进一步的研究。总之, 目前的研究显示北大西洋区MIS 5e气候整体上呈稳定状态, 且表现出较明显的区域性特征。

挪威海地区深海底栖和浮游生物的δ 18O变化曲线如图2b所示, MIS 5e始于129 ka BP前后, 结束于约114 ka BP。MIS 5e早期(129~123 ka BP)温度呈上升趋势, 但其中有2次明显的波动, 分别在128和124.5 ka BP左右发生了温度上升过程中的降温事件。124.5~119 ka BP为MIS 5e的高温期, 气候波动幅度较小, 无明显冷事件发生。MIS 5e晚期(119~114 ka BP)温度持续下降。但M23071和M23323钻孔中的冰筏碎屑物和N.pachyderma(s)丰度指标都指示在MIS 5e中期(约120 ka BP)发生了一次百年尺度冷事件[20, 21, 50], 并且挪威海其他钻孔如ENAM93-21和MD95-2009的研究也得出相似结论[13]。这可能因为冰筏碎屑物和N.pachyderma(s)更适合记录寒冷事件[5], 较δ 18O对寒冷气候的响应更加敏感。综合分析, 挪威海区MIS 5e早期气候有明显波动, 中期发生了一次小幅度降温事件, 晚期气温缓慢变冷。

总体上, 整个北大西洋地区MIS 5e气候变化特征可简单归纳为以下几点:①该阶段气候整体表现为, 气温早期快速上升, 中期平稳波动, 晚期缓慢下降; ②随纬度升高, MIS 5e持续时间延长, 气候波动性加强, 可分为挪威海不稳定区和北大西洋稳定区(图2), 挪威海区MIS 5e阶段持续时间约为16 ka, 早期和中期都存在气候波动, 而北大西洋区持续时间约为12 ka, 总体上相对稳定; ③由于海陆分布差异和大洋经向翻转环流以及太阳辐射的影响, 北大西洋区气候变化具明显区域性, 且在不同区域气候波动的发生时间和程度都有所不同。

图2 北大西洋δ 18O曲线图
(a)北大西洋区, (b)挪威海区; 灰色实线代表海洋底栖有孔虫记录; 黑色实线代表海洋浮游有孔虫记录; 灰色矩形框代表MIS 5e年代范围。图中ODP Site 658据参考文献[16]; 1059A据参考文献[15]; MD95-2036据参考文献[14]; MD08-3179据参考文献[17]; MD95-2042据参考文献[18]; U1304据参考文献[81]; MD03-2664据参考文献[11]; M23414据参考文献[5]; NA87-25据参考文献[19]; EW9302据参考文献[10]; M23323据参考文献[20]; M23071据参考文献[21]; V27-60据参考文献[19]
Fig.2 Oxygen isotope records from North Atlantic
(a)δ 18O records from North Atlantic; (b)δ 18O records from Norwegian Sea; Oxygen isotope record of benthic foraminifera (Grey solid lines); Oxygen isotope record of planktonic foraminifera (Dark solid lines); Grey bars indicate the onset and duration of the MIS 5e period. Notes for the sources of references: ODP Site 658 from reference[16]; 1059A from reference[15]; MD95-2036 from reference[14]; MD08-3179 from reference[17]; MD95-2042 from reference[18]; U1304 from reference[81]; MD03-2664 from reference[11]; M23414 from reference[5]; NA87-25 from reference[19]; EW9302 from reference[10]; M23323 from reference[20]; M23071 from reference[21]; V27-60 from reference[19]

3.2 南极洲区

南极洲冰芯的研究更多关注长时间尺度的气候变化, 对MIS 5e的研究相对较少, 但仍有些研究成果值得借鉴。例如, Vostok冰芯的δ 18O研究表明MIS 5e时期明显暖于全新世[43], 比全新世温度高大约2 ℃[42], 而CO2和CH4等指标的研究结果显示在MIS 5e开始大约4 ka之后有一个相对快速的降温事件[61]

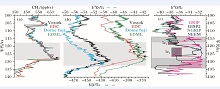
南极洲各个冰芯的CH4指标、Vostok和EDC冰芯的δ D, Dome fuji和EDML冰芯的δ 18O指标曲线变化趋势较为一致, 总体趋势为快速上升, 达到峰值后持续一段时间再缓慢下降(图3)。虽然记录显示其中存在一些变冷事件, 特别是EDML冰芯δ 18O记录了较为明显的变冷事件, 但相对变化较为平缓, 振幅较小[40](图3b)。

图3a显示CH4指标反映的气候特征则有较强的一致性, 除气候变化幅度稍有差别外, 区域差异性不突出。但冰芯δ 18O和δ D记录反映出气候变化具有一定的区域差异性, 主要体现在:①MIS 5e起止时间不同, Dome Fuji冰芯的δ 18O记录显示MIS 5e开始和结束时间最早, 而EDC冰芯的δ D记录则显示其开始和结束时间最晚, 两者开始时间相差大约3 ka, 结束时间相差大约7.5 ka; ②气候最适宜期持续时间不同, 如Dome Fuji冰芯记录反映的气候最适宜期持续时间大约为9.5 ka, 而EDC和EDML冰芯记录的持续时间达到15 ka左右; ③冷事件发生的时间和强度存在差异, Vostok冰芯δ D记录的快速降温事件出现在MIS 5e开始之后约4 ka[61], 晚于南极洲中部冰芯(EDML和Dome Fuji)记录降温事件的发生时间; 而东部EDC冰芯记录反映的冷事件强度较大, 时间较长, 中部EDML冰芯记录显示的较弱(图3b)。另外, 东部湖泊沉积物的硅藻、碳酸钙等多项指标显示MIS 5e时期气候不太稳定, 存在2个明显的温暖阶段(130.7~130 ka BP和125.7~118.2 ka BP)[82]。综上, 初步认为南极洲MIS 5e整体表现稳定, 期间存在较小的波动。

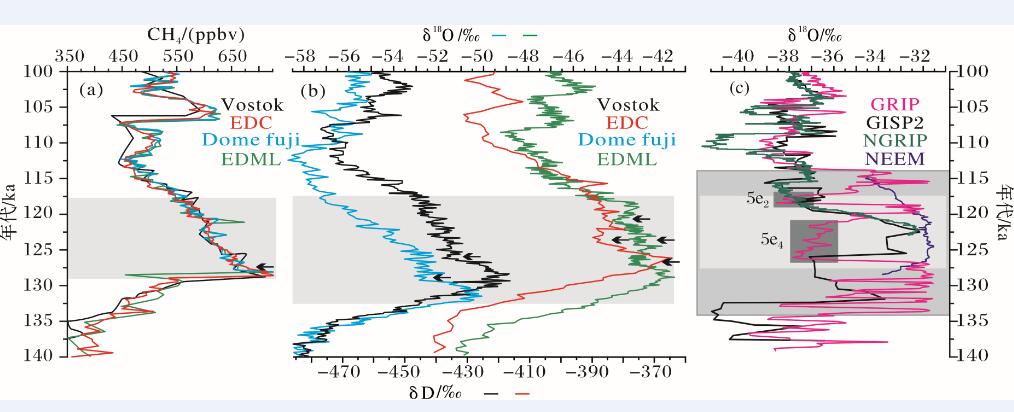
图3 格陵兰与南极洲冰芯δ 18O, δ D和CH4曲线图
灰色区域为划分出的MIS 5e起止时间, (a)为南极洲各冰芯的CH4值, (b)为南极洲各冰芯δ 18O和δ D值, (c)为格陵兰各冰芯δ 18O值; 图中Vostok的δ D和CH4记录据参考文献[61]; EDC的δ D和CH4记录据参考文献[41, 73]; Dome Fuji的δ 18O和CH4记录据参考文献[44, 45]; EDML的δ 18O和CH4记录据参考文献[46]; GRIP的δ 18O记录据参考文献[8]; GISP2的δ 18O记录据参考文献[9]; NGRIP的δ 18O记录据参考文献[7]; NEEM的δ 18O记录据参考文献[6]
Fig.3 Record of δ 18O, δ D and CH4 values from Greenland and Antarctica ice core
Grey bars indicate the onset and duration of the MIS 5e period. (a) CH4 record from Antarctica, (b)δ 18O and δ D records from Antarctica, (c)δ 18O record from Greenland; Vostok δ D and CH4 records from reference[61]; EDC δ D and CH4 records from references[41, 73]; Dome Fuji δ D and CH4 records from references[44, 45]; EDML δ 18O and CH4 records from reference[46]; GRIP δ 18O record from reference[8], GISP2 δ 18O record from reference[9]; NGRIP δ 18O record from reference[7]; NEEM δ 18O record from reference[6]

3.3 格陵兰区

格陵兰冰芯钻孔(GRIP, GISP2, Camp Century, Dye-3, Renland and NorthGRIP)很好地记录了末次冰期和全新世气候变化特征[83], 然而MIS 5e气候特征存在一定的分歧。GRIP冰芯记录MIS 5e的时间段为133.5~114 ka BP, 并划分为5e1, 5e2, 5e3, 5e4和5e5共5个亚阶段, 其中5e2和5e4的寒冷程度与MIS 5a, MIS 5c相当(图3c), 持续时间大约为2和6 ka, 5e1, 5e3和5e5为3个暖阶段, 平均温度比现代暖期大约高2 ℃[8, 63], 而在距GRIP冰芯仅28 km的GISP2冰芯显示, MIS 5e时期气候相对稳定[9], 据此认为GRIP冰芯记录所表现出的波动可能与冰层扰动有关, 而并非气候变化所致。针对这一分歧, 部分研究认为GRIP冰芯记录的气候不稳定不是气候本身特点, 而可能是由于末次冰期或倒数第二个冰期冰层与末次间冰期冰层的混合作用[84], 使得冰芯底部10%成为扰动冰层[85], 以至没能直接准确提取早于110 ka气候信息。而Johnsen等[86, 87]支持GRIP冰芯记录MIS 5e时期气候不稳定的观点, 并在Camp Century冰芯中发现MIS 5e末期存在ES1冷事件, 但没有明显的证据反驳冰芯底部被扰动的观点。2004年, NGRIP冰芯获取了122 ka以来的气候变化序列, 结果显示122~115 ka BP时段气候变化相对平缓, 但缺少122 ka以前的气候信息[47](图3c), 近年来NEEM冰芯则较成功提取了128.5~115 ka BP的气候信息[46], 冰芯δ 18O记录表明, 127~115 ka BP为MIS 5e时期, 气候变化较和缓平稳, 不可否认在5e暖期中存在一些小的变冷事件, 但其寒冷程度远低于MIS 5a和MIS 5c, 故GRIP冰芯底部很可能为扰动层, 其气候信息记录的可靠性有待进一步商榷。

根据GISP2, NGRIP和NEEM未扰动冰芯记录与GRIP冰芯记录对比(图3c)可知, 格陵兰地区MIS 5e中期气候变化可能比较平稳, 其中存在一些小的气温下降事件; MIS 5e末期为气温缓慢下滑期; 由于缺少可靠的冰芯记录, 所以无法准确得出MIS 5e初期的气候变化特征。

3.4 欧洲地区

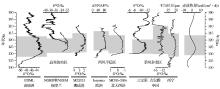
欧洲地区关于MIS 5e时期(Eemian间冰期)的气候变化一直存在分歧, 有研究表明末次间冰期(Eemian)气候相对稳定[59, 88], 还有很多研究认为该阶段气候不稳定[49, 57, 58, 60, 89]。本文主要以孢粉为指标对欧洲地区Eemian间冰期气候变化特征进行分析。

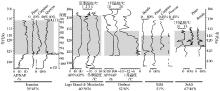
现有孢粉记录显示(图4), 欧洲地区从南到北, Eemian间冰期的结束时间提前, 持续时间逐渐变短。如位于欧洲南部的Ioannina[27]和Lago Grand di Monticchio[25]湖泊沉积记录的Eemian间冰期持续时间分别达到15.5 ka和17.7 ka, 而位于欧洲中部和北部的Grobern, Eifel和Sokli湖泊沉积记录显示Eemian间冰期的持续时间都约为10 ka。Eemian间冰期的气候变化存在较明显的地区差异(图4)。如Lago Grand di Monticchio[25]和Grobern[24]的孢粉记录的AP/NAP值和温度值表明该阶段气候基本稳定; 欧洲中南部Ioannina地区孢粉记录显示在MIS 5e阶段的气候有几次波动, 但是振幅远远小于冰期[27]; 北部Eifel的孢粉指标显示, 在间冰期末期(约118 ka BP)发生了一次持续400多年的风尘事件[23], 而Sokil湖泊的孢粉等指标则记录在120.5 ka BP前后发生了一次持续500~1 000年的冷事件, 且该事件可能与北大西洋海洋循环扰动有关[22]

图4 欧洲孢粉及气候指标曲线图
灰色区域表示MIS 5e时间范围; 图中Ioannina据参考文献[27]; Lago Grand di Monticchio据参考文献[25]; Grobern 据参考文献[24]; Eifel据参考文献[23]; Sokli据参考文献[22]
Fig.4 Pollen records and climate indicators from European
Grey bars indicate the onset and duration of the MIS 5e period. Notes for the sources of references: Ioannina from reference[27]; Lago Grand di Monticchio from reference[25]; Grobern from reference[24]; Eifel from reference[23]; Sokli from reference[22]

此外, 地中海西部浮游生物有孔虫丰度等指标显示MIS 5e被一个冷事件C27划分成2个温暖阶段[13], 阿尔卑斯山脉北部的孢粉记录得出Eemian阶段存在明显的气候恶化, 也被划分为2个相似的温暖阶段[89]

综上, 在纬度和海洋洋流扰动等因素的影响下, 欧洲地区Eemian间冰期从南到北持续时间变短, 气候波动幅度变大; 气候变化存在较明显的地区差异。

3.5 中国

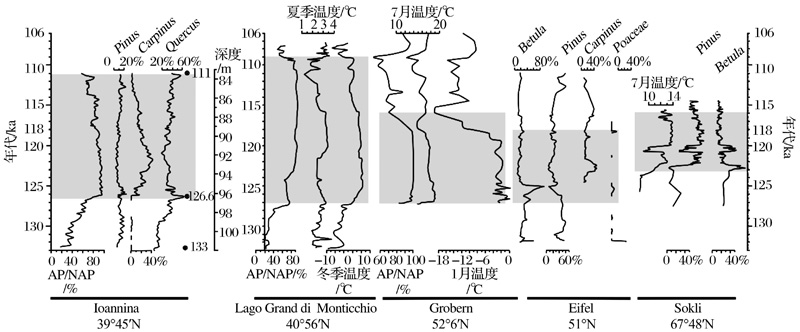
中国东南部董哥洞和三宝洞的131~100 ka BP的石笋记录[38, 39, 62]明显显示出5c, 5d和5e的气候变化特征, 5c阶段的温度高于5e, 且董哥洞的研究结果显示在MIS 5e期间亚洲季风出现较高频率小振幅气候事件[62](图5)。

中国青藏高原古里雅冰芯δ 18O曲线指示, 在131~109 ka BP存在若干百年际冷暖振动[60], 与董哥洞石笋记录[39, 62]在MIS 5e期间亚洲季风较高频率小振幅气候事件相近; 甜水海古湖岩心碳酸盐δ 18O值[29]和西宁盘子山黄土剖面[31]平均粒径曲线显示该期间气候温暖, 比较平缓稳定(图5)。甜水海古湖岩心铁元素[28]、碳酸盐含量[90]及青藏高原边缘甘孜黄土剖面的磁化率、粒度指标[91]分析结果只得出MIS 5e为气候温暖期, 未继续划分。但与古里雅冰芯记录的百年际小振幅冷暖波动不同, 若尔盖盆地的碳酸盐δ 18O[92]和柴达木盆地的自然伽玛曲线[93]研究认为MIS 5e可划分出5e1~5e5 5个亚阶段, 与GRIP冰芯δ 18O记录相类似。值得一提的是, 青藏高原地区的温暖期始于131 ka BP前后, 终于109 ka BP前后, 持续时间约22 ka, 包含了相当于董哥洞和三宝洞的石笋记录的5d和5e的整个时间段, 且与深海δ 18O结论[47]有所不同, 故有待进一步研究。总之, 现有研究表明, 该时期气候确实存在一定的冷暖波动, 但还不能进一步划分出次一级的气候阶段。

中国黄土高原地区关于MIS 5e时期气候变化的研究主要包括2种观点:其一, MIS 5e气候波动比较明显, 并可划分成5个亚阶段(图5)。如九洲台剖面的超顺磁性颗粒分析[32]、洛川和西安剖面的粒度结果[37]都指示MIS 5e期间出现了2次气候事件(图5); 北塬黄土剖面的碳酸盐、磁化率[33, 94]和武都剖面化学元素等多指标[95]也显示MIS 5e时期存在2次明显冷期和3次显著暖期。但结果有待商榷, 比如九洲台剖面磁化率和超顺磁性颗粒变化值较清晰地显示了MIS 5e起止时间, 为130~114 ka BP, 磁化率记录该时段出现了一次冷事件, 而磁性颗粒却记录了2次冷事件; 西安和洛川黄土剖面粒度变化曲线虽然很好地记录了主要风尘事件, 但该指标却没有明确指示出MIS 5e和MIS 5d的变化情况。第二种观点认为MIS 5e气候没有明显变化, 如河西走廊沙沟剖面[96]、塬堡剖面[97]和李家塬剖面[98]及洛川剖面[99]的多指标综合分析结果一致认为MIS 5e气候变化较稳定; 黄土高原多个黄土剖面的粒度、磁化率等指标分析也一致得出MIS 5e(Eemian间冰期)是相对稳定的[77, 100], 三宝洞石笋记录也支持该结论[38]。综上, 黄土高原地区MIS 5e气候变化特征研究分歧较大, 这可能是由于黄土沉积记录除受季风的主要影响外, 还受距离物源远近的影响。所以黄土高原地区MIS 5e高分辨率气候变化特征研究还有待深入。

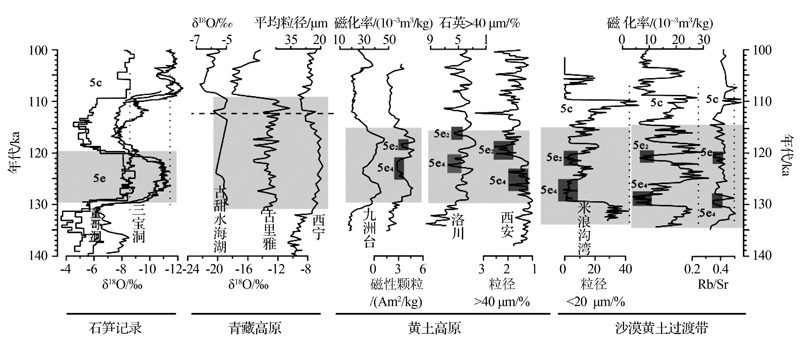
图5 中国地区的气候指标曲线图
灰色区域表示MIS 5e时间范围; 图中董哥洞石笋据参考文献[39]; 三宝洞石笋据参考文献[38]; 甜水海湖岩芯据参考文献[29]; 古里雅冰芯据参考文献[30]; 西宁黄土剖面据参考文献[31]; 九洲台黄土剖面据参考文献[32, 33]; 洛川黄土剖面据参考文献[37]; 西安黄土剖面据参考文献[37]; 米浪沟湾湖泊沉积剖面据参考文献[34]
Fig.5 Climate indicators from China
Grey bars indicate the onset and duration of the MIS 5e period. Notes for the sources of references: Stalagmites of Dongge Cave from reference[39]; Stalagmites of Sanbao Cave from reference[38]; Tianshuihai Lake core from reference[29]; Ice core of Guliya from reference[30]; Xiningloess section from reference[31]; Jiuzhoutai loess section from references[32, 33]; Luochuan loess section from reference[37]; Xi’ an loess section from reference[37]; Milanggouwan lacustrine section from reference[34]

中国沙漠黄土过渡带对气候变化敏感, 是研究晚第四纪环境变化的热点区域。萨拉乌苏流域酒坊台剖面[101]的多种代用指标分析结果及滴哨沟湾剖面[102, 103]和米浪沟湾剖面[36]的磁化率显示出MIS 5e为气候适宜期; 石峁和蔡家沟的风成砂— 黄土— 古土壤剖面记录了MIS 5阶段的沉积是由3层古土壤和2层黄土组成[104, 105], 粒度和磁化率也仅反映出5a~5e 5个亚阶段的冷暖波动[106], 但没有进一步的划分。而近年来, 通过对萨拉乌苏流域米浪沟湾剖面Rb/Sr及高分辨率的磁化率和< 20 μ m粒度分析, 将MIS 5e划分出5e1~5e5 5个亚阶段, 与GRIP冰芯记录一致[34], 且5e2和5e4冷阶段强度达到冰期程度, 5c气候状况好于5e时期(图5), 与全球其他地区的记录分歧较大(图2~4)。关于该争议, 是否与研究点位于季风尾闾区, 对气候变化的敏感度明显高于其他地区有关, 抑或是其他原因还需进一步探讨。

综上得出, 中国地区在MIS 5e期间气候温暖湿润, 为最适宜期。但由于地形的复杂性、记录载体的多样性和代用指标的多变性使得MIS 5e气候变化特征的研究结果呈现多元性, 各个区域不同沉积记录和不同代用指标研究结果存在较大分歧(图5)。中国区MIS 5e气候变化出现上述现象的原因可能是:第一, 亚洲季风(图1)的强度变化直接影响中国区气候湿热状况, 是影响中国区整体性气候变化的主要原因; 第二, 青藏高原大地形影响中国区的区域性气候变化, 由于高海拔作用, 其自身对气候变化更为敏感[30], 形成的高原季风具独特热力条件和动力因素, 对周边地区气候事件有放大作用[31]。由此可知, 在不同地区所受气候的影响因素和影响程度本身存在差异, 所以区域间气候存在不同。第三, 沉积记录分辨率和代用指标代表性是古气候变化研究中重要依据。例如, 青藏高原古里雅冰芯与湖泊记录相比(图5), 显示了更多的气候事件; 黄土剖面磁化率、粒度等不同代用指标分析结果不同, > 40 μ m颗粒[37]值较中值粒径值[31]和磁化率值[33]等指标可能更完善地记录了气候变化特征(图5), 但是指标的代表性和指代意义还需进一步的研究。

4 讨论与展望

本文首先对根据选取原则筛选出已发表的MIS 5e相关文章的代用指标进行了选择; 并根据研究点地域分布和气候主要影响因素的不同, 将研究区分为北大西洋区、南极洲区、格陵兰区、欧洲区和中国地区5个典型区; 然后对每个典型区的代用指标资料进行综合分析, 初步认为:

(1) MIS 5e起止时间为(128± 2)~(116± 2)ka BP, 全球范围内该时期气候存在小幅度波动, 但对于是否存在冷事件及其变化幅度和起止时间在上述5个典型区间差异明显。第一, 北大西洋MIS 5e初期为快速上升期, 中期为平稳波动期, 末期为缓慢下滑期, 北大西洋中纬区海洋气候记录指示MIS 5e阶段气候稳定, 而北部高纬的挪威海气候记录显示MIS 5e阶段的气候在初期有2个明显的变化, 在中期存在一个冷事件; 第二, 格陵兰和南极洲的δ 18O, δ D和CH4记录说明两区MIS 5e时期的气候都呈相对稳定状态; 第三, 欧洲地区Eemian间冰期的气候特征表现为, 从南到北持续时间变短, 气候波动幅度变大; 第四, 中国区的MIS 5e研究结果呈现多元性, 各个区域不同沉积记录和不同代用指标研究结果存在较大分歧。

(2) 赤道热量与赤道太阳辐射变化趋势一致[107], 赤道热量与全球5个区代表性气候变化曲线(图6)对比分析显示, 在亚轨道尺度上, 各区的气候变化与赤道热量具较好的可比性, 说明全球范围内MIS 5e期间的气候可能受统一的驱动因子— — 太阳辐射的控制(图6)。而在千年/百年尺度上, 各个地区气候变化又存在一定的差异性, 可能受区域局地因子的影响, 如北大西洋中纬地区和欧洲大部分地区在西风带的控制下, 气候呈现出较稳定的特征; 格陵兰、南极洲和北大西洋北部挪威海区高纬地区, 环境脆弱较敏感, MIS 5e时期气候变化呈小幅波动; 而中国区受季风控制, 地形多变, 气候变化呈现多元性。

(3) 全球不同地区MIS 5e气候变化的研究中, 还有很多方面有待提高。首先, 格陵兰的冰芯研究需解决冰层是否扰动以及对扰动冰层的研究方法等, 而中国地区黄土等沉积记录的研究需首要解决MIS 5e年代和代用指标指代性及分辨率等问题。其次, 全球范围内MIS 5e期间千年/百年尺度的气候变化存在较大差异, 是否与间冰期的气候条件有关。如整个间冰期温暖湿润、冰量低和冰盖的影响范围较冰期小[21], 导致大气活动频繁, 地形等区域性的气候影响因素作用加大。在以后的研究中可以尝试从气候本身特点探讨气候区域间的差异性。最后, 近些年来我国在有关过去气候变化动力学机制的古气候模拟领域虽已经开展的许多工作[108, 109], 但尚未涉及到MIS 5e阶段, 未来有必要加强。此外, 还需进一步加强对MIS 5e阶段高分辨率的气候变化研究和代用指标的机理研究, 探讨全球性和区域性气候变化的关联性、差异性和机制。

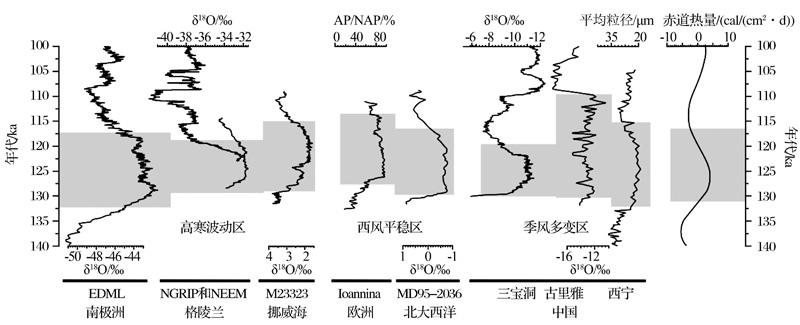
图6 全球记录对比图
灰色区域表示MIS 5e时间范围; 图中EDML的δ 18O记录据参考文献[46]; NGRIP的δ 18O记录据参考文献[7]; NEEM δ 18O记录据参考文献[6]; M23323据参考文献[20]; Ioannina据参考文献[27]; MD95-2036据参考文献[14]; 三宝洞石笋据参考文献[38]; 古里雅冰芯据参考文献[30]; 西宁黄土剖面据参考文献[31]; 赤道热量曲线据参考文献[107]
Fig.6 Palaeoclimatic records of MIS 5e from global
Grey bars indicate the onset and duration of the MIS 5e period. Notes for the sources of references: EDML δ 18O and CH4 records from reference[46]; NGRIP δ 18O record from reference[7]; NEEM δ 18O record from reference[6]; M23323 from reference[20]; Ioannina from reference[27]; MD95-2036 from reference[14]; Stalagmites of Sanbao Cave from reference[38]; Ice core of Guliya from reference[30]; Xining loess section from reference[31]; The caloric equator from reference[107]

The authors have declared that no competing interests exist.

参考文献
[1] Shen Ji. Reconstructing Quaternary Environments[M]. Beijing: Science Press, 2010.
[沈吉. 第四纪环境演变[M]. 北京: 科学出版社, 2010. ] [本文引用:3]
[2] Mangerud J, Sønstegaard E, Sejrup H P. Correlation of the Eemian (interglacial) stage and the deep-sea oxygen-isotope stratigraphy[J]. Nature, 1979, 277(5 693): 189-192. [本文引用:1]
[3] Kopp R E, Simons F J, Mitrovica J X, et al. Probabilistic assessment of sea level during the last interglacial stage[J]. Nature, 2009, 462(7 275): 863-867. [本文引用:1]
[4] Romero O E, Swann G E A, Hodell D A, et al. A highly productive Subarctic Atlantic during the Last Interglacial and the role of diatoms[J]. Geology, 2011, 39(11): 1 015-1 018. [本文引用:3]
[5] Bauch H A, Kand iano E S. Evidence for early warming and cooling in North Atlantic surface waters during the last interglacial[J]. Paleoceanography, 2007, 22(1): 1-11. [本文引用:2]
[6] NEEM Community Members. Eemian interglacial reconstructed from a Greenland folded ice core[J]. Nature, 2013, 493(7 433): 489-494. [本文引用:1]
[7] NGICP members. High-resolution record of Northern Hemisphere climate extending into the last interglacial period[J]. Nature, 2004, 43(7 005): 147-151. [本文引用:1]
[8] Dansgaard W S, Johnsen S J, Clausen H B, et al. Evidence for general instability of past climate from a 250-kyr ice-core record[J]. Nature, 1993, 364(6 434): 218-220. [本文引用:2]
[9] Grootes P M, Stulver M, White J W C, et al. Comparison of oxygen isotope records from the GISP2 and GRIP Greenland Ice cores[J]. Nature, 1993, 366(6 455): 552-554. [本文引用:2]
[10] Oppo D W, Horowitz M, Lehman S J. Marine core evidence for reduced deep water production during Termination Ⅱ followed by a relatively stable substage 5e (Eemian)[J]. Paleoceanography, 1997, 12(1): 51-63. [本文引用:1]
[11] Galaasen E V, Ninnemann U S, Irvali N, et al. Rapid reductions in North Atlantic deep water during the peak of the last interglacial period[J]. Science, 2014, 343(6 175): 1 129-1 132. [本文引用:2]
[12] Irvali N, Ninnemann U S, Galaasen E V, et al. Rapid switches in subpolar North Atlantic hydrography and climate during the last interglacial (MIS 5e)[J]. Paleoceanography, 2012, 27(2): 1-16. [本文引用:1]
[13] Rasmussen T L, Balbon E, Thomsen E, et al. Climate records and changes in deep outflow from the Norwegian Sea~150-55 ka[J]. Terra Nova, 1999, 11(2/3): 61-66. [本文引用:2]
[14] Adkins J F, Boyle E A, Keigwin L, et al. Variability of the North Atlantic thermohaline circulation during the last interglacial period[J]. Nature, 1997, 390(6 656): 154-156. [本文引用:2]
[15] Heusser L, Oppo D. Millennial- and orbital-scale climate variability in southeastern United States and in the subtropical Atlantic during Marine Isotope Stage 5: Evidence from pollen and isotopes in ODP site 1059[J]. Earth and Planetary Science Letters, 2003, 214(3/4): 483-490. [本文引用:1]
[16] Maslin M A, Sarnthein M, Knaack J J. Subtropical Eastern Atlantic climate during the Eemian[J]. Science of Nature, 1996, 83(3): 122-126. [本文引用:1]
[17] Schwab C, Kinkel H, Weinelt M, et al. A coccolithophore based view on paleoenviromental changes in the open ocean mid-latitude North Atlantic between 130 and 48 ka BP with special emphasis on MIS 5e[J]. Quaternary Science Reviews, 2013, 81: 35-47, doi: DOI:10.1016/j.quascirev.2013.09.021. [本文引用:2]
[18] Goñi M F S, Eynaud F, Turon J L, et al. High resolution palynological record off the Iberian margin: Direct land -sea correlation for the last interglacial complex[J]. Earth and Planetary Science Letters, 1999, 171(1): 123-137. [本文引用:1]
[19] Cortijo E, Duplessy J C, Labeyrie L, et al. Eemian cooling in the Norwegian Sea and North Atlantic ocean preceding continental ice-sheet growth[J]. Nature, 1994, 372(6 505): 446-449. [本文引用:3]
[20] Bauch H A, Kand iano E S, Helmke J, et al. Climatic bisection of the last interglacial warm period in the Polar North Atlantic[J]. Quaternary Science Reviews, 2011, 30(15/16): 1 813-1 818. [本文引用:1]
[21] Bauch H A, Erlenkeuser H. A “critical” climatic evaluation of last interglacial (MIS 5e) records from the Norwegian Sea[J]. Polar Research, 2008, 27(2): 135-151. [本文引用:3]
[22] Helmens K F, Salonen J S, Plikk A, et al. Major cooling intersecting peak Eemian Interglacial warmth in northern Europe[J]. Quaternary Science Review, 2015, 122: 293-299, doi: DOI:10.1016/j.quascirev.2015.05.018. [本文引用:3]
[23] Sirocko F, Seelos K, Schaber K, et al. A late Eemian aridity pulse in central Europe during the last glacial inception[J]. Nature, 2005, 436(7 052): 833-836. [本文引用:2]
[24] Kühl N, Litt T, Schölzel C, et al. Eemian and Early Weichselian temperature and precipitation variability in northern Germany[J]. Quaternary Science Review, 2007, 26(25/28): 3 311-3 317. [本文引用:1]
[25] Allen J R M, Huntely B. Last Interglacial palaeovegetation, palaeoenvironments and chronology: A new record from Lago Grand e di Monticchio, southern Italy[J]. Quaternary Science Reviews, 2009, 28(15/16): 1 521-1 538. [本文引用:4]
[26] Tzedakis P C, Frogley M R, Heaton T H E. Duration of last interglacial conditions in Northwestern Greece[J]. Quaternary Research, 2002, 58(1): 53-55. [本文引用:1]
[27] Tzedakis C. Timing and duration of last interglacial conditions in Europe: A chronicle of a changing chronology[J]. Quaternary Science Review, 2003, 22(8/9): 763-768. [本文引用:3]
[28] Yu Suhua, Zhu Zhaoyu, Li Bingyuan, et al. Paleoclimate since 230ka records by iron in the core of Tianshuihai Lake, Tibetan Plateau[J]. Marine Geology and Quaternary Geology, 1998, 18(3): 63-68.
[余素华, 朱照宇, 李炳元, . 23万年以来青藏高原甜水海湖岩心铁元素的气候记录刍议[J]. 海洋地质与第四纪地质, 1998, 18(3): 63-68. ] [本文引用:1]
[29] Zhou H Y, Zhu Z Y. Oxygen isotopic composition of lacustrine carbonates since 130 ka BP from a Tianshuihai Lake core, Tibet: An overall increasing δ18O trend and its implications[J]. Journal of Asian Earth Sciences, 2002, 20(3): 225-229. [本文引用:1]
[30] Yao Tand ong, Thompson L G, Shi Yafeng, et al. Research about climate change since the last interglacial from record in ice core of Guliya[J]. Science in China (Series D), 1997, 27(5): 447-452.
[姚檀栋, Thompson L G, 施雅风, 等. 古里雅冰芯中末次间冰期以来气候变化记录研究[J]. 中国科学: D辑, 1997, 27(5): 447-452. ] [本文引用:1]
[31] Lu H Y, Vand enberghe J, Miao X D, et al. Evidence for an abrupt climatic reversal during the Last Interglacial on the northeast Qinghai-Tibetan Plateau[J]. Quaternary International, 2006, 154/155(5): 136-140. [本文引用:5]
[32] Fang X M, Li J J, Banerjee S K, et al. Millennial-scale climatic change during the last interglacial period: Superparamagnetic sediment proxy from paleosol S1, western Chinese Loess Plateau[J]. Geophysical Research Letters, 1999, 26(16): 2 485-2 488. [本文引用:3]
[33] Fang Xiaomin, Dai Xuerong, Li Jijun, et al. Abruptness and instability of Asian monsoon: An example from soil genesis during the last interglacial[J]. Science in China (Series D), 1996, 26(2): 154-160.
[方小敏, 戴雪荣, 李吉均, . 亚洲季风演化的突发性与不稳定性——以末次间冰期土壤发生为例[J]. 中国科学: D辑, 1996, 26(2): 154-160. ] [本文引用:2]
[34] Du S H, Li B S, Niu D F, et al. Age of the MGS5 segment of the Milanggouwan stratigraphical section and evolution of the desert environment on a kiloyear scale during the last interglacial in China’s Salawusu River Valley: Evidence from Rb and Sr contents and ratios[J]. Chenie der Erde-Geochemistry, 2011, 71(1): 87-95. [本文引用:2]
[35] Du S H, Li B S, Chen M H, et al. Kiloyear-scale climate events and evolution during the last interglacial, Mu Us Desert, China[J]. Quaternary International, 2012, 263(10): 63-70. [本文引用:1]
[36] Li B S, Zhang D D, Wen X H, et al. A Multi-cycle climatic fluctuation record of the Last Interglacial Period: Typical stratigraphic section in the Salawusu River Valley on the Ordos Plateau, China[J]. Acta Geologica Sinica, 2005, 79(3): 398-404. [本文引用:1]
[37] An Z S, Porter S C. Millennial-scale climatic oscillations during the last interglaciation in central China[J]. Geology, 1997, 25(7): 603-606. [本文引用:2]
[38] Wang Y J, Cheng H, Edwards R L, et al. Millennial- and orbital-scale changes in the East Asian monsoon over the past 224, 000 years[J]. Nature, 2008, 451(7 182): 1 090-1 093. [本文引用:3]
[39] Yuan D X, Cheng H, Edwards R L, et al. Timing, duration, and transitions of the last interglacial Asian Monsoon[J]. Science, 2004, 304(5 670): 575-578. [本文引用:5]
[40] Orombelli G, Maggi V, Delmonte B, et al. Quaternary stratigraphy and ice core[J]. Quaternary International, 2010, 219(1/2): 55-65. [本文引用:2]
[41] EPICA Community Members. Eight glacial cycles from an Antarctic ice core[J]. Nature, 2004, 429(6 992): 623-628. [本文引用:1]
[42] Jouzel J, Lorius C, Petit J R, et al. Vostok ice core: A continuous isotope temperature record over the last climatic cycle (160, 000 years)[J]. Nature, 1987, 329(6 138): 403-408. [本文引用:3]
[43] Lorius C, Jouzel J, Ritz C, et al. A 150, 000-year climatic record from Antarctic ice[J]. Nature, 1985, 316(6 029): 591-596. [本文引用:2]
[44] Kawamura K, Parrenin F, Lisiecki L, et al. Northern Hemisphere forcing of climatic cycles in Antarctica over the past 360, 000 years[J]. Nature, 2007, 448(7 156): 912-917. [本文引用:1]
[45] Watanabe O, Jouzel J, Johnsen S, et al. Homogeneous climate variability across East Antarctica over the past three glacial cycles[J]. Nature, 2003, 422(6 931): 509-512. [本文引用:1]
[46] EPICA Community Members. One-to-one coupling of glacial climate variability in Greenland and Antarctica[J]. Nature, 2006, 444(7 116): 195-198. [本文引用:2]
[47] Imbrie J, McIntyre A, Mix A. Oceanic response to orbital forcing in the late Quaternary: Observational and experimental strategies[M]∥Berger A, et al, eds. Climate and Geo-sciences. Boston: Kluwer Academic Publishers, 1989: 121-164. [本文引用:3]
[48] Keigwin L D, Curry W B, Lehman S J, et al. The role of the deep ocean in North Atlantic climate change between 70 and 130 kyr ago[J]. Nature, 1994, 371(6 495): 323-326. [本文引用:2]
[49] Field M H, Huntley B, Müller H. Eemian climate fluctuations observed in a European pollen record[J]. Nature, 1994, 371(6 500): 779-783, doi: DOI:10.1038/371779a0. [本文引用:3]
[50] Nieuwenhove N V, Bauch H A, Eynaud F, et al. Evidence for delayed poleward expansion of North Atlantic surface waters during the last interglacial (MIS 5e)[J]. Quaternary Science Reviews, 2011, 30(7/8): 934-946. [本文引用:2]
[51] Kand iano E S, Bauch H A, Fahl K. Last interglacial surface water structure in the western Mediterranean (Balearic) Sea: Climatic variability and link between low and high latitudes[J]. Global and Planetary Change, 2014, 123: 67-76, doi: DOI:10.106/j.gloplacha.2014.10.004. [本文引用:1]
[52] Winograd I J, Land wehr J M, Ludwig K R, et al. Duration and structure of the past four interglaciations[J]. Quaternary Research, 1997, 48(2): 141-154. [本文引用:1]
[53] Rohling E J, Grant K, Hemleben C, et al. High rates of sea-level rise during the last interglacial period[J]. Nature Geoscience, 2008, 1: 38-42, doi: DOI:10.1038/ngeo.2007.28. [本文引用:1]
[54] Oppo D W, Keigwin L D, McManus J F, et al. Persistent suborbital climate variability in marine isotope stage 5 and Termination Ⅱ[J]. Paleoceanography, 2001, 16(3): 280-292. [本文引用:1]
[55] McManus J F, Oppo D W, Keigwin L D, et al. Thermohaline circulation and prolonged Interglacial warmth in the North Atlantic[J]. Quaternary Research, 2002, 58(1): 17-21. [本文引用:1]
[56] Thouveny N, Beaulieu J L D, Bonifay E, et al. Climate variations in Europe over the past 140 kyr deduced from rock magnetism[J]. Nature, 1994, 371(6 497): 503-506. [本文引用:1]
[57] Aalbersberg G, Litt T. Multiproxy climate reconstructions for the Eemian and Early Weichselian[J]. Journal of Quaternary Science, 1998, 13(5): 367-390. [本文引用:2]
[58] Shumilovskikh L S, Arz H W, Wegwerth A, et al. Vegetation and environmental changes in Northern Anatolia between 134 and 119 ka recorded in Black Sea sediments[J]. Quaternary Research, 2013, 80(3): 349-360. [本文引用:2]
[59] Litt T, Junge F W, Böttger T. Climate during the Eemian in north-central Europe—A critical review of the palaeobotanical and stable isotope data from central Germany[J]. Vegetation History and Archaeobotany, 1996, 5(3): 247-256. [本文引用:2]
[60] GRIP Members. Climate instability during the last interglacial period recorded in the GRIP ice core[J]. Nature, 1993, 364(6 434): 203-207. [本文引用:3]
[61] Petit J R, Jouzel J, Raynaud D, et al. Climate and atmospheric history of the past 420, 000 years from the Vostok ice core, Antarctica[J]. Nature, 1999, 399(6 735): 429-436. [本文引用:5]
[62] Kelly M J, Edwards R L, Cheng H, et al. High resolution characterization of the Asian Monsoon between 146, 000 and 99, 000 years B. P. from Dongge Cave, China and global correlation of events surrounding Termination Ⅱ[J]. Palaeogeography, Palaeoclimatology, Palaeoeocology, 2006, 236(1): 20-38. [本文引用:5]
[63] Fréchette B, Vernal A D. Evidence for large-amplitude biome and climate changes in Atlantic Canada during the last interglacial and mid-Wisconsinan periods[J]. Quaternary Research, 2013, 79(2): 242-255. [本文引用:2]
[64] Jensen B J L, Reyes A V, Froese D G, et al. The Palisades is a key reference site for the middle Pleistocene of eastern Beringia: New evidence from paleomagnetics and regional tephrostratigraphy[J]. Quaternary Science Reviews, 2013, 63(3): 91-108. [本文引用:1]
[65] Burdette K E, Rink W J, López G I, et al. Geological investigation and optical dating of Quaternary siliciclastic sediments near Apalachicola, North-west Florida, USA[J]. Sedimentology, 2012, 59(6): 1 836-1 849. [本文引用:1]
[66] Otvos E G. Numerical chronology of Pleistocene coastal plain and valley development; extensive aggradation during glacial low sea-levels[J]. Quaternary International, 2005, 135(1): 91-113. [本文引用:1]
[67] Pierce K L, Muhs D R, Fosberg M A, et al. A loess-paleosol record of climate and glacial history over the past two glacial-interglacial cycles (~150 ka), southern Jackson Hole, Wyoming[J]. Quaternary Research, 2011, 76(1): 119-141. [本文引用:2]
[68] Miller L M, Pigati J S, Anderson R S, et al. Summary of the Snowmastodon Project Special Volume: A high-elevation, multi-proxy biotic and environmental record of MIS 6-4 from the Ziegler Reservoir fossil site, Snowmass Village, Colorado, USA[J]. Quaternary Research, 2014, 82(3): 618-634. [本文引用:1]
[69] Elias S A. Environmental interpretation of fossil insect assemblages from MIS 5 at Ziegler Reservoir, Snowmass Village, Colorado[J]. Quaternary Research, 2014, 82(3): 592-603. [本文引用:1]
[70] Willians D F, Thumell R C, Tappa E, et al. Chronology of the Pleistocene oxygen isotope record: 0-1. 88 million years before present[J]. Palaeogeography, Palaeoclimatology, Palaeoecology, 1988, 64(3/4): 221-240. [本文引用:1]
[71] Rasmussen T L, Thomsen E, Kuijpers A, et al. Late warming and early cooling of the sea surface in the Nordic seas during MIS 5e (Eemian Interglacial)[J]. Quaternary Science Review, 2003, 22(8/9): 809-821. [本文引用:1]
[72] Johnsen S J, Clausen H B, Dansgaard W, et al. Irregular glacial interstadials recorded in a new Greenland ice core[J]. Nature, 1992, 359(6 393): 311-313. [本文引用:1]
[73] Loulergue L, Schilt A, Spahni R, et al. Orbital and millennial-scale features of atmospheric CH4 over the past 800, 000 years[J]. Nature, 2008, 453(7 193): 383-386. [本文引用:1]
[74] Song Changqing, Sun Xiangjun. Advances in studies of Quaternary palynology in China[J]. Advances in Earth Science, 1999, 4(14): 401-406.
[宋长青, 孙湘君. 中国第四纪孢粉学研究进展[J]. 地球科学进展, 1999, 4(14): 401-406. ] [本文引用:1]
[75] Xiao J L, Porter S C, An Z S, et al. Grain size of quartz as an indicator of winter monsoon strength on the Loess Plateau of Central China during the Last 130, 000 yr[J]. Quaternary Research, 1995, 43(1): 22-29. [本文引用:1]
[76] Porter S C, An Z S. Correlation between climate events in the North Atlantic and China during the last glaciation[J]. Nature, 1995, 375(6 529): 305-308. [本文引用:1]
[77] Chen F H, Qiang M R, Feng Z D, et al. Stable East Asian monsoon climate during the last interglacial (Eemian) indicated by paleosol S1 in the western part of the Chinese Loess Plateau[J]. Global and Planetary Change, 2003, 36(3): 171-179. [本文引用:2]
[78] An Zhisheng, Porter S, Kukla G, et al. Magnetic susceptibility evidence of monsoon variations on the loess Plateau of Central China during the last 130 000 years[J]. Chinese Science Bulletin, 1990, 35(7): 529-532.
[安芷生, Porter S, Kukla G, . 最近13万年黄土高原季风变迁的磁化率证据[J]. 科学通报, 1990, 35(7): 529-532. ] [本文引用:1]
[79] An Z S, Kukla G J, Porter S C, et al. Magnetic susceptibility evidence of monsoon variation on the Loess Plateau of central China during the last 130, 000 years[J]. Quaternary Research, 1991, 36(1): 29-36. [本文引用:1]
[80] Pang Jiangli, Huang Chunchang, Zhang Zhanping. Rb、Sr elements and high resolution climatic records in the Loess-Paleosol profile at Qishan, Shannxi[J]. Acta Sedimentologica Sinica, 2001, 19(4): 637-641.
[庞奖励, 黄春长, 张占平. 陕西岐山黄土剖面Rb、Sr组成与高分辨率气候变化[J]. 沉积学报, 2001, 19(4): 637-641. [本文引用:1]
[81] Hodell D A, Minth E K, Curtis J H, et al. Surface and deep-water hydrography on Gardar Drift (Iceland Basin) during the last interglacial period[J]. Earth and Planetary Science Letters, 2009, 288(1): 10-19. [本文引用:1]
[82] Hodgson D A, Verleyen E, Squier A H, et al. Interglacial environments of coastal east Antarctica: Comparison of MIS 1(Holocene) and MIS 5e (last interglacial) lake-sediment records[J]. Quaternary Science Review, 2006, 25(1/2): 179-197. [本文引用:1]
[83] Johnsen S J, Dahl-Jensen D, Gundestrup N, et al. Oxygen isotope and palaeotemperature records from six Greenland ice-core stations: Camp century, Dye-3, GRIP, GISP2, Renland and NorthGRIP[J]. Journal of Quaternary Science, 2001, 16(4): 299-307. [本文引用:1]
[84] Chappellaz J, Brook E, Blunier T, et al. CH4 and δ18O of O2 records from Antarctic and Greenland ice: A clue for stratigraphic disturbance in the bottom part of the Greenland Ice Core Project and the Greenland Ice Sheet Project 2 ice cores[J]. Journal of Geophysical Research, 1997, 102(C12): 26 547-26 557. [本文引用:1]
[85] Land ais A, Chappellaz J, Delmotte M F, et al. A tentative reconstruction of the last interglacial and glacial inception in Greenland based on new gas measurements in the Greenland Ice Core Project (GRIP) ice core[J]. Journal of Geophysical Research, 2003, 108(18): 1 399-1 407. [本文引用:1]
[86] Johnsen S J, Clausen H B, Dansgaard W, et al. The Eem stable isotope record along the GRIP ice core and its interpretation[J]. Quaternary Research, 1995, 43(2): 117-124. [本文引用:1]
[87] Johnsen S J, Clausen H B, Dansgaard W, et al. The δ18O record along the Greenland Ice Core Project deep ice core and the problem of possible Eemian climatic instability[J]. Journal of Geophysical Research, 1997, 102(C12): 26 397-26 410. [本文引用:1]
[88] Zagwijn W H. An analysis of Eemian climate in western and central Europe[J]. Quaternary Science Review, 1996, 15(5/6): 451-469. [本文引用:1]
[89] Klotz S, Guiot J, Mosbrugger V. Continental European Eemian and early Würmian climate evolution: Comparing signals using different quantitative reconstruction approaches based on pollen[J]. Global and Planetary Change, 2003, 36(4): 277-294. [本文引用:2]
[90] Li Shijie, Qu Rongkang, Zhu Zhaoyu, et al. A carbonate content record of late Quaternary climate and environment changes from Lacustrine Core TS95 in Tianshuihai Lake Basin, Northwestern Qinghai-Xizang (Tibet) Plateau[J]. Journal of Lake Sciences, 1998, 10(2): 58-65.
[李世杰, 区荣康, 朱照宇, . 24万年来西昆仑山甜水海湖岩芯碳酸盐含量变化与气候环境演化[J]. 湖泊科学, 1998, 10(2): 58-65. ] [本文引用:1]
[91] Pan Baotian, Wang Jianmin. Loess record of Qinghai-Xizang Plateau monsoon variations in the eastern part of the plateau since the last interglacial[J]. Quaternary Sciences, 1999, 19(4): 330-335.
[潘保田, 王建民. 末次间冰期以来青藏高原东部季风演化的黄土沉积记录[J]. 第四纪研究, 1999, 19(4): 330-335. ] [本文引用:1]
[92] Wu Jinglu, Wang Sumin, Pan Hongxi, et al. Climatic variations in the past 140 ka recorded in core RM, east Qinghai-Xizang Plateau[J]. Science in China (Series D), 1997, 27(3): 255-259.
[吴敬禄, 王苏民, 潘红玺, . 青藏高原东部RM 孔140 ka 以来湖泊碳酸盐同位素记录的古气候特征[J]. 中国科学: D辑, 1997, 27(3): 255-259. ] [本文引用:1]
[93] Yuan Linwang, Chen Ye, Zhou Chunlin, et al. Correlation of environmental and climate change between Qaidam Basin Gamma Ray Logging Curve and Guliya Ice Core δ18O record since the last interglacial cycle[J]. Journal of Glaciology and Geocryology, 2000, 22(4): 327-332.
[袁林旺, 陈晔, 周春林, . 柴达木盆地自然伽玛曲线与古里雅冰芯记录的末次间冰期以来气候环境变化过程的对比[J]. 冰川冻土, 2000, 22(4): 327-332. ] [本文引用:1]
[94] Guang Donghong, Xi Xiaoxia, Hao Yongping, et al. Climate instability revealed in the Beiyuan CaCO3 record during the last interglacial age[J]. Journal of Glaciology and Geocryology, 1996, 18(2): 119-124.
[管东红, 奚晓霞, 郝永萍, . 北塬剖面碳酸钙记录的末次间冰期气候不稳定性[J]. 冰川冻土, 1996, 18(2): 119-124. ] [本文引用:1]
[95] Zhang Hucai, Shi Zhengtao, Dai Xuerong. The climate records of deep sea oxygen isotope stage 5: A detailed correlation between Wudu Loess Ice Cores from Polar Glacier and Deep Sea[J]. Journal of Lanzhou University (Natural Sciences), 1997, 33(4): 107-115.
[张虎才, 史正涛, 戴雪荣. 深海氧同位素第5阶段的气候记录: 武都黄土剖面与极地冰心、深海沉积同位素记录的对比[J]. 兰州大学学报: 自然科学版, 1997, 33(4): 107-115. ] [本文引用:1]
[96] Wu G J, Pan B T, Guang Q Y, et al. Loess record of climatic changes during MIS 5 in the Hexi Corridor, northwest China[J]. Quaternary International, 2002, 97/98(3): 167-172. [本文引用:1]
[97] Cao Jixiu, Zhang Yutian, Wang Jianmin, et al. Temporal and spatial characteristics of loess magnetic susceptibility in the Yuanbao Loess Section and the climatic change over the past 150 000 years[J]. Journal of Lanzhou University (Natural Sciences), 1997, 33(1): 124-132.
[曹继秀, 张宇田, 王建民, . 塬堡黄土剖面15万年以来磁化率气候记录及黄土磁化率时空特征[J]. 兰州大学学报: 自然科学版, 1997, 33(1): 124-132. ] [本文引用:1]
[98] Ding Z L, Ren J Z, Yang S L, et al. Climate instability during the penultimate glaciation: Evidence from two high-resolution loess records, China[J]. Journal of Geophysical Research, 1999, 104(B9): 20 123-20 132. [本文引用:1]
[99] Cai M T, Wei M J, Xu D N, et al. Vegetation and climate changes during three interglacial periods represented in the Luochuan loess-paleosol section, on the Chinese Loess Plateau[J]. Quaternary International, 2013, 296(439): 131-140. [本文引用:1]
[100] Feng Z D, Wang H B, Olson C, et al. Chronological discord between the last interglacial paleosol (S1) and its parent material in the Chinese Loess Plateau[J]. Quaternary International, 2004, 117(1): 17-26. [本文引用:1]
[101] Yang Jinsong. Records on Paleoenvironment in the Downstream of Salawusu River Valley since 150 ka BP[D]. Beijing: Chinese Academy of Geological, 2013.
[杨劲松. 萨拉乌苏河流域下游150ka BP 以来的古环境记录[D]. 北京: 中国地质科学院, 2013. ] [本文引用:1]
[102] Jin Heling, Li Mingqi, Su Zhizhu, et al. Climatic change reflected by stratigraphical magnetic susceptibility in Salawusu River Basin, North China since 220 ka BP[J]. Journal of Desert Research, 2006, 26(5): 681-687.
[靳鹤龄, 李明启, 苏志珠, . 220ka以来萨拉乌苏河流域地层磁化率与气候变化[J]. 中国沙漠, 2006, 26(5): 681-687. ] [本文引用:1]
[103] Jin Heling, Li Mingqi, Su Zhizhu, et al. Geochemical features of a profile in Salawusu River Valley and their response to global climate changes since 220ka BP[J]. Journal of Glaciology and Geocryology, 2005, 27(6): 861-868.
[靳鹤龄, 李明启, 苏志珠, . 220ka BP来萨拉乌苏河流域地质剖面地球化学特征及其对全球气候变化的响应[J]. 冰川冻土, 2005, 27(6): 861-868. ] [本文引用:1]
[104] Sun Jimin, Liu Dongsheng, Yuan Baoyin, et al. Stratigraphic division of the Sala US formation and the inferred sedimentary environment[J]. Marine Geology and Quaternary Geology, 1996, (1): 23-31.
[孙继敏, 丁仲礼, 袁宝印, . 再论萨拉乌苏组的地层划分及其沉积环境[J]. 海洋地质与第四纪地质, 1996, (1): 23-31. ] [本文引用:1]
[105] Sun Jimin, Liu Dongsheng, Ding Zhongli, et al. The MU US desert evolution in the last 0. 5 Ma[J]. Quaternary Sciences, 1996, (4): 359-367.
[孙继敏, 刘东生, 丁仲礼, . 五十万年来毛乌素沙漠的变迁[J]. 第四纪研究, 1996, (4): 359-367. ] [本文引用:1]
[106] Sun J M, Ding Z L. Deposits and soils of the past 130, 000 years at the desert-loess transition in Northern China[J]. Quaternary Research, 1998, 50(2): 148-156. [本文引用:1]
[107] Berger André L. Long-term variations of caloric insolation resulting from the earth’s orbital elements[J]. Quaternary Research, 1978, 9(2): 139-167. [本文引用:1]
[108] Jiang D B, Yu G, Zhao P, et al. Paleoclimate modeling in China: A review[J]. Advances in Atmospheric Sciences, 2015, 32(2): 250-275. [本文引用:1]
[109] Jin Liyan, Chen Fahu. Progress in rapid climate changes and their modeling study in millennial-and Centennial scales[J]. Advances in Earth Science, 2007, 22(10): 1 054-1 065.
[靳立亚, 陈发虎. 千百年尺度气候快速变化及其数值模拟研究进展[J]. 地球科学进展, 2007, 22(10): 1 054-1 065. ] [本文引用:1]