崔月菊, 李静, 王燕艳, 刘永梅, 陈志, 杜建国. 遥感气体探测技术在地震监测中的应用. 30(2): 284-294 Cui Yueju, Li Jing, Wang Yanyan, Liu Yongmei, Chen Zhi, Du Jianguo. Application of Gas Remote Sensing Technique in Earthquake Monitoring. Advances in Earth Science, 30(2): 284-294
Application of Gas Remote Sensing Technique in Earthquake Monitoring
Cui Yueju1, Li Jing2, Wang Yanyan3, Liu Yongmei4, Chen Zhi1, Du Jianguo1
1. CEA Key Laboratory of Earthquake Prediction (Institute of Earthquake Science, China Earthquake Administration, Beijing 100036, China
2 .Department of Seismology, Institute of Disaster Prevention, Yanjiao 065201, China
3. Pingliang Seismic Station, Gansu Bureau of Seismology, Pingliang 744000, China
4. Xishanzui Seismological Station, Inner Mongolia Bureau of Seismology, Bayannaoer City 014400, China
Abstract
The principle of satellite hyperspectral remote sensing technique for atmosphere detection, development of the satellite atmospheric infrared sensors and the retrieval method of gaseous components with hyperspectral remote sensing data were briefly reviewed. The application of hyperspectral remote sensing gas-geochemistry in earthquake monitoring was emphasized, which can be divided into two aspects: ①Degassing from the seismic fracture zone was indirectly retrieved with the thermal infrared sensor; ②Gas-geochemical anomaly associated with the earthquake was directly detected by the atmospheric gas sensors. Gas-geochemical anomalies were obtained by correlating the physical and chemical anomalies caused by gas emission from the underground with the seismic activities. The possible mechanism of anomalies was discussed by analyzing the gas-geochemical anomalies related to the typical earthquake cases. Additionally, the developing aspects in seismic remote-sensing for gas-geochemistry were proposed.
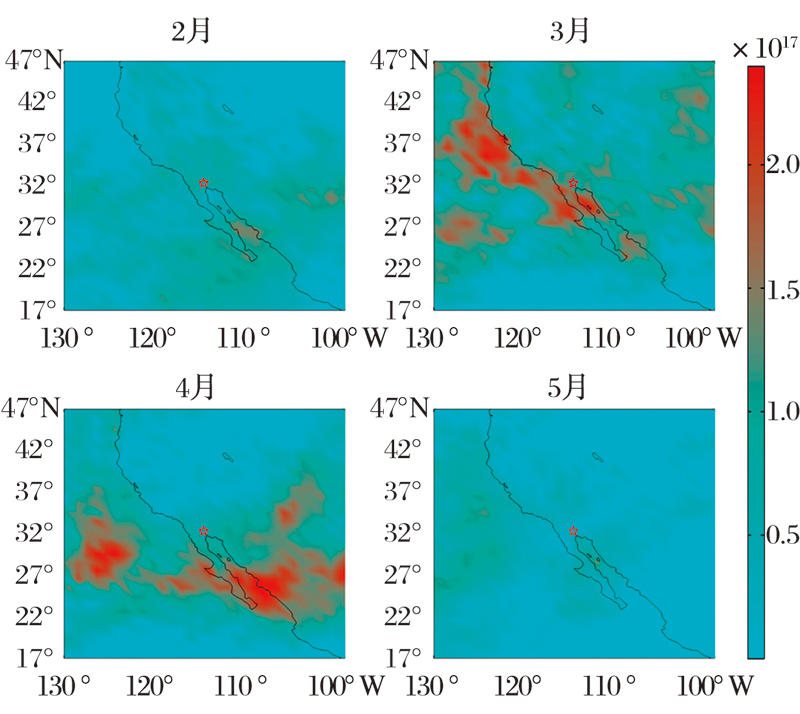
图2 墨西哥下加利福尼亚地震前后2~5月CO总量与背景值的差值分布图(单位:mole/cm2)[95]Fig.2 Distributions of the differences between CO total columns in monthly from February to May 2010 and the corresponding background values(unit: mole/cm2)
表2
Table 2
表2(Table 2)
表2 遥感气体探测技术监测的地震异常特征Table 2 Gas anomaly characters associated with earthquakes by remote sensors
Latchman JL, Morgan F D O, Aspinall W P. Temporal changes in the cumulative piecewise gradient of a variant of the Gutenberg-Richter relationship, and the imminence of extreme events[J]. Earth-Science Reviews, 2008, 87(3/4): 94-112. [本文引用:1][JCR: 7.339]
[2]
MignanA. Non-Critical Precursory Accelerating Seismicity Theory (NC PAST) and limits of the power-law fit methodology[J]. Tectonophysics, 2008, 452(1/4): 42-50. [本文引用:1][JCR: 2.684]
[3]
CuiZijian, LiZhixiong, ChenZhangli, et al. A study on the new method for determining small earthquake sequence type—Correlation analysis of spectral amplitude[J]. Chinese Journal of Geophysics, 2012, 55(5): 1718-1724. [崔子健, 李志雄, 陈章立, 等. 判别小震群序列类型的新方法研究——谱振幅相关分析法[J]. 地球物理学报, 2012, 55(5): 1718-1724. ][本文引用:1]
[4]
VallianatosF, TriantisD, TzanisA, et al. Electric earthquake precursors: From laboratory results to field observations[J]. Physics and Chemistry of the Earth, 2004, 29(4/9): 339-351. [本文引用:1][JCR: 1.037]
[5]
Papazachos CB, Karakaisis GF, Scordilis EM, et al. Global observational properties of the critical earthquake model[J]. Bulletin of the Seismological Society of America, 2005, 95(5): 1 841-1 855. [本文引用:1][JCR: 1.94]
[6]
TheoharatosC, IfantisA, Laskaris NA, et al. Charting of geoelectric potential signal dynamics via geometrical techniques and its possible relation to significant earthquakes in Western Greece[J]. Computers and Geosciences, 2008, 34(6): 625-634. [本文引用:1][JCR: 1.834]
[7]
OndohT. Investigation of precursory phenomena in the ionosphere, atmosphere and groundwater before large earthquakes of M>6. 5[J]. Advances in Space Research, 2009, 43(2): 214-223. [本文引用:1][JCR: 1.183]
[8]
Reddy DV, NagabhushanamP. Groundwater electrical conductivity and soil radon gas monitoring for earthquake precursory studies in Koyna, India[J]. Applied Geochemistry, 2011, 26(5): 731-737. [本文引用:1][JCR: 1.708]
[9]
King CY. Gas geochemistry applied to earthquake prediction: An overview[J]. Journal of Geophysical Research, 1986, 91(B12): 12269-12281. [本文引用:3]
[10]
King CY, ZhangW, Zhang ZC. Earthquake-induced groundwater and gas changes[J]. Pure and Applied Geophysics, 2006, 163(4): 633-645. [本文引用:1][JCR: 1.617]
[11]
ZhangWei, WangJiyi, E Xiuman. Principles and Methods of Hydrogeochemical Prediction for Earthquakes[M]. Beijing: Education Press, 1988. [张炜, 王吉易, 鄂秀满. 水文地球化学预报地震的原理与方法[M]. 北京: 教育出版社, 1988. ][本文引用:1]
[12]
WakitaH, NakamuraY, SanoY. Short-term and intermediate-term geochemical precursors[J]. Pure and Applied Geophysics, 1988, 125(2/4): 267-278. [本文引用:1][JCR: 1.617]
[13]
DuJ, SiX, ChenY, et al. Geochemical anomalies connected with great earthquakes in China[C]∥Stefánsson O, ed. Geochemistry Research Advances. New York: Nova Science Publishers, 2008: 57-92. [本文引用:1]
[14]
DuJ, AmidaK, OhsawaS, et al. Experimental evidence on imminent and short-term hydrochemical precursors for earthquake[J]. Applied Geochemistry, 2010, 25(4): 586-592. [本文引用:1][JCR: 1.708]
[15]
ZhangJ, GaoR, ZengL, et al. Relationship between characteristics of gravity and magnetic anomalies and the earthquakes in the Longmenshan range and adjacent areas[J]. Tectonophysics, 2010, 491(1/4): 218-229. [本文引用:1][JCR: 2.684]
[16]
JiangZaisen, ZhangXi, ZhuYiqing, et al. Regional tectonic deformation setting before the Ms 8. 1 earthquake in the west of the Kunlun Mountains Pass[J]. Science in China(Series D), 2003, 33(Suppl. ): 163-172. [江在森, 张希, 祝意青, 等. 昆仑山口西Ms 8. 1地震前区域构造变形背景[J]. 中国科学: D辑, 2003, 33(增刊): 163-172. ][本文引用:1]
[17]
JiangZaisen, ZhangXi, ZhangJing, et al. Studies of Extracting Dynamic Imageof Crustal Deformation and Technique for Predicting Great Earthquake[M]. Beijing: Seismological Press, 2013. [江在森, 张希, 张晶, 等. 地壳形变动态图象提取与强震预测技术研究[M]. 北京: 地震出版社, 2013. ][本文引用:1]
[18]
WuYilin. Identification of Characteristics of Seismic Deformation Precursor[M]. Beijing: Seismological Press, 1994. [吴翼麟. 地震形变前兆特征的识别与研究[M]. 北京: 地震出版社, 1994. ][本文引用:1]
[19]
QiangZ, LinC, LiL, et al. Atellitic thermal infrared brightness temperature anomaly image—Short-term and impending earthquake precursors[J]. Science in China(Series D), 1999, 42(3): 313-324. [本文引用:3]
[20]
Tronin AA, HayakawaM, Molchanov OA. Thermal IR satellite data application for earthquake research in Japan and China[J]. Journal of Geodynamics, 2002, 33(4/5): 519-534. [本文引用:2][JCR: 2.967]
[21]
KangChunli. Research on relation between the OLR field change and earthquake activity in Chuan-Dian region of China[J]. Earthquake, 2008, 28(3): 43-48. [康春丽. 川滇地区长波辐射场变化与地震活动关系研究[J]. 地震, 2008, 28(3): 43-48. ][本文引用:1][CJCR: 0.863]
[22]
MassonnetD, RossiM, CarmonaC. The displacement field of the Land ers earthquake mapped by radar interferometry[J]. Nature, 1993, 364(6 433): 138-142. [本文引用:1][JCR: 38.597]
[23]
Shan XJ, MaJ, Wang CL, et al. Co-seismic ground deformation and source parameters of Mani M 7. 9 earthquake inferred from spaceborne D-InSAR observation data[J]. Science in China(Series D), 2004, 47(6): 481-488. [本文引用:1]
[24]
Olsen ET, Chahine MT, Chen LL, et al. Retrieval of Mid-tropospheric CO2 Directly from AIRS Measurements[R]. Pasadena CA: Jet Propulsion Laboratory, National Aeronautics and Space Administration, 2008. [本文引用:2]
[25]
HayakawaM, Molchanov OA, NASDA/UEC Team. Summary report of NASDA’s earthquake remote sensing frontier project[J]. Physics and Chemistry of the Earth, 2004, 29(4/9): 617-625. [本文引用:1][JCR: 1.037]
[26]
Tronin AA. Remote sensing and earthquakes: A review[J]. Physics and Chemistry of the Earth, 2006, 31(4/9): 138-142. [本文引用:4][JCR: 1.037]
[27]
King J IF. The radiative heat transfer of planet Earth[C]∥Van Allen James A, ed. Scientific Use of Earth Satellites. Michigam: Ann Arbor University of Michigan Press, 1956: 133-136. [本文引用:1]
ClarisseL, R’Honi Y, Coheur P F, et al. Thermal infrared nadir observations of 24 atmospheric gases[J]. Geophysical Research Letters, 2011, 38: L10802-L10806. [本文引用:1][JCR: 3.982]
[31]
Smith WL, Woolf HM, Hayden CM, et al. TIROS-N operational vertical sounder[J]. Bulletin of the American Meteorological Society, 1979, 60(10): 1177-1187. [本文引用:1][JCR: 6.591]
[32]
Persky MJ. A review of spaceborne infrared Fourier transform spectrometers for remote sensing[J]. Review of Scientific Instruments, 1995, 66(10): 4763-4797. [本文引用:1][JCR: 1.367]
[33]
KobayashiH, ShimotaA, YoshigaharaC, et al. Satellite-borne high-resolution FTIR for lower atmosphere sounding and its evalution[J]. IEEE Transactions on Geoscience and Remote Sensing, 1999, 37(3): 1496-1507. [本文引用:1][JCR: 3.467]
[34]
KobayashiH, ShimotaA, KondoK, et al. Development and evaluation of the interferometric monitor for green-house gases: A high-throughput Fourier-transform infrared radiometer for nadir Earth observation[J]. Applied Optics, 1999, 38(33): 6801-6807. [本文引用:1][JCR: 1.689]
[35]
ZhengYuquan. Development status of remote sensing instruments for greenhouse gases[J]. Chinese Optics, 2011, 4(6): 546-561. [郑玉权. 温室气体遥感探测仪器发展现状[J]. 中国光学, 2011, 4(6): 546-561. ][本文引用:1][CJCR: 0.4641]
WangQiao, LiQing, ChenLiangfu, et al. Technology of Satellite Remote Sensing for Atmospheric Environment Application[M]. Beijing: Science Press, 2011. [王桥, 历青, 陈良富, 等. 大气环境卫星遥感技术及其应用[M]. 北京: 科学出版社, 2011. ][本文引用:1]
[38]
DongChaohua, LiJun, ZhangPeng, et al. Principle of Hyperspectral Infrared Satellite Remote Sensing for Atmospheric Application[M]. Beijing: Science Press, 2013. [董超华, 李俊, 张鹏, 等. 卫星高光谱红外大气遥感原理和应用[M]. 北京: 科学出版社, 2013. ][本文引用:1]
[39]
Gille JC, PanL, Smith MW, et al. Retrieval of carbon monoxide profiles and total methane columns from MOPITT measurements[C]∥Geoscience and Remote Sensing Symposium, 1994. [本文引用:1]
[40]
Aumann HH, Pagano RJ. Atmospheric Infrared Sounder on the Earth Observing System[J]. Optical Engineering, 1994, 33(3): 776-784. [本文引用:1][JCR: 0.88]
[41]
Aumann HH, Chahine MT, GautierC, et al. AIRS/AMSU/HSB on the Aqua mission: Design, science objectives, data products and processing system[J]. IEEE Transactions on Geoscience and Remote Sensing, 2003, 41(2): 253-264. [本文引用:1][JCR: 3.467]
[42]
FrankenbergC, PlattU, WagnerT. Iterative maximum a posteriori (IMAP)-DOAS for retrieval of strongly absorbing trace gases: Model studies for CH4 and CO2 retrieval from near infrared spectra of SCIAMACHY onboard ENVISAT[J]. Atmospheric Chemistry and Physics, 2005, 5(6): 9-22. [本文引用:1][JCR: 5.51]
[43]
Ahmad SP, Levelt PF, Bhartia PK, et al. Atmospheric products from the Ozone Monitoring Instrument (OMI)[C]∥Barnes WL, ed. Earth Observing Systems VIII. Proceedings of SPIE. California, 2003, 5 151: 619-631. [本文引用:1]
[44]
RichterA, Burrow JP. Tropospheric NO2 from GOME measurements[J]. Advances in Space Research, 2002, 29(11): 1 673-1 683. [本文引用:1][JCR: 1.183]
[45]
BlumsteinD, ChalonG, CarlierT, et al. IASI instrument: Technical overview and measured performances[C]//Infrared Spaceborne Remote Sensing XII Proceedings of SPIE. Denver, Colorado, 2004, 5543: 196-207. [本文引用:1]
[46]
Razavi1A, ClerbauxC, WespesC, et al. Characterization of methane retrievals from the IASI space-borne sounder[J]. Atmospheric Chemistry and Physics, 2009, 9(20): 7889-7899. [本文引用:1][JCR: 5.51]
[47]
ClerbauxC, BoynardA, ClarisseL, et al. Monitoring of atmospheric composition using the thermal infrared IASI/MetOp sounder[J]. Atmospheric Chemistry and Physics, 2009, 9(16): 6041-6054. [本文引用:1]
[48]
ShimodaH. . Overview of Japanese earth observation programs[C]∥ Meynart R, Neeck S P, Shimoda H, eds. Sensors, Systems, and Next-Generation Satellites XVII. Germany: SPIE Proceedings, 2013, doi: DOI:10.1117/12.2029454. [本文引用:1]
[49]
DeronS, GailB, ChadF, et al. Calibration and validation on-orbit plan of the NPOESS Crosstrack Infrared Sounder (CRIS)[C], IEEE International, 2011: 3388-3 390. [本文引用:1]
[50]
BellA, Daum R. Remote sensing of atmospheric pollution by passive FTIR spectrometry[C]∥Schäfer K, ed. Spectroscipic Atmospheric Environmental Monitoring Tedniq Proceedings of SPIE. Barcelona, 1998, 3 493: 32-43. [本文引用:1]
[51]
Petersen AK, WarnekeT, FrankenbergC, et al. First ground-based FTIR observations of methane in the inner tropics over several years[J]. Atmospheric Chemistry and Physics, 2010, 10(15): 7 231-7 239. [本文引用:1][JCR: 5.51]
[52]
PlattU, PernerD, Pätz HW. Simultaneous measurements of atmospheric CH2O, O3 and NO2 by differential optical absorption[J]. Journal of Geophysical Research, 1979, 84(C10): 6 329-6 335. [本文引用:1]
[53]
PlattU, PernerD. Direct measurements of atmospheric CH2O, HNO2, O3 and SO2 by differential optical absorption in the near UV[J]. Journal of Geophysical Research, 1980, 85(C12): 7 453-7 458. [本文引用:1]
[54]
BuchwitzM, de BeekR, NoёlS, et al. Carbon monoxide, methane and carbon dioxide columns retrieved from SCIAMACHY by WFM-DOAS: Year 2003 initial data set[J]. Atmospheric Chemistry and Physics, 2005, 12(5): 3 313-3 329. [本文引用:3][JCR: 5.51]
[55]
SchneisingO, BuchwitzM, Burrows JP, et al. Three years of greenhouse gas column-averaged dry air mole fractions retrieved from satellite-Part 2: Methane[J]. Atmospheric Chemistry and Physics, 2009, 9(2): 443-465. [本文引用:1][JCR: 5.51]
[56]
Barkley MP, Frie βU, Monks PS. Measuring atmospheric CO2 from space using Full Spectral Initiation (FSI) WFM-DOAS[J]. Atmospheric Chemistry and Physics, 2006, 6(11): 3 517-3 534. [本文引用:1][JCR: 5.51]
[57]
SchneisingO, BuchwitzM, Burrows JP, et al. Three years of greenhouse gas column-averaged dry air mole fractions retrieved from satellite. Part 1: Carbon dioxide[J]. Atmospheric Chemistry and Physics, 2008, 8(14): 3 827-3 853. [本文引用:1][JCR: 5.51]
[58]
ChahineM, BarnetC, Olsen ET, et al. On the determination of atmospheric minor gases by the method of vanishing partial derivatives with application to CO2[J]. Geophysical Research Letters, 2005, 22(32), doi: DOI:10.1029/2005GL024165. [本文引用:1][JCR: 3.982]
[59]
Krotkov NA, Carn SA, Krueger AJ, et al. Band residual difference algorithm for retrieval of SO2 from the Aura Ozone Monitoring Instrument (OMI)[J]. IEEE Transactions on Geoscience and Remote Sensing, 2006, 44(5): 1 259-1 266. [本文引用:2][JCR: 3.467]
[60]
LiuYang, CaiBo, BanXianxiu, et al. Research progress of retrieving atmosphere humidity profiles from AIRS data[J]. Advances in Earth Science, 2013, 28(8): 890-896. [刘旸, 蔡波, 班显秀, 等. AIRS红外高光谱资料反演大气水汽廓线研究进展[J]. 地球科学进展, 2013, 28(8): 890-896. ][本文引用:1][CJCR: 1.388]
[61]
Carvalho AR, Carvalho JC, Da Silva JD, et al. Neural network based models for the retrieval of methane concentration vertical profiles from remote sensing data[C]// Anais XIII Simpósio Brasileiro de Sensoriamento Remoto. Florianópolis, Brasil, 2007, 21/26: 6 437-6 442. [本文引用:1]
[62]
Schoeberl MR, Ziemke JR, BojkovB, et al. A trajectory-based estimate of the tropospheric ozone column using the residual method[J]. Journal of Geophysical Research, 2007, 112: D24S49, doi: DOI:10.1029/2007JD008773. [本文引用:1]
[63]
TurquetyS, Hadji-LazaroJ, ClerbauxC, et al. Operational trace gas retrieval algorithm for the Infrared Atmospheric Sounding Interferometer[J]. Journal of Geophysical Research, 2004, 109: D21301, doi: DOI:10.1029/2004JD004821. [本文引用:1]
[64]
BaiWenguang. Preliminary Study of Satellite Remote Sensing of Greenhouse Gases Methane of Chinese Academy of Meteorological Sciences[D]. Beijing: Chinese Academy of Meteorological Sciences, 2010. [白文广. 温室气体CH4卫星遥感监测初步研究[D]. 北京: 中国气象科学研究院, 2010. ][本文引用:1]
[65]
FrankenbergC, PlattU, WagnerT. Retrieval of CO from SCIAMACHY onboard ENVISAT: Detection of strongly polluted areas and seasonal patterns in global CO abundances[J]. Atmospheric Chemistry and Physics, 2005, 5(6): 1 639-1 644. [本文引用:1][JCR: 5.51]
[66]
McMillan WW, BarnetC, StrowL, et al. Daily global maps of carbon monoxide from NASA’s atmospheric infrared sounder[J]. Geophysical Research Letters, 2005, 32(11): L11801, doi: DOI:10.1029/2004GL021821. [本文引用:1][JCR: 3.982]
[67]
BousquetP, CiaisP, Miller JB, et al. Contribution of anthropogenic and natural sources to atmospheric methane variability[J]. Nature, 2006, 443(7 110): 439-443. [本文引用:1][JCR: 38.597]
[68]
HouYanfang, WangShixin, ZhouYi, et al. Analysis of the carbon dioxide concentration in the lowest atmospheric layers and the factors affecting China based on satellite observations[J]. International Journal of Remote Sensing, 2013, 34(6): 1 981-1 994. [本文引用:1]
[69]
BeirleS, PlattU, WenigM, et al. Weekly cycle of NO2 by GOME measurements: A signature of anthropogenic sources[J]. Atmospheric Chemistry and Physics, 2003, 3(6): 2 225-2 232. [本文引用:1][JCR: 5.51]
[70]
KasibhatlaP, HeimannM, RaynerP, et al. Inverse Methods in Global Biogeochemical Cycles[M]. US: American Geophysical Union, 2000. [本文引用:1]
[71]
BovensmannH, BuchwitzM, Burrows JP, et al. A remote sensing technique for global monitoring of power plant CO2 emissions from space and related applications[J]. Atmospheric Measurement Techniques, 2010, 3(4): 781-811. [本文引用:1][JCR: 3.205]
[72]
LoyolaD, van GeffenJ, Valks1P, et al. Satellite-based detection of volcanic sulphur dioxide from recent eruptions in Central and South America[J]. Advances in Geosciences, 2008, 1(2): 35-40. [本文引用:1]
[73]
Carn SA, Strow L L, de Souza-Machado S, et al. Quantifying tropospheric volcanic emissions with AIRS: The 2002 eruption of Mt. Etna (Italy)[J]. Geophysical Research Letters, 2005, 32: L02301, doi: DOI:10.1029/2004GL021034. [本文引用:1][JCR: 3.982]
[74]
Prata AJ, BernardoC. Retrieval of volcanic SO2 column abundance from atmospheric infrared sounder data[J]. Journal of Geophysical Research, 2007, 112(D20), doi: DOI:10.1029/2006JD007955. [本文引用:1]
[75]
Khokhar MF, FrankenbergC, Van RoozendaelM, et al. Satellite observations of atmospheric SO2 from volcanic eruptions during the time-period of 1996-2002[J]. Advances in Space Research, 2005, 36(5): 879-887. [本文引用:1][JCR: 1.183]
Martin RV. Satellite remote sensing of surface air quality[J]. Atmospheric Environment, 2008, 42(34): 7 823-7 843. [本文引用:1][JCR: 3.11]
[78]
ZhengLeping. Another source of greenhouse gas CO2 : The Earth’s interior[J]. Research of Environmental Sciences, 1998, 11(2): 21-24. [郑乐平. 温室气体CO2的另一源——地球内部[J]. 环境科学研究, 1998, 11(2): 21-24. ][本文引用:2][CJCR: 1.295]
[79]
Salazar J ML, Perez NM, Hernand ez PA, et al. Precursory diffuse carbon dioxide degassing signature related to a 5. 1 magnitude earthquake in El Salvado, Central America[J]. Earth and Planetary Science Letters, 2002, 205(1): 81-89. [本文引用:2][JCR: 4.349]
[80]
Weinlich FH, FaberE, BouškovA, et al. Seismically induced variations in Mariánské Láznē fault gas composition in the NW Bohemian swarm quake region, Czech Republic—A continuous gas monitoring[J]. Tectonophys, 2006, 421(1/2): 89-110. [本文引用:1]
[81]
WaliaV, Virk HS, Bajwa BS. Radon precursory signals for some earthquakes of magnitude >5 occurred in NW Himalaya: An overview[J]. Pure and Applied Geophysics, 2006, 163(4): 711-721. [本文引用:1][JCR: 1.617]
[82]
WaliaV, Yang TF, Hong WL, et al. Geochemical variation of soil-gas composition for fault trace and earthquake precursory studies along the Hsincheng fault in NW Taiwan[J]. Applied Radiation and Isotopes, 2009, 67(10): 1 855-1 863. [本文引用:1][JCR: 1.179]
[83]
ZhouX, DuJ, ChenZ, et al. Geochemistry of soil gas in the seismic fault zone produced by the Wenchuan MS 8. 0 earthquake, southwestern China[J]. Geochemical Transactions, 2010, 11(5), doi: DOI:10.1186/1467-4866-11-5. [本文引用:1][JCR: 1.5]
[84]
QuattrocchiF, GalliG, GaspariniA, et al. Very slightly anomalous leakage of CO2, CH4 and radon along the main activated faults of the strong L’Aquila earthquake (Magnitude 6. 3, Italy). Implications for risk assessment monitoring tools & public acceptance of CO2 and CH4 underground storage[J]. Energy Procedia, 2011, 4: 4 067-4 075. [本文引用:1]
[85]
LiY, DuJ, WangX, et al. Spatial variations of soil gas geochemistry in the Tangshan area of Northern China[J]. Terrestrial, Atmospheric & Oceanic Sciences, 2013, 24(3): 323-332. [本文引用:1]
[86]
VoltattorniN, QuattrocchiF, GaspariniA, et al. Soil gas degassing during the 2009 L’Aquila earthquake: Study of the seismotectonic and fluid geochemistry relation[J]. Italian Journal of Geosciences, 2012, 131(3): 440-447. [本文引用:1][JCR: 0.875]
[87]
Uysal IT, FengYuexing, ZhaoJianxin, et al. Hydrothermal CO2 degassing in seismically active zones during the late Quaternary[J]. Chemical Geology, 2009, 265(3/4): 442-454. [本文引用:1][JCR: 3.154]
[88]
Kasimov NS, Kovin MI, Proskuryakov YV, et al. Geochemistry of the soils of fault zones (exemplified by Kazakhstan)[J]. Soviet Soil Science, 1978, 10(4): 397-406. [本文引用:2]
[89]
ZhuHongren, WangChengmin, WanDengbao, et al. A preliminary study on the scale of gaseous geochemistry for determining Seismic intensity[J]. Earthquake Research in China, 1991, 7(1): 59-64. [朱宏任, 汪成民, 万登堡, 等. 地震烈度的气体地球化学标度初探[J]. 中国地震, 1991, 7(1): 59-64. ][本文引用:1][CJCR: 0.657]
[90]
Toutain JP, Baubron JC. Gas geochemistry and seismotectonics: A review[J]. Tectonophys, 1999, 304(1): 1-27. [本文引用:1]
[91]
DeyS, SarkarS, Singh RP. Anomalous changes in column water vapor after Gujarat earthquake[J]. Advances in Space Research, 2004, 33(3): 274-278. [本文引用:2][JCR: 1.183]
[92]
Ganguly ND. Variation in atmospheric ozone concentration following strong earthquakes[J]. International Journal of Remote Sensing, 2009, 30(2): 349-356. [本文引用:2]
[93]
Singh RP, Kumar SJ, ZlotnickiJ, et al. Satellite detection of carbon monoxide emission prior to the Gujarat earthquake of 26 January 2001[J]. Applied Geochemistry, 2010, 25(4): 580-585. [本文引用:2][JCR: 1.708]
[94]
AmaniA, MansorS, PradhanB, et al. Coupling effect of ozone column and atmospheric infrared sounder data reveal evidence of earthquake precursor phenomena of Bam earthquake, Iran[J]. Arabian Journal of Geosciences, 2013, 7(4): 1 517-1 527. [本文引用:1][JCR: 0.74]
[95]
CuiY, DuJ, ZhangD, et al. Anomalies of total column CO and O3 associated with great earthquakes in recent years[J]. Natural Hazards and Earth System Sciences, 2013, 13(10): 2 513-2 519. [本文引用:3][JCR: 1.751]
[96]
Ganguly ND. The impact of transported ozone-rich air on the atmospheric ozone content following the 26 January 2001 and 7 March 2006 Gujarat earthquake[J]. Remote Sensing Letters, 2011, 2(3): 195-202. [本文引用:1][JCR: 1.615]
CuiYueju. Satellite Hyper-Spectrum Information of Gas Geochemistry Related to Earthquakes[D]. Beijing: Institute of Earthquake Science, China Earthquake Administration, 2011. [崔月菊. 地震相关的卫星高光谱气体地球化学信息[D]. 北京: 中国地震局地震预测研究所, 2011. ][本文引用:2]
[99]
Hamza VM. Tectonic leakage of fault bounded aquifers subject to non-isothermal recharge: A mechanism generating thermal precursors to seismic events[J]. Physics of the Earth and Planetary Interiors, 2001, 126(3): 163-177. [本文引用:1][JCR: 2.383]
TramutoliV, Di BelloG, PergolaN, et al. Robust satellite techniques for remote sensing of seismically active areas[J]. Annals of Geophysics, 2001, 44(2): 295-312. [本文引用:1][JCR: 1.138]
[102]
TramutoliV, AlianoC, CorradoR, et al. Abrupt change in greenhouse gases emission rate as a possible genetic model of TIR anomalies observed from satellite in Earthquake active regions[C]∥Proceedings of 33rd International Symposium on Remote Sensing of Environment (ISRSE33). Italy: Stresa, Lago Maggiore, 2009: 4-8. [本文引用:1]
[103]
Gorny VI, Salman AG, Tronin AA, et al. The Earth outgoing IR radiation as an indicator of seismic activity[J]. Doklady Akademii Nauk USSR, 1988, 301(1): 67-69. [本文引用:1]
[104]
OuzounovD, FreundF. Mid-infrared emission prior to strong earthquakes analyzed by remote sensing data[J]. Advances in Space Research, 2004, 33(3): 268-273. [本文引用:1][JCR: 1.183]
[105]
XuXiudeng, XuXiangmin, MaShengdeng, et al. A preliminary understand ing of the imminent atmospheric temperature anomaly genesis[J]. Acta Seismologica Sinica, 1995, 17(1): 123-137. [徐秀登, 徐向民, 马升灯, 等. 临震大气增温异常成因的初步认识[J]. 地震学报, 1995, 17(1): 123-137. ][本文引用:1][CJCR: 0.771]
[106]
LuZhenquan, QiangZuji, WuBihao. A tentative interpretation of the formation of high temperature anomaly in Satellite-based Thermal Infrared Scanning Images(STISI) of the South China Sea before earthquake[J]. Acta Geoscientia Sinica, 2002, 23(1): 42-46. [卢振权, 强祖基, 吴必豪. 南海临震前卫星热红外增温异常原因初探[J]. 地球学报, 2002, 23(1): 42-46. ][本文引用:1][CJCR: 1.268]
[107]
CuiYueju, DuJianguo, ChenZhi, et al. Remote sensing signals of atmospheric physics and chemistry related to 2010 Yushu MS 7. 1 Earthquake[J]. Advances in Earth Science, 2011, 26(7): 787-794. [崔月菊, 杜建国, 陈志, 等. 2010年玉树MS7. 1地震前后大气物理化学遥感信息[J]. 地球科学进展, 2011, 26(7): 787-794. ][本文引用:1][CJCR: 1.388]
[108]
JingFeng, ShenXuhui, ZhangTiebao, et al. Variation characteristics in infrared radiation of active fault zone related to earthquakes[J]. Remote Sensing for Land & Resources, 2013, 25(1): 56-60. [荆凤, 申旭辉, 张铁宝, 等. 与地震相关的活动断裂带红外辐射变化特征[J]. 国土资源遥感, 2013, 25(1): 56-60. ][本文引用:1]
[109]
YaoQinglin, QiangZuji, WangYiping. CO release from the Tibetan Plateau before earthquake and increasing temperature anomaly showing in thermal infrared images of satellite[J]. Advances in Earth Science, 2005, 20(5): 505-510. [姚清林, 强祖基, 王弋平. 青藏高原地震前CO的排放与卫星热红外增温异常[J]. 地球科学进展, 2005, 20(5): 505-510. ][本文引用:1][CJCR: 1.388]
[110]
GuoGuangmeng, CaoYungang, GongJianming. Monitoring anomaly before earthquake with MODIS and MOPITT data[J]. Advances in Earth Science, 2006, 2(7): 695-698. [郭广猛, 曹云刚, 龚建明. 使用MODIS和MOPITT卫星数据监测震前异常[J]. 地球科学进展, 2006, 2(7): 695-698. ][本文引用:2][CJCR: 1.388]
[111]
QuChunyan, MaJin, ShanXinjian. An attempt to observe gas releasing phenomena of the earthquake by using satellite thermal infrared technique[J]. Seismology and Geology, 2004, 26(3): 539-547. [屈春燕, 马瑾, 单新建. 利用卫星热红外观测地球排气现象的一次尝试[J]. 地震地质, 2004, 26(3): 539-547. ][本文引用:1][CJCR: 0.855]
[112]
TankV, PfanzH, KickH. New remote sensing techniques for the detection and quantification of Earth surface CO2 degassing[J]. Journal of Volcanology and Geothermal Research, 2008, 177(2): 515-524. [本文引用:1][JCR: 2.193]
[113]
CuiYueju. CO, O3 and CH4 Anomalies of Remote Sensing Geochemistry Occurred before and after Great Earthquakes[D]. Beijing: China University of Geosciences (Beijing), 2014. [崔月菊. 大地震前后CO, O3和CH4遥感地球化学异常特征[D]. 北京: 中国地质大学(北京), 2014. ][本文引用:3]
[114]
Singh RP, MehdiW, GautamR, et al. Precursory signals using satellite and ground data associated with the Wenchuan earthquake of 12 May 2008[J]. International Journal of Remote Sensing, 2010, 31(13): 3 341-3 354. [本文引用:1]
[115]
SunYutao, CuiYueju, LiuYongmei, et al. Remote sensing anomalies of CO and O3 related to two giant Sumatra earthquakes occurred in 2004 and 2005[J]. Remote Sensing Information, 2014, 29(2): 49-55. [孙玉涛, 崔月菊, 刘永梅, 等. 苏门答腊2004、2005年两次大地震前后CO和O3遥感信息[J]. 遥感信息, 2014, 29(2): 49-55. ][本文引用:2][CJCR: 0.7]
[116]
Singh RP, CervoneG, Singh VP, et al. Generic precursors to coastal earthquakes: Inferences from Denali fault earthquake[J]. Tectonophys, 2007, 431(1/4): 231-240. [本文引用:1]
[117]
ChenYang. Study on Earthquake-related Anomalous Features of Infrared Remote Sensing[D]. Beijing: Institute of Earthquake Science, China Earthquake Administration, 2011. [陈杨. 地震红外遥感异常特征综合研究: [D]. 北京: 中国地震局地震预测研究所, 2011. ][本文引用:1]
[118]
Thompson AM, Cicerone RJ. Possible perturbations to atmospheric CO, CH4, and OH[J]. Journal of Geophysical Research, 1986, 91(D10): 10 853-10 864. [本文引用:1]
[119]
LevyH. Photochemistry of the lower troposphere[J]. Planetary and Space Science, 1972, 20(6): 919-935. [本文引用:1][JCR: 2.109]
[120]
Crutzen PJ. A discussion of the chemistry of some minor constituents in the stratosphere and troposphere[J]. Pure and Applied Geophysics, 1973, 106(5/7): 1 385-1 399. [本文引用:1][JCR: 1.617]
GuoFengxia, JuXiaoyu, ChenCong. Review and progress of estimate on nitrogen oxide production by lightning[J]. Advances in Earth Science, 2013, 28(3): 305-317. [郭凤霞, 鞠晓雨, 陈聪. 估算闪电产生氮氧化物量的研究回顾与进展[J]. 地球科学进展, 2013, 28(3): 305-317. ][本文引用:1][CJCR: 1.388]
[123]
OuzounovD, LiuD, ChunliK, et al. Outgoing long wave radiation variability from IR satellite data prior to major earthquakes[J]. Tectonophysics, 2007, 431(1/4): 211-220. [本文引用:1][JCR: 2.684]
Abstract An exploratory data analysis (EDA) framework was developed in order to investigate the presence of possible correlations in the long-term geoelectric potential (LTGP) signal, prior to significant seismic events in Western Greece. Experimental data, which had been collected continuously within a 6-year period (1998–2003) at the earthquake signal-acquisition center of the University of Patras Seismological Laboratory (UPSL), were studied. The multidimensional scaling (MDS) technique was used to detect putative clustering tendencies in the ensemble of time-series (TS) segments that could indicate the existence of a possible correlation between the geoelectric signal structure and the impending seismic activity. The end result is a 2-dimensional point diagram with the geometry reflecting important signal characteristics, directly related with the underlying seismic events. In addition, the “appending technique”, a well-suited data analysis methodology was incorporated as a means of relating any other TS segment directly with the pre-computed, via the MDS, point diagram. Using the proposed EDA framework, we examined the presence of similar temporal patterns in the recorded geoelectric TS field, 10 days before the occurrence of the major earthquakes. The presented experimental results indicated clearly the validity of the introduced approach and, further, motivated the use of such advanced visualization schemes for charting precursor trends of significance seismicity.
Abstract Precursory phenomena in the ionosphere, atmosphere and groundwater before large earthquakes ( M > 6.5) are extensively investigated toward the earthquake prediction. Upward tornado type seismic clouds occurred near the epicenter associated with strong LF-VLF radio noises from lightning discharges in the evening of January 9, 1995 [Yamada, T., Oike, K. On the increase of electromagnetic noises before and after the 1995 Hyogo-Ken Nanbu earthquake. In: Hayakawa M. (Ed.), Atmospheric and Ionospheric Electromagnetic Phenomena Associated with Earthquakes. TERRAPUB, Tokyo, pp. 417–427, 1999] and anomalous foEs increases up to 10 MHz were detected at Shigaraki, 90 km of the epicenter and at Kokubunji, 500 km east of the epicenter [Ondoh, T. Anomalous sporadic-E layers observed before M7.2 Hyogo-ken Nanbu earthquake; Terrestrial gas emanation model. Adv. Polar Upper Atmos. Res. 17, 96–108, 2003; Ondoh, T. Anomalous sporadic-E ionization before a great earthquake, Adv. Space Research 34, 1830–1835, 2004] associated with strong ELF noises from lightning discharges in the daytime on January 15, 1995 [Hata, M., Fujii, T., Takumi, I. EM precursor of large-scale earthquakes in Japan, in: Abstracts of International Workshop on Seismo Electromagnetics (IWSE 2005), Univ. Electro-Communications, Chofu, Tokyo, Japan, March 15–17, pp. 182–186, 2005] before the M7.2 Hyogoken–Nanbu earthquake of January 17, 1995. The anomalous foEs increases occurred at epicentral distances within 500 km that are the same as those of the terrestrial gas emanations along active faults before large earthquakes [King, C.-Y. Gas geochemistry applied to earthquake prediction: An overview. J. Geophys. Res. 91(B12), 12269–12281, 1986]. The anomalous foEs increases seem to be a seismic precursor because geomagnetic and solar conditions were very quiet all day on January 15,1995 and the normal foEs in Japanese winter is below 6 MHz. No significant pre-seismic geomagnetic field variation was detected at epicentral distance of 100 km before this earthquake [Ondoh, T., Hayakawa, M. Anomalous occurrence of sporadic-E layers before the Hyogoken–Nanbu earthquake, M7.2 of January 17, 1995. In: Hayakawa, M. (Ed.), Atmospheric and Ionospheric Electromagnetic Phenomena Associated with Earthquakes, TERRAPUB, Tokyo, pp. 629–639, 1999; Ondoh, T., Hayakawa, M. Seismo discharge model of anomalous sporadic E ionization before great earthquakes. In: Hayakawa, M., O.A. Molchanov, (Eds.), Seismo Electromagnetics: Lithosphere–Atmosphere–Ionosphere Couplings, TERRAPUB, Tokyo, pp. 385–390, 2002; Ondoh. T., Hayakawa, M. Synthetic study of precursory phenomena of the M7.2 Hyogo-ken Nanbu earthquake. Phys. Chem. Earth 31, 378–388, 2006]. The foF2 decrease and h’F increase occurred before the M7.8 Hokkaido Nansei-Oki earthquake of July 12,1993 in a geomagnetic quiet period [Ondoh, T. Ionospheric disturbances associated with great earthquake of Hokkaido southwest coast, Japan of July 12, 1993. Phys. Earth Planet. Interiors. 105, 261–269, 1998; Ondoh, T. Seismo ionospheric phenomena. Adv. Space Res. 26, 8, 1267–1272, 2000]. Characteristic phase changes at terminator times of Omega 10.2 kHz waves passing 70 km of the epicenter extended toward darker local times by 1 h for 3 days before this earthquake due to lowering of the wave reflection height or ion density increases in the D region [Hayakawa, M., Molchanov, O. A., Ondoh, T., Kawai, E. The precursory signature effect of the Kobe earthquake on VLF subionospheric signals. J. Commun. Res. La., 43, 00. 169–180, 1996]. The radon concentration in the atmosphere over Ashiya fault, Kobe [Yasuoka, Y., Shinogi, M. Anomaly in atmospheric radon concentration: a possible precursor of the 1995 Kobe, Japan, earthquake. Health Phys. 72(5), 759–761, 1997] and in the groundwater at 17 m well in Nishinomiya, Japan [Igarashi, G., Saeki, S., Takahata, N., Sumikawa, K., Tasaki, S., Sasaki, Y., Takahashi, M., Sano, Y. Ground-water radon anomaly before the Kobe earthquake in Japan. Science 269, 60–61, 1995] had gradually increased since 2 months before the M7.2 earthquake, increased suddenly in December 1994, and rapidly returned to the normal low level of October, 1994 [Yasuoka, Y., Shinogi, M. 1997. Anomaly in atmospheric radon concentration: a possible precursor of the 1995 Kobe. Japan, earthquake. Health Phys. 72(5), 759–761.]. Radon concentration changes in the groundwater before the M 7.0 Izu-Oshima-kinkai earthquake, Japan on January 14, 1978 [Wakita, H., Nakamura, Y., Notsu, K., Noguchi, M., Asada, T. 1980. Radon anomaly: a possible precursor of the 1978 Izu-Oshima-kinkai earthquake. Science 207, 882–883] and the M6.8 Chengkung earthquake, Taiwan on December 10, 2003 [Kuo, T., Fan, K., Chen, W., Kuochen, H., Han, Y., Wang, C., Chang, T., Lee, Y. Radon anomaly at the Antung Hot Spring before the Taiwan M6.8 Chengkung earthquake. Proceedings, Thirty-First Workshop on Geothermal Reservoir Engineering, Stanford University, Stanford, California, January 30–February 1, 2006, SGP-TR-179, 2006] are also investigated to find common features of the groundwater radon concentration changes before large earthquakes ( M > 6.5) in comparison with those before the M7.2 Hyogoken–Nanbu earthquake. Groundwater radon concentrations before the 3 large earthquakes had shown common characteristic changes of gradually initial ones from the normal level since about 2 months before the earthquake onsets, rapid decreases down to the minimum, and quick increases up to the maximum at 7–20 days before the earthquake onsets, respectively. These are very useful characteristics of pre-seismic radon anomaly for the earthquake prediction or warning. Promising observations toward the earthquake prediction are also discussed.
Abstract Hourly monitoring of electrical conductivity (EC) of groundwater along with groundwater levels in the 210 m deep boreholes (specially drilled for pore pressure/earthquake studies) and soil Rn gas at 60 cm below ground level in real time, in the Koyna–Warna region (characterized by basaltic rocks, >1500 m thick, and dotted with several sets of fault systems), western India, provided strong precursory signatures in response to two earthquakes (M 4.7 on 14/11/09, and M 5.1 on 12/12/09) that occurred in the study region. The EC measured in Govare well water showed precursory perturbations about 40 h prior to the M 5.1 earthquake and continued further for about 20 h after the earthquake. In response to the M 4.7 earthquake, there were EC perturbations 8 days after the earthquake. In another well (Koyna) which is located 4 km north of Govare well, no precursory signatures were found for the M 4.7 earthquake, while for M 5.1 earthquake, post-seismic precursors were found 18 days after the earthquake. Increased porosity and reduced pressure head accompanied by mixing of a freshwater component from the top zone due to earthquakes are the suggested mechanisms responsible for the observed anomalies in EC. Another parameter, soil Rn gas showed relatively proportional strength signals corresponding to these two earthquakes. In both the cases, the pre-seismic increase in Rn concentration started about 20 days in advance. The co-seismic drop in Rn levels was less by 30% from its peak value for the M 4.7 earthquake and 50% for the M 5.1 earthquake. The Rn anomalies are attributed to the opening and closing of micro-fractures before and during the earthquake. On line monitoring of these two parameters may be useful to check the entire chemistry change due to earthquake which may help to forecast impending earthquakes. Research highlights ? It is the first hydrochemical precursory study in the Koyna region, India. ? Discrete conductivity measurements indicated progressive increase for 4 years. ? Strong precursory EC change observed 40 h before the M 5.1 earthquake. ? Precursory increase of soil Rn gas 20 days earlier than earthquakes M 4.7 & 5.1. ? On-line monitoring of these parameters may help in earthquake forecast.
1.Earthquake Prediction Research, Inc 381 Hawthorne Ave Los Altos CA 94022 U.S.A 381 Hawthorne Ave Los Altos CA 94022 U.S.A 2.China Seismological Bureau Center for Analysis and Prediction Beijing 100036 China Beijing 100036 China
Active faults are commonly associated with spatially anomalously high concentrations of soil gases such as carbon dioxide and Rn, suggesting that they are crustal discontinuities with a relatively high vertical permeability through which crustal and subcrustal gases may preferably escape towards the earth's surface. Many earthquake-related hydrologic and geochemical temporal changes have been recorded, mostly along active faults especially at fault intersections, since the 1960s. The reality of such changes is gradually ascertained and their features well delineated and fairly understood. Some coseismic changes recorded in ``near field'' are rather consistent with poroelastic dislocation models of earthquake sources, whereas others are attributable to near-surface permeability enhancement. In addition, coseismic (and postseismic) changes were recorded for many moderate to large earthquakes at certain relatively few ``sensitive sites'' at epicentral distances too large (larger for larger earthquakes, up to 1000 km or more for magnitude 8) to be explained by the poroelastic models. They are probably triggered by seismic shaking. The sensitivity of different sites can be greatly different, even when separated only by meters. The sensitive sites are usually located on or near active faults, especially their intersections and bends, and characterized by some near-critical hydrologic or geochemical condition (e.g., permeability that can be greatly increased by a relatively small seismic shaking or stress increase). Coseismic changes recorded for different earthquakes at a sensitive site are usually similar, regardless of the earthquakes' location and focal mechanism. The sensitivity of a sensitive site may change with time. Also pre-earthquake changes were observed hours to years before some destructive earthquakes at certain sensitive sites, some at large epicentral distances, although these changes are relatively few and less certain. Both long-distance coseismic and preseismic changes call for more realistic models than simple elastic dislocation for explanation. Such models should take into consideration the heterogeneity of the crust where stress is concentrated at certain weak points (sensitive sites) along active faults such that the stress condition is near a critical level prior to the occurrence of the corresponding earthquakes. To explain the preseismic changes, the models should also assume a broad-scaled episodically increasing strain field.
Abstract The formation of imminent hydrochemical precursors of earthquakes is investigated by the simulation for water–rock reaction in a brittle aquifer. Sixty-one soaking experiments were carried out with granodiorite and trachyandesite grains of different sizes and three chemically-distinct waters for 6 to 168 h. The experimental data demonstrate that water–rock reaction can result in both measurable increases and decreases of ion concentrations in short times and that the extents of hydrochemical variations are controlled by the grain size, dissolution and secondary mineral precipitation, as well as the chemistry of the rock and groundwater. The results indicate that water–rock reactions in brittle aquifers and aquitards may be an important genetic mechanism of hydrochemical seismic precursors when the aquifers and aquitards are fractured in response to tectonic stress.
SHAN Xinjian1,MA Jin1,WANG Changlin2,LIU Jiahang1,SONG Xiaoyu1 & ZHANG Guifang1 1.Institute of Geology and Laboratory of Tectonophysics,China Seismological Bureau,Beijing 100029,China;2.Institute of Remote Sensing Application,Chinese Academy of Sciences,Beijing 100101,China
We obtain the co-seismic ground deformation field of the Mani M7.9 earthquake on November 8, 1997 through three-pass differential interferometric processing. Then we get the geometric and kinematics parameters of this event by the elastic half-space model and forward modeling with the InSAR data. The following results have been obtained: (i) The deformation fields on both sides of the seismogenic fault are affected by the co-seismic deformation field even in 110 km away from the fault. The loss of phase coherence belt caused by the zone of ground rupture crosses the image from east to west with a length of an area 110 km. (ii) The maximum horizontal displacement caused by the earthquake reaches 7.96 m. (iii) The earthquake fault can be divided into four parts, and the deformation field of the middle two parts is bigger than that of the other two, with lengths of 27 km and 37 km, respectively. And their average sliding values on the rupture surface are 6500 mm and 6000 mm, respectively, and their depths both are 35 km. The segment of 27 km length is the major rupture surface of this earthquake. The west part and the east part of the fault have lengths of 23 km and 26 km, respectively. The sliding value of the west one is 4000 mm and that of the east one is 5800 mm. They extend to depths of 20 km and 18 km, respectively.
We obtain the co-seismic ground deformation field of the Mani M7.9 earthquake on November 8, 1997 through three-pass differential interferometric processing. Then we get the geometric and kinematics parameters of this event by the elastic half-space model and forward modeling with the InSAR data. The following results have been obtained: (i) The deformation fields on both sides of the seismogenic fault are affected by the co-seismic deformation field even in 110 km away from the fault. The loss of phase coherence belt caused by the zone of ground rupture crosses the image from east to west with a length of an area 110 km. (ii) The maximum horizontal displacement caused by the earthquake reaches 7.96 m. (iii) The earthquake fault can be divided into four parts, and the deformation field of the middle two parts is bigger than that of the other two, with lengths of 27 km and 37 km, respectively. And their average sliding values on the rupture surface are 6500 mm and 6000 mm, respectively, and their depths both are 35 km. The segment of 27 km length is the major rupture surface of this earthquake. The west part and the east part of the fault have lengths of 23 km and 26 km, respectively. The sliding value of the west one is 4000 mm and that of the east one is 5800 mm. They extend to depths of 20 km and 18 km, respectively.
Changchun Institute of Optics, Fine Mechanics and Physics, Chinese Academy of Sciences, Changchun 130033, China
The paper presents the development process of greenhouse gas remote sensing technology. It introduces the design priciples, work modes, spectral band setting and main specifications of foreign advance high spectral resolution remote sensors for greenhouse gases. Furthermore, It is also specified that greenhouse gas remote sensing technology evolves from synthetical instruments to special instruments. Based on the overview about greenhouse gas remote sensing technology, it discusses the future development trend of this kind of instrument and points out that the main emphasis of the research will be some instruments with higher spectral resolution, higher spatial resolution, wider coverages, shorter periods and higher signal to noise ratios.
(1.Key Laboratory of middle Atmosphere and Global Environment Observation,Institute of Atmospheric Physics, Chinese Academy of Sciences,Beijing 100029,China; 2.Graduate University of Chinese Academy of Science,Beijing 100049,China)
This paper summarize recent progresses in the technologies and methods of satellite\|based instruments for atmospheric CO 2 remote sensing, discuss the basic theory and retrieval method, and analyze the factors debasing the precision of CO 2 measurement. Three kinds of instruments are discussed in detail:① Currently operating satellite instruments, which observe atmospheric CO 2 and other components, such as Atmospheric Infrared Souner (AIRS), Scanning Imaging Absorption Spectrometer (SCIAMACHY) and Infrared Atmospheric Sounding Interferometer (IASI);② Specific instruments for detecting CO 2 content in the lower troposphere, such as Orbiting Carbon Observatory (OCO) and Greenhouse gas Observing Satellite (GOSAT);③ Satellite projects focus on active instrument\|laser lidar,such as Active Sensing of CO 2 Emissions over Nights,Days,and Seasons (ASCENDS) and Advanced Space Carbon and Climate Observation of Planet Earth (A\|SCOPE).In addition,we introduce technical basic in hyper spectral instrument in China.Validation,data assimilation and potential development of CO 2 satellite remote sensing are discussed at the end of paper.
Abstract Measurements from the Global Ozone Monitoring Experiment (GOME) have been analysed for tropospheric NO 2 using the Differential Optical Absorption method. The retrieval technique is described and a detailed error analysis is given. A case study of tropospheric NO 2 above Africa in fall 1997 is presented, showing the influence of both biomass burning and lightning. Comparison of clear and cloudy pixels reveals, that substantial amounts of NO 2 are present in the free troposphere over the African continent and in the outflow regions over the Southern Atlantic and the Indian Ocean. This has important implications for the formation of the tropospheric ozone maxima observed in these areas.
1.Liaoning Weather Modification Office,Shenyang 110016,China; 2.Air Force Meteorological Centre of Shenyang Military Region, Shenyang 110015,China
With the breakthrough of the satellite remote sensing key technology, satellite spectral resolution has reached to the level of distinguish between each spectral line, the researchers begin to research atmosphere profile and various micro constituent inversion using huge number of channels at the same time. This paper make a comment of the advances in Atmospheric humidity profile inversion using AIRS data, Analyzed and discussed the research status of clear sky atmospheric profiles from four aspects: training data, information extraction and dimensionality reduction of channels, inversion algorithm and accuracy improvement of Inversion. CIMSS and brightness temperature simulated used SARTA are usually chose to retrieve water vapor profile using AIRS data. Summarized two kinds of methods to do information extraction and dimensionality reduction, the first is spectral information compression, compared with PCA found that ICA is more practical. The second is channel selection, that is keeping part of channel contained more atmospheric profile information to achieve dimensionality reduction. It is worth mentioning that we need to choose different channel combination under different regional climate types, underlying surface, season, and real-time weather condition. Introduces three kinds of inversion algorithm: eigenvector regression algorithms(ERA), the Newton method(NM), and aritificial neural network algorithms(ANN). Compare the three methods found that ERA is simple, but the precision is not ideal; NW has high precision but it is not suitable for business application due to its long computing time; ANN has high computing speed and its precision can meet the requirements, thus, ANN has excellent foreground. Analyzed several samples classification method and additional factors, and give some suggestions to improve inversion algorithm. Finally, provide a brief introduction of infrared cloudcleared and inversion atmospheric profile under cloud condition.
随着卫星遥感关键技术的突破,卫星光谱分辨率达到了分辨大气成分单个谱线的水平,研究人员开始了大量通道同时反演大气廓线和多种微量成分的研究。针对AIRS(Atmospheric Infrared Sounder)就红外高光谱资料反演大气水汽廓线的研究进展进行了评述,从训练数据、通道信息的提取及降维、反演算法和反演精度改进4个方面对反演晴空大气水汽廓线的研究现状进行了分析与讨论。 AIRS资料反演大气水汽廓线的训练数据通常选用威斯康星大学提供的全球晴空反演训练样本集CIMSS(Cooperative Institute for Meteorological Satellite Studies, University of WisconsinMadison)和SARTA(StandAlone Radiative Transfer Algorithm)辐射传输模式模拟的亮温辐射值。归纳总结了2种通道信息的提取及降维方法:一是采用有效的方法来完成光谱信息压缩,对常用的主成分分析和独立分量分析方法进行了对比,认为独立分量分析更为可行。二是通道选择,即保留部分含有较多大气廓线信息量的通道,达到降维目的。在进行通道选择时要注意针对不同地区气候类型、下垫面、季节以及即时天气条件,选择不同的通道组合。介绍了3种反演算法:特征向量统计法、牛顿非线性迭代法和神经网络法。对比发现特征向量统计法简单易行,但精度不够理想;牛顿非线性迭代法精度虽高但计算耗时长,因此不适合业务使用;神经网络计算速度快、精度也能达到要求,具有很好的前景。对目前的几种样本分类方法及附加因子进行了对比分析,对反演算法精度的改进提出了一些有益的设想。最后对晴空辐射订正及云天大气水汽廓线反演进行了简要介绍,提出了该领域未来的一些研究方向。
Abstract In this article, we present satellite observations of atmospheric sulfur dioxide (SO 2 ) from volcanic eruptions. Global ozone monitoring experiment (GOME) data for the years 1996–2002 is analyzed using a DOAS based algorithm with the aim of retrieving SO 2 slant column densities (SCD). The retrieval of SO 2 SCD in the UV spectral region is difficult due to strong and interfering ozone absorptions. It is also likely affected by instrumental effects. We investigated these effects in detail to obviate systematic biases in the SO 2 retrieval. A quantitative study of about 20 volcanoes from Italy, Iceland, Congo/Zaire, Ecuador, Japan, Vanuatu Island and Mexico is presented. The focus is on both eruption and out gassing scenarios. We prepared a 7-year mean map (1996–2002) of SO 2 SCD observed by GOME and tabulated the ratios of the maximum SO 2 SCD observed to the average SO 2 SCD as seen in the 7-year mean map. The further aim of this study is to provide information about unknown volcanic eruptions, e.g., Bandai Honshu Japan, Central Islands Vanuatu, Piton de la Fournaise Réunion Island France, Kamchatka region of Russia and from Indonesia especially. The results demonstrate a high sensitivity of the GOME instrument towards SO 2 emissions during both eruption and degassing episodes.
Abstract Satellite remote sensing of air quality has evolved dramatically over the last decade. Global observations are now available for a wide range of species including aerosols, tropospheric O 3 , tropospheric NO 2 , CO, HCHO, and SO 2 . Capabilities for satellite remote sensing of these species in the boundary layer are reviewed for current instruments, along with physical processes affecting their accuracy and precision. Applications of satellite observations are discussed for case studies of specific events, for estimates of surface concentrations, and to improve emission inventories of trace gases and aerosols. Aerosol remote sensing at visible wavelengths exhibits high sensitivity to boundary layer concentrations. Although atmospheric scattering and surface emission of thermal radiation generally reduce instrument sensitivity to trace gases near the surface, a strong boundary layer signal in NO 2 arises from its large boundary layer concentrations relative to the free troposphere. Recommendations are presented including (1) additional dedicated validation activities, especially for tropospheric NO 2 and HCHO; (2) improved characterization of geophysical fields that affect remote sensing of trace gases and aerosols; (3) continued development of comprehensive assimilation and inversion capabilities to relate satellite observations to emissions and surface concentrations; (4) development of satellite instruments and algorithms to achieve higher spatial resolution to resolve urban scales, facilitate validation, and reduce cloud contamination that increases remote sensing error; and (5) support for the next generate of satellite instrumentation designed for air quality applications.
1.National Center for Research on Earthquake Engineering Taipei 106 Taiwan Taipei 106 Taiwan 2.National Taiwan University Department of Geosciences Taipei 106 Taiwan Taipei 106 Taiwan 3.360, Sector 71, SAS Nagar (Mohali) 160071 India 360, Sector 71, SAS Nagar (Mohali) 160071 India 4.Guru Nanak Dev University Department of Physics Amritsar 143005 India Amritsar 143005 India
The N-W Himalaya was rocked by a few major and many minor earthquakes. Two major earthquakes in Garhwal Himalaya: Uttarkashi earthquake of magnitude M s = 7.0 (m b = 6.6) on October 20, 1991 in Bhagirthi valley and Chamoli earthquake of M s = 6.5 (m b = 6.8) on March 29, 1999 in the Alaknanda valley and one in Himachal Himalaya: Chamba earthquake of magnitude 5.1 on March 24, 1995 in Chamba region, were recorded during the last decade and correlated with radon anomalies. The helium anomaly for Chamoli earthquake was also recorded and the Helium/Radon ratio model was tested on it. The precursory nature of radon and helium anomalies is a strong indicator in favor of geochemical precursors for earthquake prediction and a preliminary test for the Helium/Radon ratio model.
Abstract The present study is proposed to investigate geochemical variations of soil–gas composition in the vicinity of the geologic fault zone of Hsincheng in the Hsinchu area of Taiwan. Soil–gas surveys have been conducted across the Hsincheng fault, to look for the degassing pattern of this fault system. During the surveys, soil–gas samples were collected along traverses crossing the observed structures. The collected soil–gas samples were analysed for He, Rn, CO 2 , CH 4 , Ar, O 2 and N 2 . The data analysis clearly reveals anomalous values along the fault. Before selecting a monitoring site, the occurrence of deeper gas emanation was investigated by the soil–gas surveys and followed by continuous monitoring of some selected sites with respect to tectonic activity to check the sensitivity of the sites. A site was selected for long term monitoring on the basis of coexistence of high concentration of helium, radon and carrier gases and sensitivity towards the tectonic activity in the region. A continuous monitoring station was established at Hsinchu National Industrial Science Park (HNISP) in October 2005. Preliminary results of the monitoring station have shown possible precursory signals for some earthquake events.
Abstract Remote sensing data have been used to analyze the changes in column water vapor in response to the Gujarat earthquake, occurred on January 26, 2001. Anomalous changes in water vapor have been found over the surrounding land and oceanic regions around epicentral region before and after the earthquake. The sudden increase in column water vapor in the atmosphere before the earthquake may be attributed to the increase in evaporation due to increase in surface latent heat flux (SLHF). SLHF is found to increase two days before the earthquake and decrease after the main event on January 26, 2001 before it acquires the background value. Water vapor over the epicentral region is found to increase just before the earthquake whereas over the ocean, water vapor is found to increase after the earthquake.
Abstract NOAA AVHRR images have clearly shown anomalous changes in land surface temperature associated with earthquakes in the past two decades. Soon after the Gujarat earthquake of January 26, 2001, an anomalous increase in land surface temperature was inferred from MODIS satellite data a few days prior to the main earthquake event. The cause of such an anomalous change in surface temperature prior to the earthquake is attributed to many probable phenomena, but no definite cause has been identified. In the present study, changes of a complementary nature were found of land surface temperature associated with the emission of CO from the epicentral region. The observed changes on land and atmosphere associated with the Gujarat earthquake of 26 January, 2001, show the existence of strong coupling between land, atmosphere and ionosphere.
Variations of total column CO and O-3 in the atmosphere over the epicenter areas of 35 great earthquakes that occurred throughout the world in recent years were studied based on the hyper-spectrum data from Atmospheric Infrared Sounder (AIRS). It was found that anomalous increases of CO and/or O-3 concentrations occurred over the epicenter areas of 12 earthquakes among the 35 studied ones. However, increases in both CO and O-3 concentrations were found for 6 earthquakes. The O-3 anomalies appeared in the month when the earthquake occurred and lasted for a few months, whereas CO anomalies occurred irregularly. The duration of CO and O-3 anomalies related to the earthquakes ranged from 1 to 6 months. The anomalies of CO concentration related to the earthquake can be mainly attributed to gas emission from the lithosphere and photochemical reaction, while the anomalous increases in O-3 concentration can be mainly due to the transport of O-3-enriched air and photochemical reaction. However, more work needs to be done in order to understand the mechanism of the CO and O-3 anomalies further.
Institute of Earthquake Science China Earthquake Administration, Beijing 100036, China
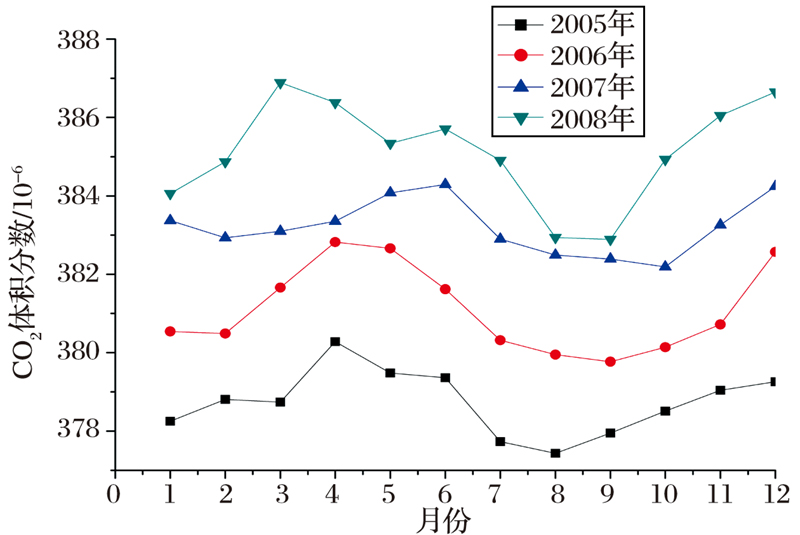
The variations of CO total column and the CO volume mixing ratio over time in epicenter and vicinity area of Baja California M W 7.2 earthquake(April 4 th 2010,Mexico)were extracted from AIRS database;the geochemical variations of CO and earthquake activities were carefully correlated.The extracted data showed that CO total column,one month before the earthquake,increased and was higher than the corresponding mean values(2~4×10 17 mole/cm 2 )of 2008~2009;CO total column and CO volume mixing ratio(near-surface)fluctuated and the standard deviations of 8-day average before and after the earthquake increased to as high as about 2 times of the non-seismic period.These phenomena were attributed to increasing gas leakage from the lithosphere,a result of the earthquake related stress and increasing photo-chemical reactions in the atmosphere,a result of variation of atmospheric electromagnetism related to the earthquake.The results indicate that geochemical information of CO obtained by satellite hyperspectral remote sensing can be connected with earthquake,indicating potential application in monitoring and forecasting earthquake.
利用AIRS产品数据提取了2010年4月4日墨西哥下加利福尼亚M W 7.2地震前后震中及其附近CO总量和CO体积混合比随时间变化的信息,讨论了CO气体地球化学变化与地震活动的关系.数据表明,下加利福尼亚地震前约一个月CO总量升高,高出前两年同期平均值2~4×10 17 mole/cm 2 ,在地震发生前后CO总量和近地表CO体积混合比有波动现象,且8日平均数据的标准偏差增大,约为非地震时段的2倍.该现象应该归因于地震孕育发生过程中地应力作用使岩石圈脱气增强、大气电磁和化学反应引起的CO含量的增加.研究结果表明利用卫星高光谱遥感数据提取与地震有关的CO气体地球化学信息,对地震监测预报有重要意义.
QIANG ZU-JI (Institute of Geology, State Seismological Bureau, Beijing 100029, PRC)XU XIU-DENG (Department of Geography, Zhejiang Normal University, Jinhua 321004, PRC) DIAN CHANG-GONG (Satellite Meterological Center, State Meteorological Administration, Beijing 100081, PRC)
People have already recognized the temperature-increase anomaly before earthquakes and studies have been made on this phenomenon. With the method of fixed-point network observation, only the timing temperature data limited to some sites can be obtained instead of dynamic evolution data of the temperature in a large area within the seismogenic range.
Abstract Solid Earth–atmosphere interactions and possibly solid Earth–seafloor interactions prior to major earthquakes are the subject of this study. Using data from Moderate Resolution Imaging Spectroradiometer (MODIS) onboard National Aeronautical Space Agency (NASA) Terra and Aqua satellites, we have begun to analyze infrared (IR) emissivity, land surface temperature (LST) and sea surface temperature (SST) data. Specifically, we look for correlations between solid Earth processes and atmosphere/ocean dynamics prior to strong earthquakes, selecting examples from 2001 and 2000. We find evidence for such correlations, specifically for a thermal anomaly LST pattern that is apparently related to pre-seismic activity. A new mechanism has recently been proposed based on positive hole-type charge carriers in rocks, which become activated when rocks are subjected to high levels of stress prior [J. Geodyn. 33 (2002) 545–572]. The appearance of these electronic charge carriers within a finite rock volume leads to enhanced IR emission from the rock surface in the 8–12 μm region.
High temperature often occurs in Satellite based Thermal Infrared Scanning Images (STISI) of the South China Sea before earthquake. This paper aims at interpreting the formation of the temperature anomaly in STISI of the South China Sea before earthquake. According to long period of observation and analysis, it is found that high temperature anomaly in STISI before earthquake is closely related to gas and oil reserves as well as gas hydrates, but has little to do with the expanding area in the South China Sea. Combined with previous experimental results, the authors consider that the high temperature in STISI results from the induced polarization and the green house effects of such gases as CH 4 and CO 2 emitted from the seepages of conventional oil and gas reserves and marine gas hydrates before earthquake.
1.Institute of Earthquake Science, China Earthquake Administration, Beijing100036, China; 2.Institute of Disaster Prevention, Yanjiao065201, China
The temporal and spatial variations of surface temperature, vapor total column, CO total column and CH 4 volume mixing ratio were retrieved by high-resolution satellite remote sensing data. The relationships between these variations and 14 April 2010 Yushu Ms 7.1 earthquake in Qinghai Province, Northwestern China and seismic ruptures were discussed. Brightness and surface temperature retrieved using MODIS L1B data associated with Yushu Earthquake shows that the values of brightness and surface temperature were higher along the NW fault zones than in the un-faulted areas before the main shock; the higher values of surface temperature were larger than the corresponding daily mean values of ten years before, which is similar to the phenomena that measured values of air temperature before the Yushu Earthquake were higher than the corresponding daily average of last ten years. Vapor total column, CO total column and CH 4 volume mixing ratio retrieved using AIRS shows that the values of vapor total column were higher than the average of last two years after the main event and CO total column also increased before and after the earthquake. Our results indicated that the variations associated with large earthquake maybe caused by the movement of deeper-earth material and degassing along faults during earthquake generation, which can be applied into monitoring and prediction of earthquake.
1. Institute of Earthquake Science, China Earthquake Administration, Beijing 100036, China; 2. Earthquake Administration of Sichuan Province, Chengdu 610041, China
The brightness temperature variation along the Ganzi-Yushu fault before and after 2010 Ms 7.1 Yushu earthquake was analyzed using MODIS data so as to obtain the infrared radiation variation information of the active fault related to the earthquake. It is shown that the value of the brightness temperature in one month before the earthquake was higher than that of other periods. The maximum variation was located at the northern end of the fault, where surface ruptures were found by field investigation. The obvious increase of brightness temperature was found during the 7-16 days after this event through an analysis of the data obtained from the seismic month at 10 day interval, and this might have had some relationship with the degassing of vapor and CO along the faults during the earthquake. For comparison, the data obtained in the same period of 2011 were analyzed. The results indicate that the brightness temperature of Ganzi-Yushu fault showed a homogeneous belt during the non-seismic time. The increase in brightness temperature of this fault was also found in May which might have had relationship with the Ms 5.3 Nangqian earthquake that occurred on June 26, 2011. It can be concluded that the variation of brightness temperature related to the fault zone can serve as an indicator of the fault activities. The study of the infrared radiation variation of main faults using satellite data is therefore significant for the monitoring of the seismic tectonic activity.
(Institute of Geology, China Earthquake Administration, Beijing 100029, China)
The anomaly of increasing temperature which can show in thermal infrared images of satellite before earthquakes relates to the gases release from the crust. Because the gases such as CO 2 and CH 4 were monitored or sampled only on a few sites, scope of the gases release before earthquakes were not understood enough. From MOPITT data of America EOS satellite, we found a largescale discharge of CO from the Tibetan Plateau on April 30, 2000 (before it, CO continuously released at least for some days). The image shows that the area with abnormally higher CO content bears circle structure with irregular forms, its accumulative length and area respectively were about 3200 km and 2.67×10 6 km 2 , and volume percentage of CO is higher in inner circles than that in outer ones. The region with the largest CO volume percentage (31×10 -8 ≥φ(CO)>27×10 -8 ) distributes roughly in EW direction with the length about 800km, width about 280 km, and area about 22.41×10 4 km 2 . [WTBX]φ[WTBZ](CO) in the anomaly area was about 1.57~4.10 times the normal value observed in January, 2002. This phenomenon has a good coherence with large-scale temperature increase on several sites of the Tibetan Plateau from April 29 to 30, 2000. All of them are precursors of the earthquake with Ms 5.9 at Jingtai, Gansu province, June 6, 2000 and that with Ms 6.9 in the north of Burma, June 8, 2000. This means that gases-hot mechanism of earthquake precursors is truthfulness, and low value center of ozone over Tibetan plateau may relate to oxidation of CO in the upper air.
1.Institute of Geographical Science and Natural Resources, Chinese Academy of Science,Beijing 100101,China;2.Institute of Marine Geology, Qingdao 266071,China
Temperature anomaly and gas anomaly such as methane and carbon dioxide before earthquake have been recognized for years. Many researchers have studied temperature anomalies with satellite thermal infrared data, while the gas anomaly has only been derived from limited ground measurements, and it is still not applicable in large areas. Here MODIS (Moderate Resolution Imaging Spectrometer) thermal infrared data is used to study the temperature increase before the Ms 5.0 Taiwan earthquake on January 15, 2002, and MOPITT (Measurements of Pollution in the Troposphere ) data is used to study the CO total column concentration before the Ms 7.5 Taiwan earthquake on March 31, 2002. It is found that there existed both high temperature area and high CO total column area near the Ms 7.5 earthquake epicenter and these two areas located at the same place. It is considered that this CO increase was caused by earth degassing. When these gases emit to atmosphere, they will also lead to temperature increase under the atmosphere electromagnetic field.
1.Key Laboratory of Meteorological Disaster of Ministry of Education, Nanjing University of Information Science & Technology, Nanjing210044, China; 2.Key Laboratory for Aerosol-Cloud-Precipitation of China Meteorological Administation, Nanjing University of Information Science & Technology, Nanjing210044, China
Abstract: [WT5BZ]Nitrogen oxide (NO X ) is one of the most important lightingproduced molecules, primarily because it facilitates chemical reactions in the troposphere that determine the concentrations of ozone (O 3 ) and of the hydroxyl radical (OH). NO X source, LNO X mechanism and their significance on climate change are introduced for understanding the estimate of LNO X , which is a research hotspot in atmospheric chemistry and lighting physics. Then, the main methods and results of estimate on LNO X are summarized. The conclusions show that, in situ measurement, laboratory simulation, theoretical extrapolation and retrieval of satellite data are the major research methods in this field. Through these methods, NO X production per unit lightning energy or unit lightning channel length are obtained, then combined with the total energy or channel length of lightning, the LNO X production in local or global is estimated by extrapolation or numerical modeling. Due to the different region, thunderstorm and even lightning are presented remarkable difference, and the parameters chosen by different researchers are various, leading to the diversity of results. In the past three decades, the mean value of relatively accurate production calculations has been 5.2(2.8~9.1) Tg/a. Therefore, advanced NO X observations of in-situ and space measurements should be analyzed to realize the LNO X mechanism. Appropriate NO X parameters should be chosen in varied intensity thunderstorm and individual lightning to reduce the parameter uncertainties. On that basis, atmospheric chemical model is integrated to simulate LNO X generation, development and the influence of other air composition regionally and globally. Thus, the role of LNO X in global climate change would be better recognized.
在对流层内,闪电产生的氮氧化物(LNO X )是氮氧化物(NO X )的主要来源之一,这一区域内,由于NO X 生命史较长,且控制着对流层臭氧(O 3 )和氢氧根(OH)的含量,影响着全球大气环境和气候变化。针对LNO X 量的估算这一大气化学及雷电物理领域内的研究热点,介绍了NO X 的主要来源、LNO X 的产生机制及其对气候变化的重要性,详细综述了国内外现有的估算LNO X 量的主要方法和估算结果。综述结果表明,目前估算LNO X 量采用的研究方法主要有野外观测、实验室模拟、理论模式计算和卫星数据反演,主要通过观测或假设得到单位能量产生的NO X 量,或单位通道长度产生的NO X 量,同时通过观测或假设得到一次放电通道产生的总能量或一次放电的总通道长度,进而外推或数值模拟某一局地区域或全球的LNO X 。由于不同地区、不同雷暴、甚至不同的闪电个体之间的显著差异导致不同的研究者估算LNO X 时采用的参数值不同,进而使得LNO X 估算量的结果差异较大,不确定性增大。近30年LNO X 较为精确的产量计算结果平均值为5.2(2.8~9.1)Tg/a。最后提出,今后需继续对比分析利用先进的观测手段得到NO X 和闪电的野外观测和卫星观测数据,进一步认识LNO X 的产生机制,得到针对不同地区、不同强度的雷暴和不同的闪电个体估算NO X 的参数取值,进一步减小估算LNO X 时所用到的各个参数的不确定性。在此基础上,利用大气化学数值模式模拟局地或全球LNO X 的产生和演变及其对其他空气成分的影响和作用,进一步认识LNO X 在全球气候变化中的作用。
 , 李静
, 李静