饱和水汽压差的卫星遥感研究综述
张红梅1,3, 吴炳方2,*, 闫娜娜2
1. 中南大学地球科学与信息物理学院,湖南 长沙 410083
2. 中国科学院遥感与数字地球研究所,北京 100101
3. 南昌工程学院水利与生态学院,江西 南昌 330099
吴炳方(1962-),男,江西玉山人,研究员,主要从事农业、水资源、生态环境遥感研究与应用. E-mail:wubf@radi.ac.cn

张红梅(1975-),女,江西赣州人,讲师,主要从事水资源遥感研究. E-mail:zhanghm_06@126.com

摘要

饱和水汽压差是许多陆表生态和陆面过程模型中非常重要的输入参数之一,精确估算并获取其时空分布特征是生态、农业遥感领域亟待解决的问题之一。在简要回顾饱和水汽压差的应用和传统获取方法的基础上重点介绍遥感估算饱和水汽压差的数据源和估算方法,即统计方法和解析计算法,并对解析计算法所需关键参数的国内外相关研究进展进行概述,探讨目前遥感估算饱和水汽压差存在的不足,并结合目前遥感技术发展现状和此领域研究存在的问题探讨其发展趋势,展望了联合多源遥感数据进行高时空分辨率的饱和水汽压差遥感估算问题。

关键词: 饱和水汽压差; 近地表气温; 陆表温度; 大气柱大气可降水量
中图分类号:P208.2 文献标志码:A 文章编号:1001-8166(2014)05-0559-10
Remote Sensing Estimates of Vapor Pressure Deficit: An Overview
Zhang Hongmei1,3, Wu Bingfang2, Yan Nana2
1. School of Geosciences and Info-Physics, Central south University, Changsha 410083, China
2. Institute of Remote Sensing and Digital Earth, Chinese Academy of Sciences, Beijing 100101, China
3. School of Ecology and Hydrodynamic engineering, Nanchang Institute of Technology, Nanchang 330099, China
Abstract

Vapor Pressure Deficit (VPD) is an important climatic variable widely used in many ecosystem models to simulate fluxes and states of water and carbon; it plays an important role in fire warning and epidemic disease early warning systems. Accurate estimation of spatio-temporally distributed VPD is critical for ecosystem and climate modeling efforts. In this paper, the available remote sensing datasets for satellitebased VPD estimation are analyzed, the precision and spatial resolution are two important factors for selecting remote sensing data. Then, the principle and advantages of different estimation algorithms are analyzed, which include the regression method and analytic method. The regression method is simple, but requires mass sample data and can not be used in other region before calibration. The analytic method is more complex, but can be used anywhere once established. The near surface air temperature and humidity are two key parameters for estimating VPD, which are usually estimated from the satellite retrieved land surface temperature and total precipitable water vapor. The errors in estimated VPD cloud are further eliminated by improving the accuracy of input remote sensing data and improving estimation algorithms of near surface air temperature and humidity. Finally, the existing problems and the VPD estimation research prospect are discussed. Most research work is limited in clear sky days until now, and VPD estimation under cloudy days is a challenging work, but it is important for many applications. A full VPD map could be achieved by combining several satellite data from different instruments, especially by taking the advantages of optical and microwave remote sensing. The prospects of the satellitebased VPD estimation technologies are presented.

Keyword: VPD; Near surface temperature; Land surface temperature; Columnar total precipitable water.
1 引 言

饱和水汽压差(Vapor Pressure Deficit,VPD)是指某一给定空气温度时的饱和水汽压和实际水汽压的差额,是反映空气湿度的一个参数。VPD是模拟水、碳通量和状态的生态模型最重要的气候变量之一,是植被蒸散的主要驱动因素之一,也是火灾预警模型和病虫害、流行性疾病传播预警模型的重要气象变量[ 1, 2, 3]。VPD是陆表植被气孔CO2吸收和水汽流失的一个基本调解者[ 4, 5],它对植物叶片的气孔导度有直接影响,过高的VPD将导致植物降低气孔开度以阻止过多的水份流失,这会减少光合作用的CO2吸收,从而影响植物及其果实的生长[ 6, 7, 8, 9, 10, 11]。因此,VPD广泛应用于各种水文循环、植被碳循环和蒸散发估算模型[ 12, 13, 14]。探索精确有效的估算VPD的方法对气候、生态和流行性疾病传播模型等研究具有重要意义[ 13, 15]

在模拟区域和全球的地—气间H2O和CO2交互的模型中,VPD的空间分布通常是用地基实测数据进行空间内插得到[ 16, 17, 18]。这些实测数据有3个来源:一是常规的地面气象站或自动气象站,这些气象站可以较高时间分辨率和精度测定近地表的气温和湿度,其中湿度常用相对湿度(RH)、露点温度(Tdew)、比湿(q)和水汽压(ea)表示;二是全球分布的通量塔,具体情况见表1,这些通量塔安装有温度和湿度测量装置,可以高时间分辩率测定近地表空气的温度和湿度[ 4, 5]。三是全球分布的无线电探空仪,其获取的温湿数据也是计算VPD的重要数据源。常用内插方法包括:泰森多边形、反距离加权平均、普通克里金、截断高斯滤波、样条内插等。空间内插方法在气象站足够密的地区能得到较为理想的结果,但在气象站布设稀疏,地貌又比较复杂的地方,用内插方法获得的VPD难以满足实际应用的需要。探索具有比空间内插方法更高空间保真度的方法是必要的[ 15, 16]

遥感具有大范围数据获取和连续观测能力[ 19],并且可用的遥感数据日益多样、精度不断提高,从多源遥感数据中提取VPD逐渐从设想成为可能。遥感估算VPD主要有2类方法,一类是以陆表温度为自变量的统计回归法[ 20, 21, 22],另一类为解析计算法[ 16]。本文旨在针对基于遥感资料的VPD估算进行分析和探讨,重点讨论遥感数据源、估算方法的研究现状和存在问题,并展望遥感估算VPD的前景,为高时空分辨率的VPD遥感估算研究提供参考。

表1 全球主要的通量观测研究网络 Table 1 Global main flux observation networks
2 遥感估算VPD的数据源

卫星遥感不能直接测定近地表空气的饱和水汽压差,遥感估算VPD是根据它与其他遥感反演参数的相关关系推算VPD值[ 13]。常用的参数包括陆表温度、近地表气温、近地表湿度和大气柱可降水总量(Total Precipitable Water, TPW) 等。目前,国际上可用的陆表温度和大气水汽数据主要来自美国和欧空局,以及其他国家的气象卫星,例如MSG SEVIRI、GMS VISSR和FY-3 MWHS等,如表2所示。

表2 全球主要的陆表温度和湿度数据集 Table 2 Global main land surface temperature and humidity datasets

经过几十年的努力,遥感反演陆表温度取得了较大进展[ 23]。在地表均一且发射率准确已知的晴空条件下,MODIS和AVHRR陆表温度的反演精度已接近1℃。 Susskind和Liu等[ 24, 25]指出,AIRS反演的Ts和Ta的精度在晴空条件下约为±1 ℃,随着云量的增加精度下降,在90%云覆盖时精度约为±2.5 ℃。但其他气象卫星影像反演的Ts精度要稍差些。

大气可降水量的遥感反演研究始于20世纪70年代末。80年代,美国研制了传感器AVIRIS,在0.94 μm水汽吸收带附近设置了多个窗区,并对飞机观测数据进行了基于差分吸收概念的水汽反演试验,为MODIS近红外水汽资料处理奠定了基础[ 26]。Eck等[ 27]通过实验研究发现,AVHRR反演的TPW具有较高的精度,误差小于0.5g/cm2。Gao等[ 28]用地基微波辐射计观测的水汽值对MODIS TPW 数据进行了精度验证,时间为2001年11月至2002年12月,结果表明,二者的相对误差为5%~10%。这与NASA在其官方网站上标称的精度吻合。

Ferguson等[ 29]用美国气象数据中心提供的2002—2008年间分布全美的1490站的数据对AIRS反演产品的精度进行了检验,发现AIRS Ta和RH的平均RMSE分别为3.8 ℃和13%。在国内,许多学者进行了FY卫星数据的水汽反演研究,反演精度在15%~30%之间[ 26, 30, 31]。需要注意的是:由于6.3 μm通道处于强水汽吸收带,对对流层600 hPa以上的中、上层湿度更敏感,对低层的水汽难以测量[ 32, 33],因此很多气象卫星的红外水汽反演产品并不适合于提取近地表空气湿度。

3 遥感估算VPD的主要方法

遥感估算VPD的方法有2类:一是回归统计法,即通过建立遥感反演参数与VPD之间的回归方程,直接推算VPD; 二是解析计算法,即分别利用遥感资料反演的近地表气温和湿度按公式计算瞬时VPD,再进行时间拓展得到日、周或月尺度的VPD。

3.1 回归统计方法

基于温度与VPD之间的强相关关系,回归统计法一般是建立陆表温度Ts与VPD之间的统计回归方程,直接反演出日尺度或周尺度的VPD。其中Ts为遥感反演结果,验证数据一般使用地基实测的温湿数据。

Granger[ 20]最早提出一种从遥感反演的陆表温度直接估算VPD的方法。Granger从陆表能量平衡关系出发,通过公式推导和数值实验发现饱和水汽压与VPD之间具有线性关系,并建立了如下的经验模型用于估算日VPD:

VPD=0.668es(Ts)-0.015Tltm-0.278 (1)

其中, es(Ts)是用 Ts计算的饱和水汽压(kPa), Tltm是长期平均的空气温度(℃)。

Hashimoto[ 13]建立了一个类似的统计模型,试图直接用MODIS Ts数据估算VPD。这个线性模型是:

VPDday=0.321es(Ts)-0.255 (r=0.77, n=340) (2)

VPD8day=0.348es(Ts)+0.129 (r=0.91, n=298) (3)

公式(2)中的模型系数是用地面观测的温度和湿度数据进行回归统计得到的,公式(3)中的模型系数是用MOD11数据和通量塔观测的VPD值进行回归统计得到的。作者用了3个具有不同时空分辨率的数据集对该模型的精度进行了验证,结果表明,这个模型的RMSE为3.2~3.8 hPa,适合估算的范围为0~25 hPa。

与传统的空间内插技术相比,这种简单的统计模型所需的计算量较小,易于实现,但模型的建立需要大批样本数据,且模型的移植性一般较差。

3.2 解析计算法

解析计算法是利用卫星遥感反演的温度和湿度,通过公式(4)计算得到VPD,因此,从遥感数据准确提取近地表气温和湿度是其关键。最常用的遥感产品包括大气温湿廓线、Ts、NDVI和TPW。

VPD=es(Ta)-ea (4)

其中, es(Ta) 是空气温度为 Ta时的饱和水汽压(kPa), ea为实际水汽压(kPa)。 es的计算模式有多种,如Goff-Gratch方程,Magnus经验公式及其改进形式,Tetents经验公式等[ 34],常用模式为[ 35]

es(Ta)=0.618exp(17.27*Ti/(Ti+237.3))(5)

其中, Ti为气温 Ta(℃)或露点温度 Tdew(℃)。

对于对VPD精度要求不高的应用模型而言,从遥感反演的大气温湿廓线数据提取近地表层的温湿信息简单易行。例如Venturini等[ 36]在其蒸散发估算模型中利用MODIS MOD07 1000 hPa气压层的温湿度数据计算VPD。

由于遥感反演的大气温湿廓线数据的垂向分辨率一般为1~2 km,甚至更粗,用温湿廓线中近地表气压层数据来计算地形复杂地区的VPD会带来很大的误差,难以满足应用的需要,因此,遥感估算VPD应该选择其他方法。鉴于Ts与近地表Ta之间、TPW与近地表湿度之间都具有强相关关系[ 13, 34, 37],可以从遥感反演的Ts和TPW推算VPD。

3.2.1 一般形式

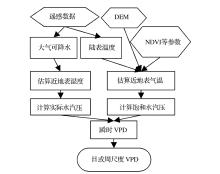
利用遥感反演的陆表温度和大气可降水量计算VPD相对比较复杂。尽管陆表温度与近地表气温、大气可降水总量与近地表湿度之间都具有强相关关系,但它们之间的关系会随时空变化而变化,因此需先确定Ts与TaTPW与Tdew (RH或q)之间的函数关系,则可推算近地表气温和湿度,进而计算近地表空气的饱和水汽压、实际水汽压和瞬时VPD,再用某种时间外推方法拓展到日尺度或周尺度的VPD(图1)。

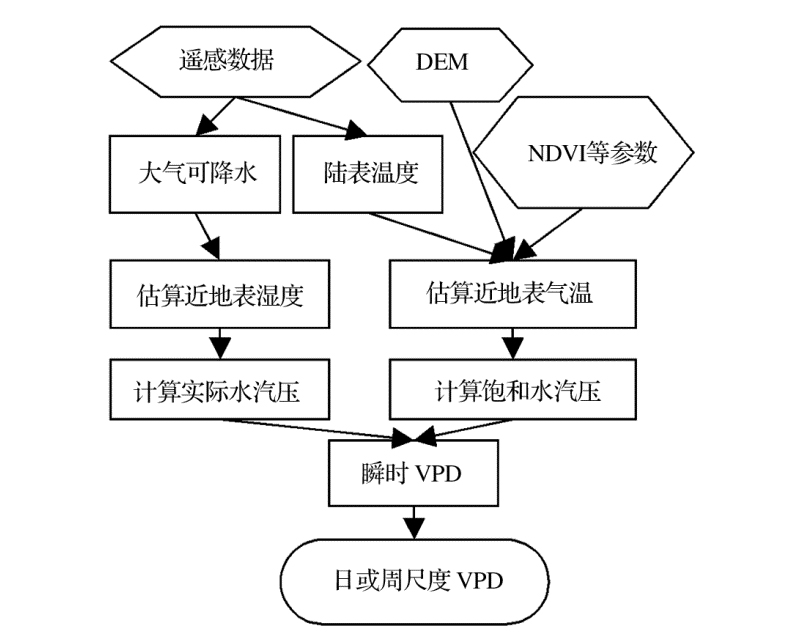
图1 遥感估算VPD的解析算法流程Figure 1 Flow work of satellite estimates of near surface VPD

Prince[ 16]最先提出了用AVHRR遥感数据估算Ts、Ta、TPW和VPD的方法。大致步骤为:先用分裂窗技术从AVHRR遥感数据反演 Ts,用温度—植被指数法(Temperature -Vegetation Index Method, TVX)从 Ts NDVI数据估算 Ta; 然后用AVHRR第4、5波段数据估算大气可降水,模式为:
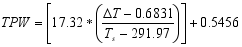
(6)

其中, TPW为大气柱大气可降水量(cm), Ts为陆表温度(K),△ T为2个水汽通道辐射温度差(K);再用Smith[ 34]推导的经验公式估算近地表空气的露点温度,模式为:
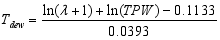
(7)

其中,λ是Smith给定的一个与纬度和季节有关的常数, Tdew的单位为℉,它与摄氏温度的转换关系为:C=0.55556*(F-32)。最后,将 Ta Tdew带入公式(4)计算得到VPD值。

最近,Sahin等[ 15]用24景AVHRR数据在土耳其进行了类似的实验研究,与Prince方法不同的是,未把Ts转换成Ta,而是直接用Ts计算饱和水汽压。通过与气象站数据对比发现,估算的瞬时VPD的 RMSE = 5.67 hPa, r = 0.957,月平均VPD的 RMSE = 2.67hPa, r = 0.991。

解析计算法的关键是要有较高精度的陆表温度和大气可降水量产品,稳健且高精度的近地表气温和湿度的估算模式。

3.2.2 关键参数研究现状

近地表气温和湿度是计算VPD的2个关键参数,它们的精度将决定VPD的估算精度。

(1) 近地表空气温度

近地表气温Ta是指距地面1.5~2 m处的空气动力学温度,它与Ts是2个不同的概念,许多学者都指出,在植被稀疏或裸土区,Ts与Ta的差异比较明显,特别是在白天,Ts可能比Ta高得多[ 14, 37, 38]。Ta除了可以用于计算VPD,还是水文、植物生理、气象和环境模型的重要输入参数之一[ 39, 40]。传统的Ta是由地面气象站收集,是呈点状分布数据,而一般的生态和陆面过程模型需要呈连续分布的Ta数据,因此用遥感方法获取Ta的方法受到了广泛关注。用遥感方法获取Ta有2种方法:其一是从遥感反演的大气温度廓线中提取最低层的温度;其二是从遥感影像反演的Ts推算Ta

上世纪末,一些学者试图通过大气垂直探测仪获取大气温度垂直廓线,如NOAA TOVS和GOES VAS等,但发现反演出的近地表气温精度较低[ 41, 42]。本世纪以来,各国的ATOVS数据处理软件包更新了反演算法,温度探测精度有所改善,与探空数据相比,在晴空条件下温度反演误差(RMS)约为2℃, 有云条件下约为2.5℃[ 43]。由于大气温度廓线产品的垂向分辨率不足使提取的最低层气温与距地表2m处的气温有较大差异, Flore等[ 44]试图在空气静力学假设条件下用DEM数据对廓线中最低层气温外推到近地表,但结果仍具有较大的误差。

陆表温度与VPD的强相关关系已被许多学者所证实[ 13, 45]。卫星遥感反演陆表温度的成功大大促进了从陆表温度估算近地表气温的研究。近地表气温的反演算法大体可分为:回归统计方法、温度—植被指数法(TVX)、神经网络法和能量平衡法4种[ 41, 45]。这4种方法各有其优缺点(表3),其中TVX方法的应用最为广泛。

统计方法是基于Ts、NDVI、太阳高度角和高程等参数与近地表气温之间的经验关系估算Ta。Vogt等[ 46]试图用AVHRR Ts数据推算近地表空气日最高气温Tmax,他们用1992年西班牙的31个气象站数据和148幅 AVHRR影像,对日最高气温Tmax和AVHRR Ts进行了回归分析,结果表明Tmax与AVHRR Ts强相关(平均 R2=0.823),从AVHRR Ts估算Tmax的平均误差在2~2.5 ℃之间。Cresswell[ 42]在Meteosat Ts与Ta之间的经验关系中引入一个经验的太阳天顶角来估计Ta,结果表明,70%以上的检验样本误差小于3 ℃。Vancutsem等[ 47]试图从MODIS Ts反演高分辨率的周尺度Ta 分布,结果表明,夜间的MODIS Ts能较好的估计日最小Tmin,但白天的MODIS Ts与日最高Tmax差异明显。Lin等[ 48]以Ts、太阳天顶角、TPW、NDVI、增强植被指数(EVI)和高程为输入数据,试图建立一个先进的算法来从遥感数据反演高时空分辨率的Ta,结果表明,高程与Ta相关性最强,其次是TPW、 Ts、太阳天顶角、NDVI和EVI,平均反演误差约2 ℃。

表3 近地表气温遥感反演算法比较 Table 3 Methods for retrieving Ta from remote sensing data

TVX算法最早由Goward等[ 49]提出,它基于2点假设: NDVI与地表温度之间存在一个强的“负”相关关系;在完全植被覆盖区,冠层上表面的气温与陆表温度相等。这样就可以用一个n×n的滑动窗口内的像元的NDVI和Ts数据来拟合得到这个“负”相关方程,并外推得到NDVImax, 再把NDVImax带入相关方程从而确定滑动窗口中心像元的T a值。许多学者在不同地区用TVX方法从AVHRR、MSG/SEVIRI、MODIS等遥感数据估算了Ta,结果表明Ta估算的RMSE在2~5℃之间[ 16, 50, 51, 52, 53, 54]

人工神经网络是以多个参数作为输入数据的非线性统计方法。Jang等[ 55]以AVHRR的5个波段数据、地表高程、太阳天顶角和儒略日作为输入数据,用人工神经网络法反演Ta,误差在2℃左右。Zhao等[ 56]以ETM+的遥感反照率、NDVI、地表高程和温度为输入数据,用PB人工神经网络模型在中国汉江流域进行了Ta反演试验,估算日均气温和最高、最低气温的误差在0.9℃左右。

基于地表能量平衡的方法具有坚实的物理基础。Sun等[ 57]基于热力学理论,用植物水分胁迫指数和空气动力学阻抗2个参数,建立了地表温度与气温之间的转换模型,并用MODIS数据在中国华北平原进行了验证,结果发现,80%以上数据的误差小于3.0℃。Zaksek 等[ 58]用一个复杂的基于能量平衡的方法估算了瞬时Ta,RMSE为2℃。

总体而言,用上述方法估算Ta 的误差为1~5℃[ 58]。目前气温遥感反演中还没有哪种方法得到普遍认可[ 41]

(2)近地表湿度

水汽的分布、传输和季节变化规律对于研究全球气候变化、水循环和天气预报都具有重要意义,大气水汽含量还是遥感影像大气校正的重要输入数据,因此,卫星遥感反演大气水汽的研究受到了广泛重视。

现有的大气水汽遥感反演方法,按使用的电磁波不同可分为近红外遥感、红外遥感和微波遥感[ 43]。大气水汽遥感反演结果主要以大气柱水汽廓线和可降水总量2种形式表示。

大气中的水汽大部分位于对流层低层[ 33, 59],距地面10~12km 以下的水汽约占整个水汽廓线的99%,一般越接近地面水汽密度越大。 由于目前遥感反演的大气湿度廓线垂向分辨率不高限制了其在VPD遥感估算的应用,因此VPD计算所需的近地表湿度一般从大气可降水量估算。

关于大气可降水量与近地表湿度之间关系的研究始于20世纪中、后期。早在20世纪中叶,为了弄清大气水汽的时空分布特性,一些学者开始探究近地表空气湿度与大气水汽的关系。通过实验研究发现,地表处的露点温度和高空大气水汽之间具有强相关性[ 60, 61, 62]。基于这一结果,这些学者建立了二者之间的线性函数,试图用地面气象站测得的温湿数据估算大气可降水总量。Reitan[ 60]用540组月平均大气可降水量与地表露点温度数据建立了二者之间的回归关系式:ln( TPW)= A+ B* Tdew , ( r=0.98)。 Smith[ 34]借鉴了Reitan的研究成果,建立了一个TPW与地表露点温度的经验关系式,即公式(7)。此外,Ojo[ 61]利用Reitan的方法,建立了适合于西非的对数线性关系式; Adedokun[ 63, 64]用西非实验数据建立了TPW和Tdew之间的指数关系式,并对几种近地表空气湿度与大气可降水之间的经验关系式进行了检验。Adeyemi[ 65]用探空数据建立了TPW和地表水汽混合比之间的回归关系: TPW= α* q+ β, 其中 α β为回归系数。

近些年来,随着遥感大气可降水技术的日益成熟,关于 TPW和近地表湿度的研究主要集中在用遥感反演的 TPW推算地面实际水汽压。杨景梅等[ 65] 建立了大气可降水总量与地面水汽压的经验关系: ,其中 为与地理纬度和高程有关的经验系数;Sobrino等[ 67]建立了MODIS TPW与地面实际水汽压的回归关系式: TPW= a* ea+ b ( a=0.1046, b=0.0586);Peng等[ 68]建立了大气可降水与空气比湿之间的经验公式,实现了由MODIS MOD05推算近地表相对湿度;Han等[ 69]则建立了一个以Ts、 NDVI、 TPW、DEM、儒略日和当地时间6个参数为输入数据的三阶多元回归方程用于估算近地表的相对湿度,经过验证表明,该方法估算RH的精度约为10%。最近,Recondo等[ 70]提出了一种直接从MODIS NIR波段辐射数据估算近地表水汽压的算法: ea=a+bL2+ cL17, R2为0.56~0.76, RMSE=2 hPa。此外, 国内一些学者进行了类似研究[ 71, 72, 73],反演精度为10%~20%。

目前遥感估算近地表气温,湿度和VPD大部分限于晴空条件,对于云覆盖条件下的气候参数反演比较少。郁凡等[ 74]利用多光谱图像云参数建立了反演大气三维湿度场的多元线性回归方程,Bisht和Bras[ 75]提出了阴天条件下的近地表温度和湿度的估算问题,但这些方法的结果具有较大的不确定性,还需要深入研究。

4 结论与展望

随着卫星和传感器技术、遥感反演模型的不断改进,借助少量的地面观测数据已能反演具有较高时空分辨率的近地表空气的VPD。从已有的研究来看,准确估算VPD需要有高精度的Ta和Tdew数据。遥感估算VPD的方法主要有回归统计法和解析计算法。回归统计方法过程简单,但不具有普适性且需要大量的样本数据;解析方法物理意义明确,但过程更复杂,并且现有的解析算法中,Ts与Ta函数关系式多为经验关系式,其精度与样本数据有关,可移植性差。

尽管遥感技术已能估算近地表气温、湿度和VPD,但距离应用还有一段距离。Benali等[ 45]认为,遥感估算的近地表气温的精度应达到1~2℃才能满足农业、能源管理、交通管理和疾病预警等方面应用的需要。虽然目前美国MODIS传感器反演的Ts和TPW产品标称精度分别为1℃和10%,而欧空局的Metop IASI传感器也标称其获取的温湿廓线能达到1℃和10%的精度,但利用这些数据来推算具有高空间分辨率和精度的VPD还有一些问题需要解决,应在下面几个方面做深入研究:

(1)进一步提高陆表温度和大气可降水量的反演精度。充分利用多源遥感数据,采用多传感器数据加权平均的方法可以提高反演精度[ 76]。另外,订正源数据误差和改进算法也有助提高二者的反演精度,例如美国MODIS研究小组正尝试用物理反演算法替换现有的统计回归算法,以提高MODIS TPW的反演精度。

(2)改进近地表气温和湿度的估算方法。结合陆面过程理论和空气动力学理论,研究基于物理的地表气温和湿度的估算算法将有助提高精度。另外,充分利用高精度的大气温湿廓线数据,优化现有算法也将提高二者的反演精度。

(3)研究非晴空条件下的近地表VPD的估算问题。对于大多数应用而言,需要时空连续的VPD数据,如何获取云天条件下的近地表VPD是一个具有挑战的任务。Crosson[ 77]和Sun等[ 78]提出的将多传感器多时相数据结合起来以提高陆表温度的覆盖率的做法值得借鉴。

总之,随着卫星传感器技术和反演算法的不断改进,遥感估算近地表气温和空气湿度的精度将会逐步提高。而微波遥感近地表温湿度技术的进步也将有助于获取时空连续的VPD,从而实现从多源遥感数据中提取高时空分辨率的VPD分布信息。

The authors have declared that no competing interests exist.

参考文献
[1] Rogers D J, Hay S I, Packer M J. Predicting the distribution of tsetse flies in west Africa using temporal fourier processed meteorogical satellite data[J]. Annals of Tropical Medicine and Parasitology, 1996, 90: 225-241. [本文引用:1] [JCR: 1.313]
[2] Hay S I, Lennon J J. Deriving meteorological variables across Africa for the study and control of vector-borne disease: A comparison of remote sensing and spatial interpolation of climate[J]. Tropical Medicine and International Health, 1999, 4: 58-71. [本文引用:1] [JCR: 2.938]
[3] Green R M, Hay S I. The potential of pathfinder AVHRR data for providing surrogate climatic variables across Africa and Europe for epidemiological applications[J]. Remote Sensing of Enviroment, 2002, 79: 166-175. [本文引用:1]
[4] Almeida A C, Land sberg J J. Evaluating methods of estimating global radiation and vapor pressure deficitusing a dense network of automatic weather stations in coastal Brazil[J]. Agricultural and Forest Meteorology, 2003, 118: 237-250. [本文引用:2] [JCR: 3.421]
[5] Vrugt J A, Bouten W, Dekker S C. Transpiration dynamics of an Austrian Pine stand and its forest floor: Identifying controlling conditions using artificial neural networks[J]. Advances in Water Resources, 2002, 25: 293-303. [本文引用:2] [JCR: 2.412]
[6] Jarvis P G. The interpretation of the variations in leaf water potential and stomatal conductance found in canopies in the field[J]. Philosophical Transactions of the Royal Society of London, Series B, 1976, 273: 593-610. [本文引用:1]
[7] Leonardi C, Guichard S, Bertin N. High vapour pressure deficit influences growth, transpiration and quality of tomato fruits[J]. Scientia Horticulturae, 2000, 84: 285-296. [本文引用:1] [JCR: 1.396]
[8] Habermann G, Machado E C, Rodrigues J D, et al. Gas exchange rates at different vapor pressure deficits and water relation of Pera’ Sweet Orange plants with Citrus Variegated Chlorosis(CVC)[J]. Scientia Horticulture, 2003, 98: 233-245. [本文引用:1]
[9] Williams L E, Baeza P. Relationships among ambient temperature and vapor pressure deficit and leaf and stem water potentials of fully irrigated, field-grown grapevines[J]. American Journal of Enology and Viticulture, 2007, 58: 173-181. [本文引用:1] [JCR: 1.856]
[10] Lendzion J, Leuschner C. Growth of European Beech(Fagussylvatica L. ) sapling is limited by elevated atmospheric vapour pressure deficits[J]. Forest Ecology and Management, 2008, 256: 648-655. [本文引用:1] [JCR: 2.766]
[11] Zhu Liwei, Zhao Ping, Cai Xi’an, et al. Characteristics of transpiration and canopy stomatal conductance of Schima Superba Plantation and their responses to environmental factors[J]. Journal of Tropical and Subtropical Botany, 2010, 18(6): 599-606.
[朱丽薇, 赵平, 蔡锡安, . 荷木人工林蒸腾与冠层气孔导度特征及对环境因子的响应[J]. 热带亚热带植物学报, 2010, 18(6): 599-606. ] [本文引用:1] [CJCR: 0.777]
[12] Aber J D, Reich P B, Goulden M L. Extrapolating leaf CO2 exchange to the canopy: A generalized model of forest photosynthesis compared with measurements by eddy correlation[J]. Oecologia, 1996, 106: 257-265. [本文引用:1] [JCR: 3.011]
[13] Hashimoto H, Dungan J L, White M A, et al. Satellite-based estimation of surface vapor pressure deficits using MODIS land surface temperature data[J]. Remote Sensing of Enviroment, 2008, 112: 142-155. [本文引用:6]
[14] Wang K C, Dickinson R E. A review of global terrestrial evapotranspiration: Observation, modeling, climatology, and climatic variability[J]. Reviews of Geophysics, 2002, 50(2), doi: 10.1029/2011RG000373. [本文引用:2] [JCR: 13.906]
[15] Sahin M, Yildiz B Y, Senkal O, et al. Estimation of the vapour pressure deficit using NOAA-AVHRR data[J]. International Journal of Remote Sensing, 2013, 34(8): 2 714-2 729. [本文引用:3]
[16] Prince S D, Goetz S J, Dubayah R O, et al. Inference of surface and air temperature, atmospheric precipitable water and vapor pressure deficit using advanced very high-resolution radiometer satellite observations: Comparison with field observations[J]. Journal of Hydrology, 1998, 212/213: 230-249. [本文引用:5]
[17] Mu Q Z, Zhao M S, Running S W. Improvements to a MODIS global terrestrial evapotranspiration algorithm[J]. Remote Sensing of Environment, 2011, 115: 1 781-1 800. [本文引用:1] [JCR: 5.103]
[18] Wu B F, Yan N N, Xiong J, et al. Validation of ETWatch using field measurements at diverse land scapes: A case study in Hai Basin of China[J]. Journal of Hydrology, 2012, 436/437: 67-80. [本文引用:1] [JCR: 2.964]
[19] Jia Kun, Yao Yunjun, Wei Xiangqin, et al. A review on fractional vegetation covers estimation using remote sensing[J]. Advances in Earth Science, 2013, 28(7): 774-782.
[贾坤, 姚云军, 魏香琴, . 植被覆盖度遥感估算研究进展[J]. 地球科学进展, 2013, 28(7): 774-782. ] [本文引用:1] [CJCR: 1.388]
[20] Granger R J. Evaporation from Natural Nonsaturated Surfaces[D]. Saskatoon: University of Saskatchewan, 1991. [本文引用:2]
[21] Granger R J. Satellite-derived estimates of evapotranspiration in the Gediz Basin[J]. Journal of Hydrology, 2000, 229: 70-76. [本文引用:1] [JCR: 2.964]
[22] Choudhury B J. Estimation of vapor pressure deficit over land surface from satellite observations[J]. Advances in Space Research, 1998, 22: 669-672. [本文引用:1] [JCR: 1.183]
[23] Li Z, Tang B, Wu H, et al. Satellite-derived land surface temperature: Current status and perspectives[J]. Remote Sensing of Environment, 2013, 131: 14-37. [本文引用:1] [JCR: 5.103]
[24] Susskind J, Barnet C, Blaisdell J. Accuracy of geophysical parameters derived from atmospheric infrared sounder/advanced microwave sounding unit as a function of fractional cloud cover[J]. Journal of Geophysical Research: Atmospheres, 2006, 111(D9), doi: 10.1029/2005JD006272. [本文引用:1] [JCR: 3.174]
[25] Liu Yang, Cai Bo, Ban Xianxiu, et al. Research progress of retrieving atmosphere humidity profiles from AIRS data[J]. Advances in Earth Science, 2013, 28(8): 890-896.
[刘旸, 蔡波, 班显秀, . AIRS红外高光谱资料反演大汽廓线研究进展[J]. 地球科学进展, 2013, 28(8): 890-896. ] [本文引用:1] [CJCR: 1.388]
[26] Hu Xiuqing, Huang Yibin, Lu Qifeng, et al. Retrieving precipitable water vapor based on the near-infrared data of FY-3A Satellite[J]. Journal of Applied Meteorological Science, 2011, 22(1): 46-56.
[胡秀清, 黄意玢, 陆其峰, . 利用FY-3A近红外资料反演水汽总量[J]. 应用气象学报, 2011, 22(1): 46-56. ] [本文引用:2] [CJCR: 1.379]
[27] Eck T F, Holben B N. The relationship between AVHRR split window temperature difference and total precipitable water over land surface[J]. International Journal of Remote Sensing, 1994, 15(3): 567-582. [本文引用:1]
[28] Gao B C, Kaufman Y J. Water vapor retrievals using MODIS near-infrared channels[J]. Journal of Geophysical Research, 2003, 103(D13): 4 389-4 395. [本文引用:1]
[29] Ferguson C R, Sheffield J, Wood E F. Quantifying uncertainty in a remote sensing-based estimate of evapotranspiration over continental USA[J]. International Journal of Remote Sensing, 2010, 31(14): 3 821-3 865. [本文引用:1]
[30] Liu X Y, Mao J T, Zhang F, et al. The analysis of water vapor distribution over Taklimakan Desert[J]. Science in China(Series D), 2012, 55(3): 446-455. [本文引用:1]
[31] He J Y, Zhang S W. Humidity retrieval in mid-latitude and tropical regions using FY-3 MWHS[J]. Journal of Remote Sensing, 2012, 16(3): 562-569. [本文引用:1] [CJCR: 0.992]
[32] Parkison C L, Greenstone R. EOS Data Products Hand book-Volume 2[M]. Maryland : NASA Goddard Space Flight Center Greenbelt, 2000. [本文引用:1]
[33] Li Honglin, Li Wanbiao. Retrieval of atmospheric total water vapor with MODIS near infrared measurements[J]. Acta Scientiarum Naturalium Universitatis Pekinensis, 2008, 44(1): 121-128.
[李红林, 李万彪. MODIS 近红外资料反演大气水汽总含量[J]. 北京大学学报: 自然科学版, 2008, 44(1): 121-128. ] [本文引用:2] [CJCR: 0.799]
[34] Smith W L. Note on the relationship between precipitable water and surface dew point[J]. Journal of Applied Meteorology, 1966, 5: 726-727. [本文引用:4] [JCR: 1.702]
[35] Richard G A, Pereira L S, Raes D, et al. Crop Evapotranspiration-Guidelines for Computing Crop Water Requirements[M]. Rome, Italy: FAO Irrigation and Drainage, 1998: 56. [本文引用:1]
[36] Venturini V, Rodriguez L, Bisht G. A comparison among different modified Priestley and Taylor equations to calculate actual evapotranspiration with MODIS data[J]. International Journal of Remote Sensing, 2011, 32(5): 1 319-1 338. [本文引用:1]
[37] Kalma J D, Mcvicar T R, Mccabe M F. Estimating land surface evaporation: A review of methods using remotely sensed surface temperature data[J]. Surveys in Geophysics, 2008, 29(4/5): 421-469. [本文引用:2] [JCR: 4.125]
[38] Chehbouni A, Seen D L, Njoku E G, et al. Examination of the difference between radiative and aerodynamic surface temperature over sparsely vegetated surface[J]. Remote Sensing of Environment, 1996, 58(2): 177-186. [本文引用:1] [JCR: 5.103]
[39] Zhang Y, Liu C, Lei Y. An integrated algorithm for estimating regional latent heat flux and daily evapotranspiration[J]. International Journal of Remote Sensing, 2006, 27(1): 129-152. [本文引用:1]
[40] Qi Shuhua, Wang Junbang, Zhang Qingyuan, et al. Study on the estimation of air temperature from MODIS data[J]. Journal of Remote Sensing, 2005, 9(5): 570-575.
[齐述华, 王军邦, 张庆员, . 利用MODIS 遥感影像获取近地层气温的方法研究[J]. 遥感学报, 2005, 9(5): 570-575. ] [本文引用:1] [CJCR: 0.992]
[41] Zhu Shanyou, Zhang Guixin. Progress in near surface air temperature retrieved by remote sensing technology[J]. Advances in Earth Science, 2011, 26(7): 724-730.
[祝善友, 张桂欣. 近地表气温遥感反演研究进展[J]. 地球科学进展, 2011, 26(7): 724-730. ] [本文引用:3] [CJCR: 1.388]
[42] Cresswell M P, Morse A P, Thomson M C, et al. Estimating surface air temperature from Meteosat land surface temperature using an empirical solar zenith angle model[J]. International Journal of Remote Sensing, 1999, 20(6) : 1 125-1 132. [本文引用:2]
[43] Zhang Wenjian, Xu Jianmin, Fang Zongyi. Theory and Methods of Satellite Remote Sensing of Rainstorm System[M]. Beijing: China Meteorological Press, 2004: 57-112.
[张文建, 许建民, 方宗义. 暴雨系统的卫星遥感理论和方法[M]. 北京: 气象出版社, 2004: 57-112. ] [本文引用:2]
[44] Flores F, Lillo M. Simple air temperature estimation method from MODIS satellite images on a regional scale[J]. Clilean Journal of Agricultural Researth, 2010, 70(3): 436-445. [本文引用:1]
[45] Benali A, Carvalho A C, Nunes J P, et al. Estimating air surface temperature in Portugal using MODIS LST data[J]. Remote Sensing of Environment, 2012, 124: 108-121. [本文引用:3] [JCR: 5.103]
[46] Vogt J V, Viau A A, Paquet F. Mapping regioal air temperature fields using satellite-derived surface skin temperatures[J]. International Journal of Climatology, 1997, 17: 1 559-1 579. [本文引用:1] [JCR: 2.886]
[47] Vancutsem C, Ceccato P, Dinku T, et al. Evaluation of MODIS land surface temperature data to estimate air temperature in different ecosystems over Africa[J]. Remote Sensing of Environment, 2010, 114: 449-455. [本文引用:1] [JCR: 5.103]
[48] Lin S, Moore N J, Messina J P, et al. Evaluation of estimating daily maximum and minium air temperature with MODIS data in east Africa[J]. International Journal of Applied Earth Observation and Geoinformation, 2012, 18: 128-140. [本文引用:1] [JCR: 2.176]
[49] Goward S N, Cruickshanks G D, Hope A S. Observed relation between thermal emission and reflected spectral radiance of a complex vegetated land scape[J]. Remote Sensing of Environment, 1985, 18: 137-146. [本文引用:1] [JCR: 5.103]
[50] Stisen S, Sand holt I, Norgaard A, et al. Estimation of diurnal air temperature using MSG SEVIRI data in west Africa[J]. Remote Sensing of Environment, 2007, 110(2): 262-274. [本文引用:1] [JCR: 5.103]
[51] Nieto H, Sand holt I, Aguado I, et al. Air temperature estimation with MSG-SEVIRI data: Calibration and validation of the TVX algorithm for the lberian Peninsula[J]. Remote Sensing of Environment, 2011, 115(1): 107-116. [本文引用:1] [JCR: 5.103]
[52] Parviz L, Kholghi M, Valizadeh K H. Estimation of air temperature using temperature-vegetation index (TVX) method[J]. JWSS-Infahan University of Technology, 2011, 15(56): 21-34. [本文引用:1]
[53] Zhu W B, A F, Jia S F. Estimation of daily maximum and minimum air temperature using MODIS land surface temperature products[J]. Remote Sensing of Environment, 2013, 130: 62-73. [本文引用:1] [JCR: 5.103]
[54] Tang R L, Li Z L, Tang B H. An application of the Ts-VI triangle method with enhanced edges determination for evapotranspiration estimation from MODIS data in arid and semi-arid regions: Implementation and validation[J]. Remote Sensing of Environment, 2010, 114: 540-551. [本文引用:1] [JCR: 5.103]
[55] Jang J D, Viau A A, Anctil F. Neural network estimation of air temperatures from AVHRR data[J]. International Journal of Remote Sensing, 2004, 25(21): 4 541-4 554. [本文引用:1]
[56] Zhao D Z, Zhang W C, Xu S J. A neural network algorithm to retrieve near surface air temperature from land sat ETM+ imagery over the Hanjiang River Basin China[C]∥The 2007 International Geoscience and Remote Sensing Symposium. Barcelona, Spain: IEEE, 2007: 1705-1 708. [本文引用:1]
[57] Sun Y J, Wang J F, Zhang R H, et al. Air temperature retrieval from remote sensing data based on thernodynamics[J]. Theoretical Applied Climatology, 2005, 80: 37-48. [本文引用:1]
[58] Zaksek K, Schroedter H M. Parameterization of air temperature in high temporal and spatial resolution from a combination of the SEVIRI and MODIS instruments[J]. ISPRS Journal of Photogrammetry and Remote Sensing, 2009, 64(4): 414-421. [本文引用:2] [JCR: 3.313]
[59] Li Jun, Zeng Qingcun. Infrared remote sensing of clear atmosphere and its inversion problem. Part I: Theoretical study[J]. Scientia Atmospherica Sinica, 1997, 21(1): 1-9.
[李俊, 曾庆存. 晴空时大气红外遥感及其反演问题[J]. 大气科学, 1997, 21(1): 1-9. ] [本文引用:1]
[60] Reitan C H. Surface dewpoint and water vapour aloft[J]. Journal of Applied Meteorology, 1963, 2: 776-779.
[61]Ojo O.  The distribution of mean monthly precipitable water vapour and annual precipitation efficiency in Nigeria[J]. Archivfiir Meteorologie, Geophysik and Bioklimatologie, 1970, 18: 221-238. [本文引用:2] [JCR: 1.702]
[62] Reber E E, Swope J R. On the correlation of the total precipitable water in a vertical column and absolute humidity at the surface[J]. Journal of Applied Meteorology, 1972, 11: 1 322-1 325. [本文引用:2] [JCR: 1.702]
[63] Adedokun J A. On a relationship for estimating precipitable water vapour aloft from surface humidity over West Africa[J]. International Journal of Climatology, 1986, 6(2): 161-172. [本文引用:1] [JCR: 2.886]
[64] Adedokun J A. Surface humidity and precipitable water vapour linkage over west and central Africa: Further clarification and evaluation of existing models[J]. International Journal of Climatology, 1989, 9(4): 425-433.
[65]Adeyemi B.  Empirical modeling of layered integrated water vapour using surface mixing ratio in Nigeria[65]Adeyemi B.  Empirical modeling of layered integrated water vapour using surface mixing ratio in Nigeria[J]. Journal of Applied Meteorology and Climatology, 2008, 48: 369-380. [本文引用:1] [JCR: 2.886]
[66] Yang Jingmei, Qiu Jinheng. The empirical expressions of the relation between precipitable water and ground water vapor pressure for some areas in China[J]. Scientia Atmospherica Sinica, 1996, 20(5): 620-626.
[杨景梅, 邱金恒. 我国可降水量同地面水汽压的经验表达式[J]. 大气科学, 1996, 20(5): 620-626. ] [本文引用:1]
[67] Sobrino J A, EI-Kharraz J, Li Z. Surface temperature and water vapor retrieval from MODIS data[J]. International Journal of Remote Sensing, 2003, 20: 5 161-5 182. [本文引用:2]
[68] Peng G X, Li J, Chen Y H. High-resolution surface relative humidity computation using MODIS image in Peninsular Malaysia[J]. Chinese Geographical Science, 2006, 16(3): 260-264. [本文引用:1] [JCR: 0.5] [CJCR: 0.7263]
[69] Han K S, Viau A A, Kim Y S, et al. Statistical estimate of the hourly near-surface air humidity in eastern Canada in merging NOAA/AVHRR and GOES/IMAGER observations[J]. International Journal of Remote Sensing, 2005, 26(21): 4 763-4 784. [本文引用:1]
[70] Recondo C, Pendás E, Moreno S, et al. A simple empirical method for estimating surface water vapour pressure using MODIS near-infrared channels: Applications to northern Spain’s Asturias region[J]. International Journal of Remote Sensing, 2013, 34(9/10): 3 248-3 273. [本文引用:1]
[71] Tang Renmao, Chen Yingying, Ye Jianyuan. The comparison of water vapor content retrieved by radiosonde, ground station and satellite data[J]. Scientia Meteorologic Sinica, 2010, 30(3): 373-377.
[唐仁茂, 陈英英, 叶建元. 探空、地面及FY-2C卫星资料反演水汽含量的比较[J]. 气象科学, 2010, 30(3): 373-377. ] [本文引用:1]
[72] Huang Yaohuan, Jiang Dong, Zhuang Dafang, et al. Estimation of the surface vapor pressure based on the MODIS images[J]. Progress in Geography, 2010, 29(9): 1 137-1 142.
[黄耀欢, 江东, 庄大方, . 基于MODIS遥感数据地表水汽压估算[J]. 地理科学进展, 2010, 29(9): 1 137-1 142. ] [本文引用:1] [CJCR: 1.959]
[73] Zhang Dan, Liu Changming, Fu Yongfeng, et al. Estimation and analysis of near surface vapor pressure in China based on MODIS data[J]. Resources Science, 2012, 34(1): 74-80.
[张丹, 刘昌明, 付永锋, . 基于MODIS数据的中国地面水汽压模拟与分析[J]. 资源科学, 2012, 34(1): 74-80. ] [本文引用:1] [CJCR: 2.123]
[74] Yu Fan, Liu Changsheng, Yu Zhihao. Humidity fields analysis in daytime cloudy sky with multi-spectral satellite information[J]. Acta Meteorologica Sinica, 2002, 60(6): 748-757.
[郁凡, 刘长盛, 余志豪. 用多光谱卫星信息分析白昼云天条件下的湿度场[J]. 气象学报, 2002, 60(6): 748-757. ] [本文引用:1] [JCR: 0.799] [CJCR: 0.363]
[75] Bisht G, Bras R L. Estimation of net radiation from the MODIS data under all sky conditions: Southern Great Plains case study[J]. Remote Sensing of Environment, 2010, 114: 1 522-1 534. [本文引用:1] [JCR: 5.103]
[76] Freitas S C, Trigo I F, Macedo J, et al. Land surface temperature from multiple geostationary satellites[J]. International Journal of Remote Sensing, 2013, 34(9/10): 3 051-3 068. [本文引用:1]
[77] Crosson W L, AI-Hamdan Z, Wade G M, et al. A daily merged MODIS Aqua-Terra land surface temperature data set for the conterminous United States[J]. Remote Sensing of Environment, 2012, 119: 315-324. [本文引用:1] [JCR: 5.103]
[78] Sun J, Salvucci G D, Entekhabi D. Estimates of evapotranspiration from MODIS and AMSR-E land surface temperature and moisture over the Southern Great Plains[J]. Remote Sensing of Environment, 2012, 127: 44-59. [本文引用:1] [JCR: 5.103]