累积海冰密集度及其在认识北极海冰快速变化的作用
 , 赵进平
, 赵进平 Accumulation Sea Ice Concentration and Its Action on Understanding Arctic Sea Ice Dramatic Change
Wang Weibo, Zhao Jinping
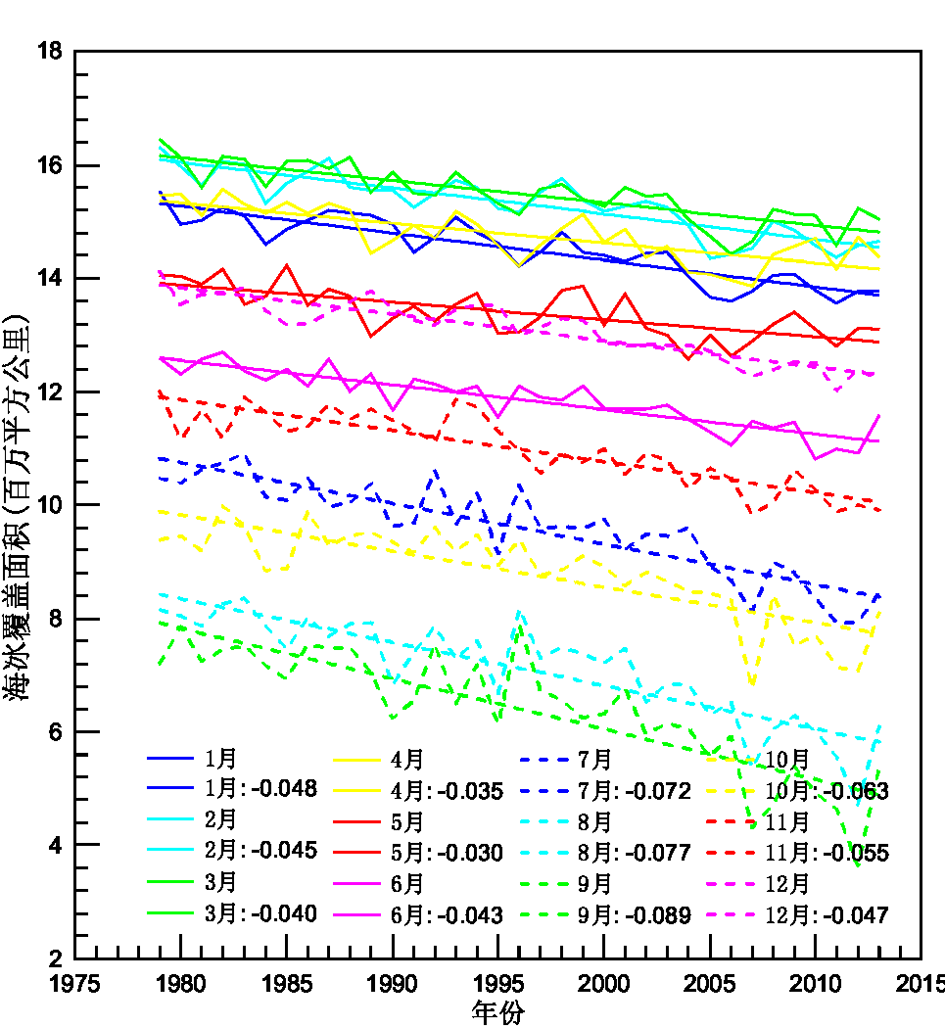
, Zhao Jinping Fig. 1 Monthly variation of Arctic sea ice extent from 1979 to 2013polyline and their respective linear regression line straight line The underneath in figure presents monthly declining rate of sea ice extent.