农田下垫面观测通量的变化特征及其气候学足迹分析
 , 赵谦益, 徐同仁
Analysis of the Characteristics of Turbulent Flux and Its Footprint Climatology at An Agricultural Site
Zhu Mingjia1, 2 , Zhao Qianyi1 , Liu Shaomin1 , Xu Ziwei1 , Xu Tongren1
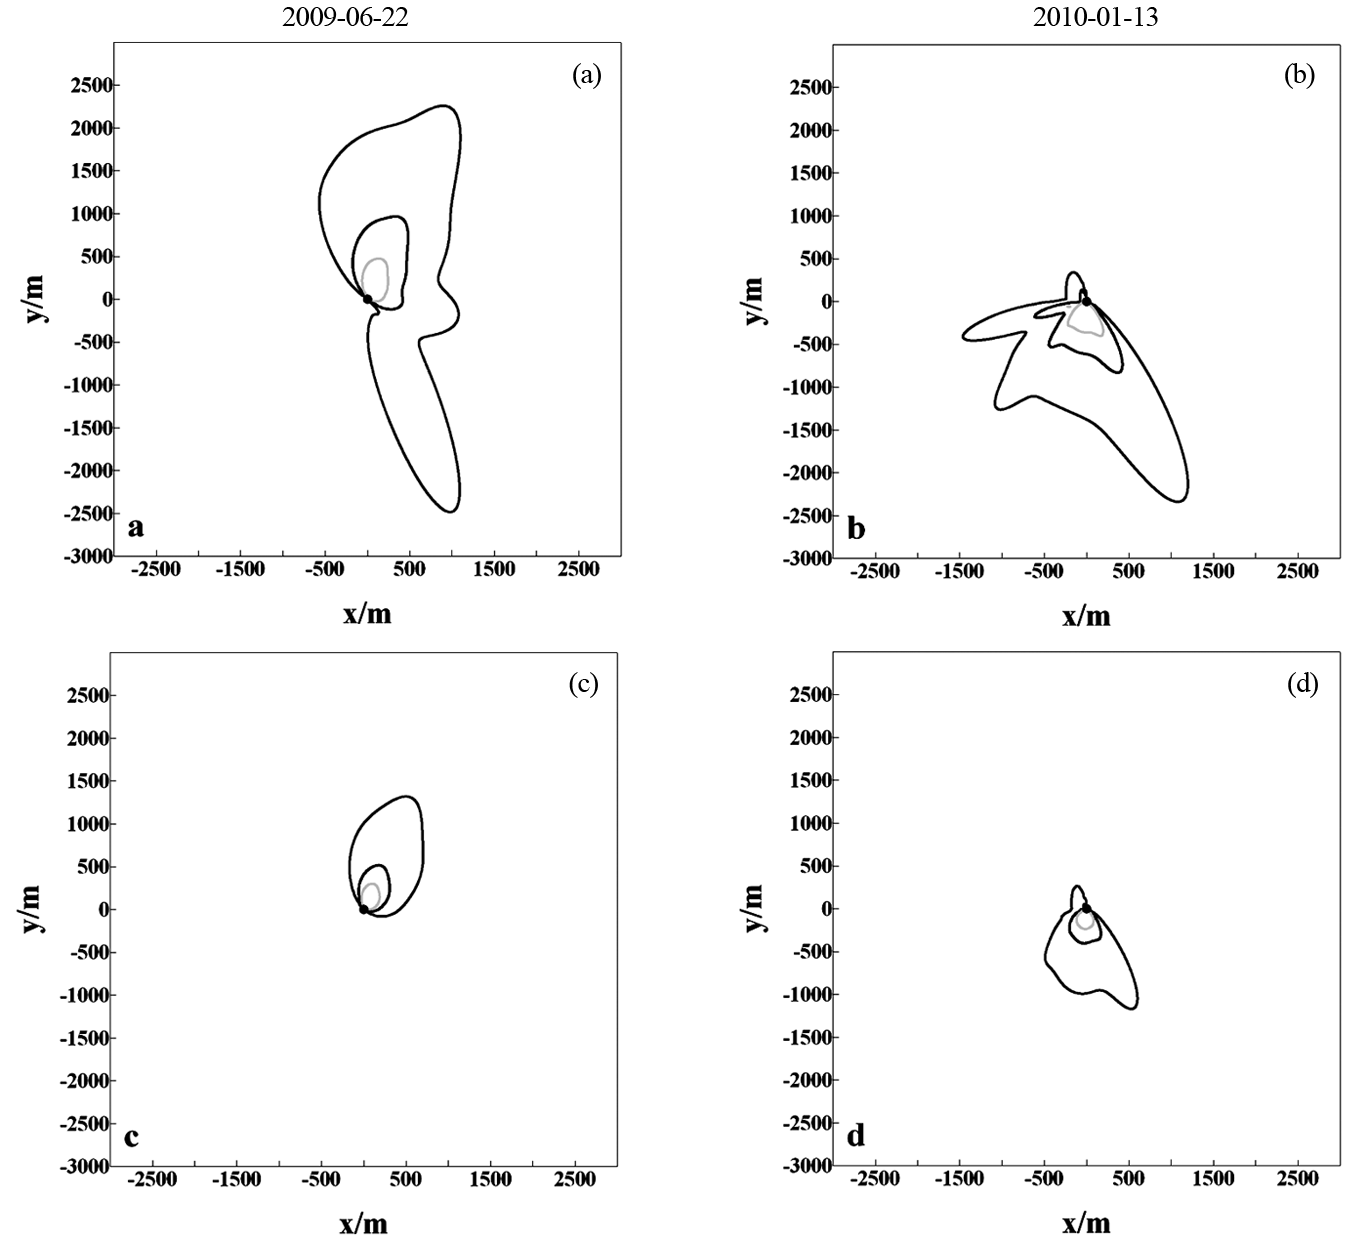
, Zhao Qianyi, Xu ZiweiFig.8 Source areas of flux measurement at daily scale contour : green, blue, red denotes 50%、70%、90% footprint contribution, x,y represents the east-west and north-north distance from the observation station, respectively